Scaricare la presentazione
La presentazione è in caricamento. Aspetta per favore

2
Scuola di uro Oncologia CONTROVERSIE ONCOLOGICHE
L’oncologo risponde all’urologo: PRIMA LINEA DI TRATTAMENTO G. Cartenì Direttore U.O.S.C. di Oncologia Medica A.O.R.N. A. Cardarelli Napoli Roma, 12/13 Luglio 2013

3
Quali criteri vengono utilizzati per scegliere il farmaco da utilizzare in prima linea ?
Come monitorizzare la terapia ? Criteri di successo/insuccesso La gestione delle complicanze/effetti collaterali Trattamento delle metastasi ossee Associazione di farmaci ? terapie sequenziali ?

4
How to choose first line treatment
Prognostic profile (Motzer/Heng) Toxicity profile and comorbidities Disease characteristics (site/sympthoms) Sequential strategies Oral/iv administration Physician experience Patient preference Biomarkers in development…!
 Toxicity profile and comorbidities. Disease characteristics (site/sympthoms) Sequential strategies. Oral/iv administration. Physician experience. Patient preference. Biomarkers in development…!")
6
Linee Guida EAU 2010

7
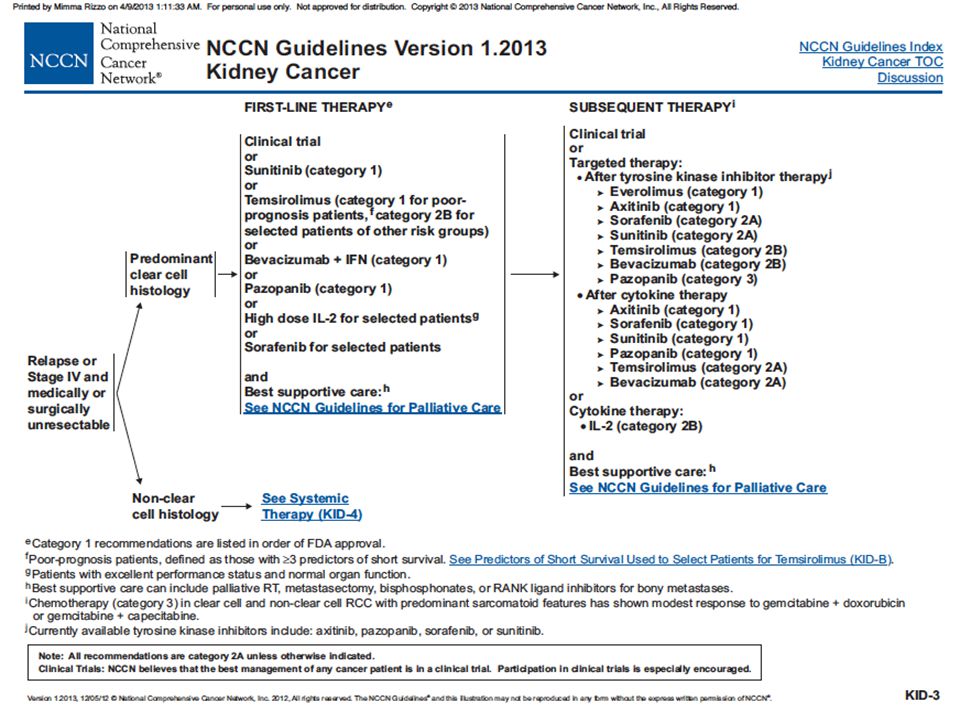
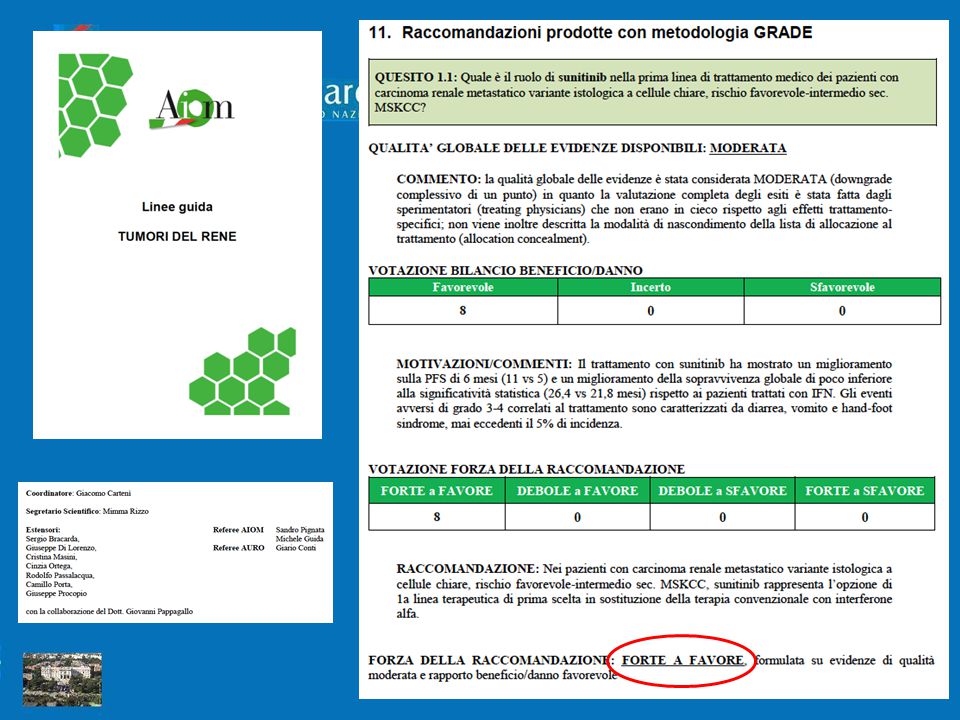
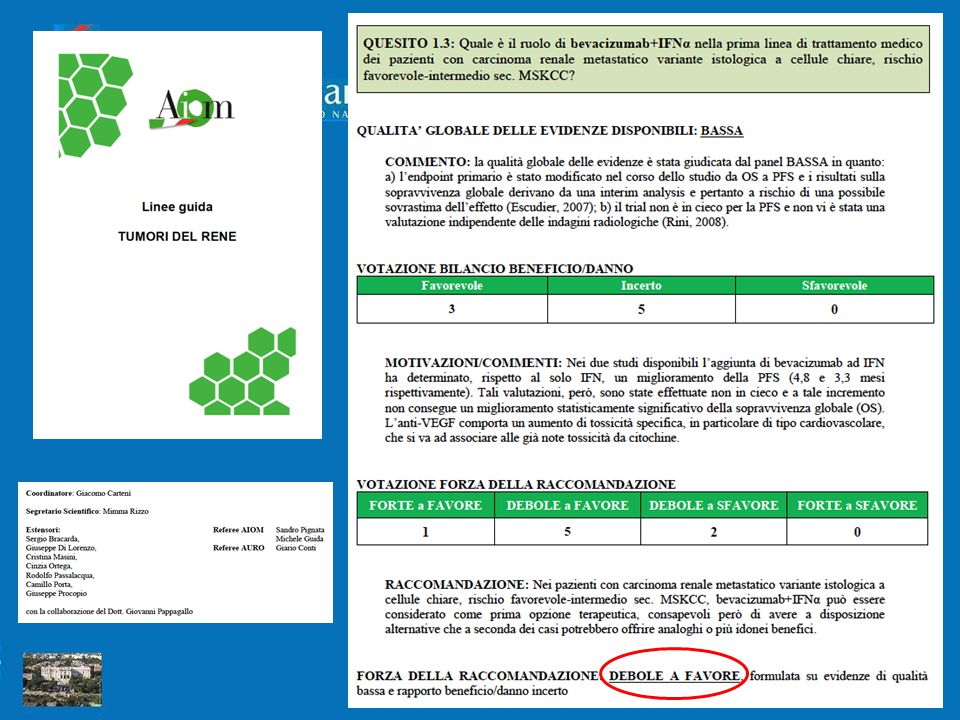
First-line treatment guidelines for clear cell mRCC: ESMO 2012
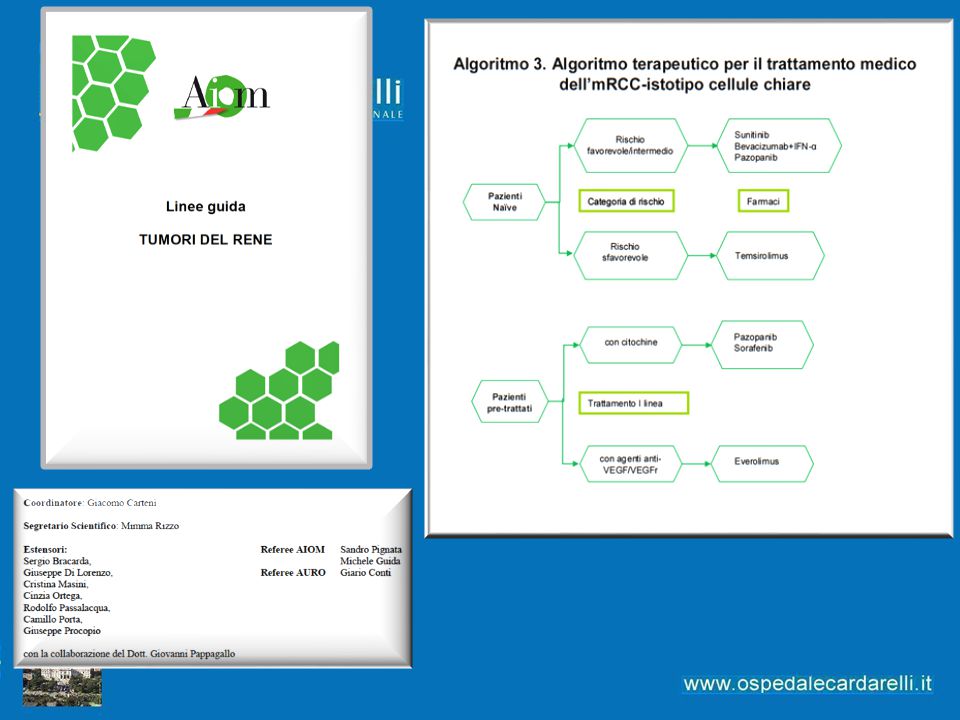
Risk status Recommendation Level of evidence Favourable or intermediate Sunitinib Bevacizumab + IFN-α Pazopanib I, A II, A Poor risk Temsirolimus Escudier B, et al. Ann Oncol 2012;23(Suppl 7):vii65–71
:vii65–71.")
16
How to choose first line treatment
Prognostic profile (Motzer/Heng) Toxicity profile and comorbidities Disease characteristics (site/sympthoms) Sequential strategies Oral/iv administration Physician experience Patient preference Biomarkers in development…!
 Toxicity profile and comorbidities. Disease characteristics (site/sympthoms) Sequential strategies. Oral/iv administration. Physician experience. Patient preference. Biomarkers in development…!")
17
Randomized, Open Label, Phase III Trial of Pazopanib versus Sunitinib in First-line Treatment of Patients with Metastatic Renal Cell Carcinoma (mRCC): Results of the COMPARZ Trial Robert Motzer1, T. E. Hutson2, James Reeves3, Robert Hawkins4, Jun Guo5, Paul Nathan6, Michael Staehler7, Paul de Souza8, Jaime R. Merchan9, Kate Fife10, Jie Jin11, Robert Jones12, Hirotsugu Uemura13, Ugo De Giorgi14, Ulrika Harmenberg15, Jinwan Wang16, David Cella17, Lauren McCann18, Keith Deen18, and Toni K. Choueiri19 1Memorial Sloan Kettering Cancer Center, NY, NY, USA; 2Baylor Sammons Cancer Center/Texas Oncology, Dallas, TX, USA; 3Florida Cancer Specialists, Fort Myers, FL, USA; 4University of Manchester and The Christie Hospital, NHS Foundation Trust, Manchester, United Kingdom; 5 Renal Cancer and Melanoma Unit, Peking University Cancer Hospital, Beijing, China; 6Mount Vernon Hospital, Middlesex, United Kingdom;7 Department of Urology, Interdisciplinary Centre on Renal Tumors, University of Munich, Munich, Germany; 8University of Western Sydney School of Medicine, MMRG, CRG, Sydney, Australia; 9 University of Miami, Sylvester Cancer Center, Miami, FL, USA:10 Oncology Centre, Addenbrooke's Hospital, Cambridge, United Kingdom; 11 Peking University First Hospital, Beijing, China; 12Institute of Cancer Sciences University of Glasgow, Glasgow, United Kingdom;13 Department of Urology, Kinki University Faculty of Medicine, Osaka, Japan; 14IRCCS Istituto Scientifico Romagnolo per lo Studio e la Cura dei Tumori (I.R.S.T.), Meldola, Italy; 15Department of Oncology, Radiumhemmet Karolinska University Hospital, Stockholm, Sweden; 16 Cancer Hospital, CAMS & PUMC, Beijing, China; 17Robert H. Lurie Comprehensive Cancer Center of Northwestern University, Chicago, IL , USA; 18GlaxoSmithKline, Inc., Collegeville, PA, USA; 10Department of Medical Oncology, Dana-Farber Cancer Institute, Boston, MA, USA
, Meldola, Italy; 15Department of Oncology, Radiumhemmet Karolinska University Hospital, Stockholm, Sweden; 16 Cancer Hospital, CAMS & PUMC, Beijing, China; 17Robert H. Lurie Comprehensive Cancer Center of Northwestern University, Chicago, IL , USA; 18GlaxoSmithKline, Inc., Collegeville, PA, USA; 10Department of Medical Oncology, Dana-Farber Cancer Institute, Boston, MA, USA.")
18
COMPARZ: PFS (IRC-assessed)
Non-inferiority met if upper bound of 95% CI for HR <1.25 (EMA requested ≤1.223) PFS (ITT population) Pazopanib (n=557) Sunitinib (n=553) Median PFS, months (95% CI) 8.4 (8.3, 10.9) 9.5 (8.3, 11.1) HR (95% CI) (0.8982, ) PFS (PP population) Pazopanib (n=501) Sunitinib (n=494) 10.2 (8.3, 11.1) 1.069 (0.910, 1.255) PP, per-protocol 1. GSK. Clinical Study Register. Study Available at: (last accessed February 2013); 2. Motzer RJ, et al. Presented at ESMO 2012; Abstract LBA8; 3. Available at (last accessed April 2013)
 PFS (ITT population) Pazopanib (n=557) Sunitinib (n=553) Median PFS, months (95% CI) 8.4 (8.3, 10.9) 9.5 (8.3, 11.1) HR (95% CI) (0.8982, ) PFS (PP population) Pazopanib (n=501) Sunitinib (n=494) 10.2 (8.3, 11.1) (0.910, 1.255) PP, per-protocol. 1. GSK. Clinical Study Register. Study Available at: (last accessed February 2013); 2. Motzer RJ, et al. Presented at ESMO 2012; Abstract LBA8; 3. Available at (last accessed April 2013)")
19
COMPARZ: PFS (IRC-assessed)
Non-inferiority met if upper bound of 95% CI for HR <1.25 (EMA requested ≤1.223) PFS (ITT population) Pazopanib (n=557) Sunitinib (n=553) Median PFS, months (95% CI) 8.4 (8.3, 10.9) 9.5 (8.3, 11.1) HR (95% CI) (0.8982, ) PFS (PP population) Pazopanib (n=501) Sunitinib (n=494) 10.2 (8.3, 11.1) 1.069 (0.910, 1.255) PP, per-protocol 1. GSK. Clinical Study Register. Study Available at: (last accessed February 2013); 2. Motzer RJ, et al. Presented at ESMO 2012; Abstract LBA8; 3. Available at (last accessed April 2013)
 PFS (ITT population) Pazopanib (n=557) Sunitinib (n=553) Median PFS, months (95% CI) 8.4 (8.3, 10.9) 9.5 (8.3, 11.1) HR (95% CI) (0.8982, ) PFS (PP population) Pazopanib (n=501) Sunitinib (n=494) 10.2 (8.3, 11.1) (0.910, 1.255) PP, per-protocol. 1. GSK. Clinical Study Register. Study Available at: (last accessed February 2013); 2. Motzer RJ, et al. Presented at ESMO 2012; Abstract LBA8; 3. Available at (last accessed April 2013)")
20
COMPARZ: PFS (IRC-assessed)
Non-inferiority met if upper bound of 95% CI for HR <1.25 (EMA requested ≤1.223) PFS (ITT population) Pazopanib (n=557) Sunitinib (n=553) Median PFS, months (95% CI) 8.4 (8.3, 10.9) 9.5 (8.3, 11.1) HR (95% CI) (0.8982, ) PFS (PP population) Pazopanib (n=501) Sunitinib (n=494) 10.2 (8.3, 11.1) 1.069 (0.910, 1.255) PP, per-protocol 1. GSK. Clinical Study Register. Study Available at: (last accessed February 2013); 2. Motzer RJ, et al. Presented at ESMO 2012; Abstract LBA8; 3. Available at (last accessed April 2013)
 PFS (ITT population) Pazopanib (n=557) Sunitinib (n=553) Median PFS, months (95% CI) 8.4 (8.3, 10.9) 9.5 (8.3, 11.1) HR (95% CI) (0.8982, ) PFS (PP population) Pazopanib (n=501) Sunitinib (n=494) 10.2 (8.3, 11.1) (0.910, 1.255) PP, per-protocol. 1. GSK. Clinical Study Register. Study Available at: (last accessed February 2013); 2. Motzer RJ, et al. Presented at ESMO 2012; Abstract LBA8; 3. Available at (last accessed April 2013)")
21
COMPARZ study design: Phase III, open-label, non-inferiority trial
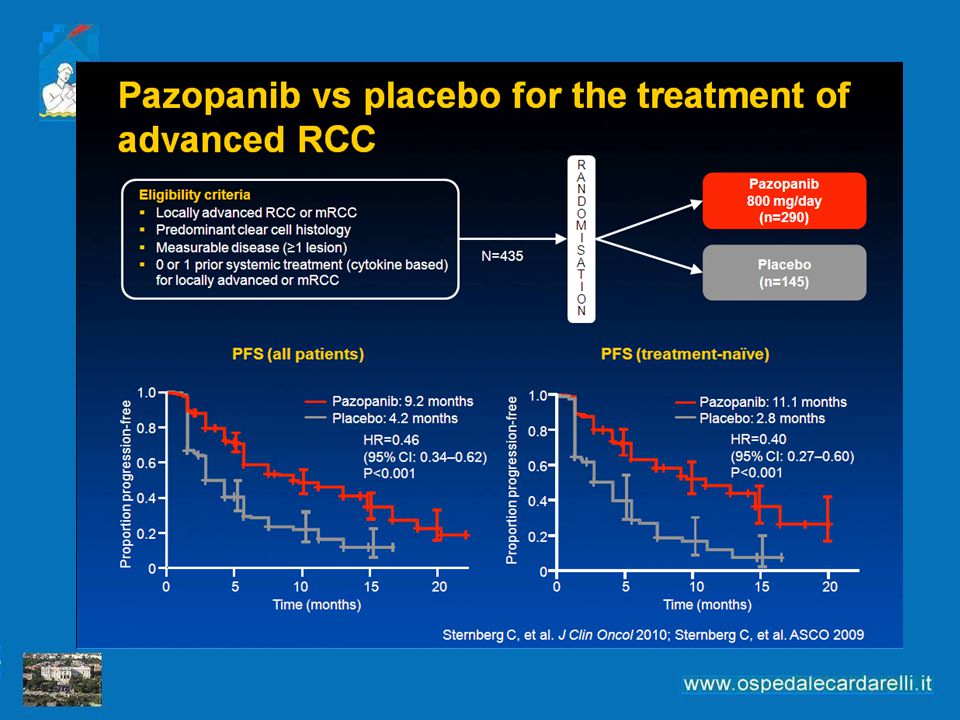
1/Data on file (USPI)/ p14 (clinical studies) Pazopanib 800 mg QD Continuous daily dosing Enrolment criteria: Locally advanced or mRCC Clear-cell histology No prior systemic therapy Measurable disease (RECIST 1.0) KPS ≥70 Adequate organ function 2/Rini 2011 p1932/c2/¶4; p 1933/col 1/¶2 2/Rini 2011 p1932/col 2/¶3 Randomised 1:1 N=927 Sunitinib 50 mg QD Schedule 4/2 N=1,110 Study start: August 2008 VEG108844 Phase III n=927 VEG113078 Phase II (Asia) n=183 COMPARZ: 1,110 patients KPS, Karnofsky Performance Scale; RECIST, Response Evaluation Criteria in Solid Tumors; Schedule 4/2, 4 weeks on treatment, 2 weeks off (NCT ; NCT )
/ p14 (clinical studies) Pazopanib 800 mg QD Continuous daily dosing. Enrolment criteria: Locally advanced or mRCC. Clear-cell histology. No prior systemic therapy. Measurable disease (RECIST 1.0) KPS ≥70. Adequate organ function. 2/Rini 2011 p1932/c2/¶4; p 1933/col 1/¶2. 2/Rini 2011 p1932/col 2/¶3. Randomised 1:1. N=927. Sunitinib 50 mg QD. Schedule 4/2. N=1,110. Study start: August VEG Phase III n=927. VEG Phase II (Asia) n=183. COMPARZ: 1,110 patients. KPS, Karnofsky Performance Scale; RECIST, Response Evaluation Criteria in Solid Tumors; Schedule 4/2, 4 weeks on treatment, 2 weeks off. (NCT ; NCT )")
22
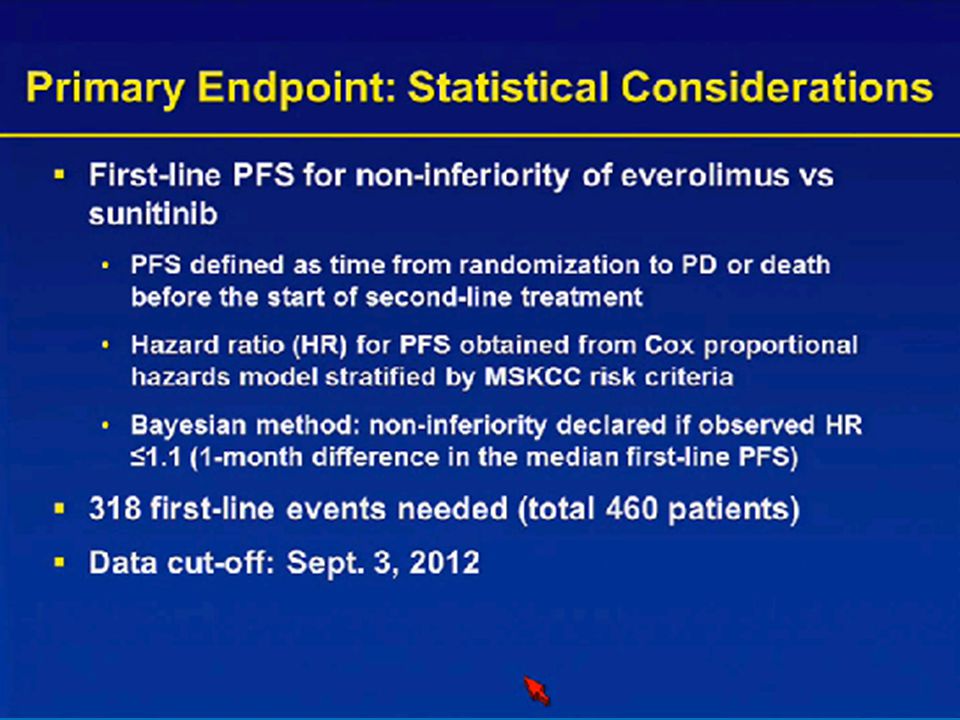
Primary Endpoint: Progression-free Survival (independent review)
Median PFS (95% CI) Pazopanib 557 8.4 mo (8.3, 10.9) Sunitinib 553 9.5 mo (8.3, 11.1) HR (95% CI ) = (0.898,1.220) Pazopanib Sunitinib
 Pazopanib mo (8.3, 10.9) Sunitinib mo (8.3, 11.1) HR (95% CI ) = (0.898,1.220) Pazopanib. Sunitinib.")
23
Interim Analysis of Overall Survival
Median OS (95% CI) Pazopanib 557 28.4 mos (26.2, 35.6) Sunitinib 553 29.3 mos (25.3, 32.5) HR (95% CI ) = (0.762,1.082) P-value = 0.275 Pazopanib Sunitinib 23 23
 Pazopanib mos (26.2, 35.6) Sunitinib mos (25.3, 32.5) HR (95% CI ) = (0.762,1.082) P-value = Pazopanib. Sunitinib")
24
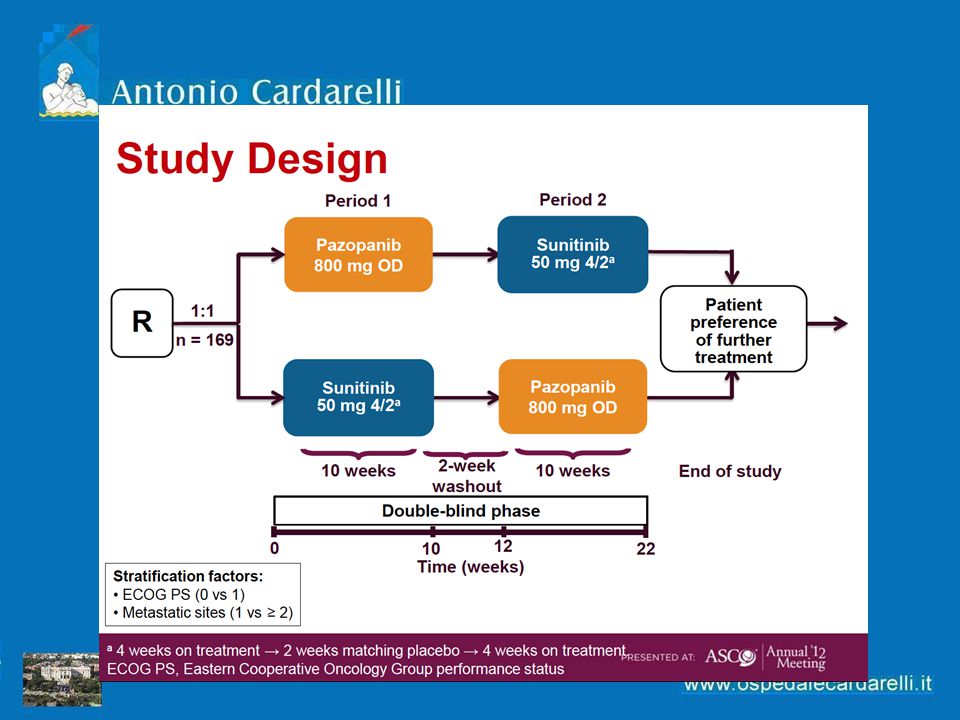
COMPARZ: Timing of assessments
Sunitinib Pazopanib Week 6 Week 6 Week 6 Disease assessments Mean change from baseline The design and conduct of the non-inferiority study need to be shown to be similar to the studies of the comparator drug that were successful in the past, with particular attention to critical design characteristics such as the endpoints measured and timing of assessments (International Conference on Harmonization guidelines, 1999). In relation to this, we observed an important deviation in the timing of efficacy/disease assessments (primary endpoint) in COMPARZ in comparison to the pivotal phase 3 study of sunitinib that led to its registration as a first-line mRCC therapy (Motzer et al, 2007 & 2009) : in the latter the disease assessments were scheduled at the end of the 4 weeks of active sunitinib treatment of the recommended 6-week sunitinib cycle for mRCC (4 weeks of treatment followed by 2 weeks without treatment, the so-called schedule 4/2), whereas they were scheduled at the end of the 2 weeks sunitinib treatment break in COMPARZ. Could this difference in disease assessments have impacted the results of sunitinib in this study and could it have impacted the main outcome of COMPARZ , i.e. its conclusion of non-inferiority of pazopanib to sunitinib? We believe that there are strong indications for these possibilities. Ref.: Belg J Med Oncol 2013;7:3-7 QoL assessments Week 4 Week 4 Week 4 Time QoL, quality of life Motzer RJ, et al. Presented at ESMO 2012; Abstract LBA8 Cella D, et al. Presented at ASCO-GU 2012; Abstract 346
. In relation to this, we observed an important deviation in the timing of efficacy/disease assessments (primary endpoint) in COMPARZ in comparison to the pivotal phase 3 study of sunitinib that led to its registration as a first-line mRCC therapy (Motzer et al, 2007 & 2009) : in the latter the disease assessments were scheduled at the end of the 4 weeks of active sunitinib treatment of the recommended 6-week sunitinib cycle for mRCC (4 weeks of treatment followed by 2 weeks without treatment, the so-called schedule 4/2), whereas they were scheduled at the end of the 2 weeks sunitinib treatment break in COMPARZ. Could this difference in disease assessments have impacted the results of sunitinib in this study and could it have impacted the main outcome of COMPARZ , i.e. its conclusion of non-inferiority of pazopanib to sunitinib We believe that there are strong indications for these possibilities. Ref.: Belg J Med Oncol 2013;7:3-7. QoL assessments. Week 4. Week 4. Week 4. Time. QoL, quality of life. Motzer RJ, et al. Presented at ESMO 2012; Abstract LBA8 Cella D, et al. Presented at ASCO-GU 2012; Abstract 346.")
25
Most Common Adverse Events (treatment-emergent)
Adverse Event a Pazopanib (n = 554) % Sunitinib (n = 548) % All Grs Gr 3/4 Any event b >99 59/15 57/17 Diarrhea 63 9/0 57 7/<1 Fatigue 55 10/<1 17/<1 Hypertension 46 15/<1 41 Nausea 45 2/0 Decreased appetite 37 1/0 3/0 ALT increased 31 10/2 18 2/<1 Hair color changes 30 0/0 10 <1/0 Hand-foot syndrome 29 6/0 50 11/<1 Taste Alteration 26 36 Thrombocytopenia 34 12/4 a AE ≥30% in either arm b 2% of patients in pazopanib arm and 3% of patients in sunitinib arm had grade 5 adverse events. 25
 % Sunitinib (n = 548) % All Grs. Gr 3/4. Any event b. >99. 59/15. 57/17. Diarrhea / /<1. Fatigue /<1. 17/<1. Hypertension /< Nausea /0. Decreased appetite /0. 3/0. ALT increased / /<1. Hair color changes / <1/0. Hand-foot syndrome / /<1. Taste Alteration Thrombocytopenia /4. a AE ≥30% in either arm. b 2% of patients in pazopanib arm and 3% of patients in sunitinib arm had grade 5 adverse events. 25.")
26
COMPARZ: Common AEs (treatment-emergent)
Pazopanib (n=554), % Sunitinib (n=548), % Risk ratio 95% CI All grades Grade 3/4 Any event† >99 59/15 57/17 NA Diarrhoea 63 9/0 57 7/<1 1.09 0.99, 1.20 Fatigue 55 10/<1 17/<1 0.87 0.79, 0.96 Hypertension 46 15/<1 41 1.14 1.00, 1.31 Nausea 45 2/0 0.98 0.86, 1.11 Decreased appetite 37 1/0 3/0 ALT increased 31 10/2 18 2/<1 1.74 1.40, 2.17 Hair colour changes 30 0/0 10 <1/0 HFS 29 6/0 50 11/<1 0.59 0.50, 0.68 Taste alteration 26 36 Thrombocytopenia 34 12/4 0.30 0.23, 0.40 *AE ≥30% in either arm; †2% of patients in pazopanib arm and 3% of patients in sunitinib arm had grade 5 AEs ALT, alanine transaminase; AST, aspartate transaminase; HFS, hand–foot syndrome; NA, not applicable 26
, % Sunitinib (n=548), % Risk ratio. 95% CI. All grades. Grade 3/4. Any event† >99. 59/15. 57/17. NA. Diarrhoea / /< , Fatigue /<1. 17/< , Hypertension /< , Nausea / , Decreased appetite /0. 3/0. ALT increased / /< , Hair colour changes / <1/0. HFS / /< , Taste alteration Thrombocytopenia / , *AE ≥30% in either arm; †2% of patients in pazopanib arm and 3% of patients in sunitinib arm had grade 5 AEs. ALT, alanine transaminase; AST, aspartate transaminase; HFS, hand–foot syndrome; NA, not applicable. 26.")
27
Treatment Duration and Dose Adjustments
Pazopanib (n = 554) Sunitinib (n = 548) Median duration of treatment (months, range) 8.0 (0−40) 7.6 (0−38) Dose reductions, % 44 51 Discontinuations due to AEs1, % 24 19 1. Most common reason: pazopanib arm (liver event, 6%); sunitinib arm (cytopenia, 3%)
 Sunitinib. (n = 548) Median duration of treatment. (months, range) 8.0 (0−40) 7.6 (0−38) Dose reductions, % Discontinuations due to AEs1, % Most common reason: pazopanib arm (liver event, 6%); sunitinib arm (cytopenia, 3%)")
28
Quality of Life Results (first 6 months1)
Instrument Domain Description Treatment difference : mean change from baseline 2 P -value FACIT-F Fatigue/Total score 2.32 <0.001 FKSI-19 Kidney Symptom Index/Total score 1.41 0.018 Physical 0.78 0.027 Emotional 0.05 0.409 Treatment Side Effects 0.31 0.033 Functional Well Being 0.098 Cancer Treatment Satisfaction Questionnaire (CTSQ) Expectations of Therapy 0.284 Feelings about Side Effects 8.50 Satisfaction with Therapy 3.21 SupplementaryQuality of Life Questionnaire (SQLQ) Worst mouth/throat soreness 0.505 <0.0001 Worst foot soreness 0.204 0.0016 Worst hand soreness 0.267 0.0008 Limitations due to mouth/throat soreness 0.94 Limitations due to foot soreness 0.65 0.014 1Pre-specified analysis. HRQoL changes in mean scores over time were analyzed with a repeated measures analysis of covariance (ANCOVA). 2Yellow Font: favors pazopanib. Blue Font: favors sunitinib. P-value <0.05 is statistically significant
 Expectations of Therapy Feelings about Side Effects Satisfaction with Therapy SupplementaryQuality of Life Questionnaire (SQLQ) Worst mouth/throat soreness < Worst foot soreness Worst hand soreness Limitations due to mouth/throat soreness Limitations due to foot soreness Pre-specified analysis. HRQoL changes in mean scores over time were analyzed with a repeated measures analysis of covariance (ANCOVA). 2Yellow Font: favors pazopanib. Blue Font: favors sunitinib. P-value <0.05 is statistically significant.")
29
Quality of Life Results (first 6 months1)
Instrument Domain Description Treatment difference : mean change from baseline 2 P -value FACIT-F Fatigue/Total score 2.32 <0.001 FKSI-19 Kidney Symptom Index/Total score 1.41 0.018 Physical 0.78 0.027 Emotional 0.05 0.409 Treatment Side Effects 0.31 0.033 Functional Well Being 0.098 Cancer Treatment Satisfaction Questionnaire (CTSQ) Expectations of Therapy 0.284 Feelings about Side Effects 8.50 Satisfaction with Therapy 3.21 SupplementaryQuality of Life Questionnaire (SQLQ) Worst mouth/throat soreness 0.505 <0.0001 Worst foot soreness 0.204 0.0016 Worst hand soreness 0.267 0.0008 Limitations due to mouth/throat soreness 0.94 Limitations due to foot soreness 0.65 0.014 1Pre-specified analysis. HRQoL changes in mean scores over time were analyzed with a repeated measures analysis of covariance (ANCOVA). 2Yellow Font: favors pazopanib. Blue Font: favors sunitinib. P-value <0.05 is statistically significant
 Expectations of Therapy Feelings about Side Effects Satisfaction with Therapy SupplementaryQuality of Life Questionnaire (SQLQ) Worst mouth/throat soreness < Worst foot soreness Worst hand soreness Limitations due to mouth/throat soreness Limitations due to foot soreness Pre-specified analysis. HRQoL changes in mean scores over time were analyzed with a repeated measures analysis of covariance (ANCOVA). 2Yellow Font: favors pazopanib. Blue Font: favors sunitinib. P-value <0.05 is statistically significant.")
30
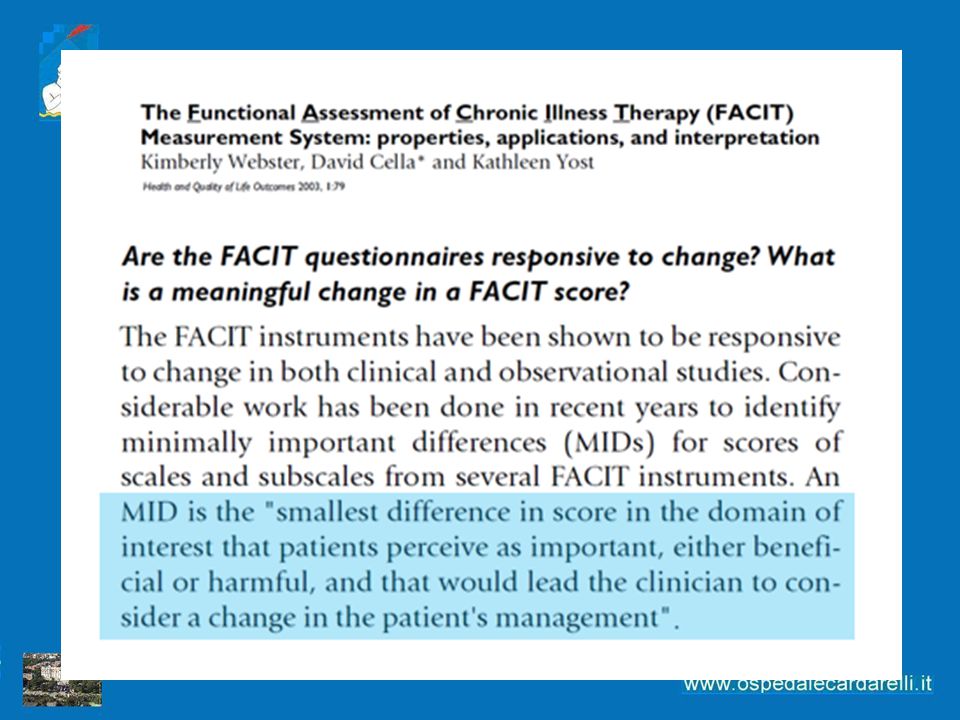
Quality of Life Results: PISCES1 Randomized double-blind, placebo-controlled, cross-over study in patients with metastatic renal cell carcinoma Instrument Timing Domain Description Treatment difference2,3 P value FACIT- F Every 2 weeks Fatigue/Total score 2.5 0.002 Supplementary Quality of Life Questionnaire Worst mouth/throat soreness 0.38 <0.001 Worst foot soreness 0.08 0.026 Worst hand soreness 0.16 0.005 Limitations due to mouth/throat soreness 0.60 Limitations due to foot soreness 0.58 0.003 Escudier BJ, et al.. J Clin Oncol 30, 2012 (suppl; abstr CRA4502) Cella D, et al. ESMO Congress 2012 poster 792PD Yellow Font: favors pazopanib P-value <0.05 is statistically significant
 Cella D, et al. ESMO Congress 2012 poster 792PD. Yellow Font: favors pazopanib. P-value <0.05 is statistically significant.")
32
How to choose first line treatment
Prognostic profile (Motzer/Heng) Toxicity profile and comorbidities Disease characteristics (site/sympthoms) Sequential strategies Oral/iv administration Physician experience Patient preference Biomarkers in development…!
 Toxicity profile and comorbidities. Disease characteristics (site/sympthoms) Sequential strategies. Oral/iv administration. Physician experience. Patient preference. Biomarkers in development…!")
33
How to choose first line treatment
Prognostic profile (Motzer/Heng) Toxicity profile and comorbidities Disease characteristics (site/sympthoms) Sequential strategies Oral/iv administration Physician experience Patient preference Biomarkers in development…!
 Toxicity profile and comorbidities. Disease characteristics (site/sympthoms) Sequential strategies. Oral/iv administration. Physician experience. Patient preference. Biomarkers in development…!")
34
How to choose first line treatment
Prognostic profile (Motzer/Heng) Toxicity profile and comorbidities Disease characteristics (site/sympthoms) Sequential strategies Oral/iv administration Physician experience Patient preference Biomarkers in development…!
 Toxicity profile and comorbidities. Disease characteristics (site/sympthoms) Sequential strategies. Oral/iv administration. Physician experience. Patient preference. Biomarkers in development…!")
35
How to choose first line treatment
Prognostic profile (Motzer/Heng) Toxicity profile and comorbidities Disease characteristics (site/sympthoms) Sequential strategies Oral/iv administration Physician experience Patient preference Biomarkers in development…!
 Toxicity profile and comorbidities. Disease characteristics (site/sympthoms) Sequential strategies. Oral/iv administration. Physician experience. Patient preference. Biomarkers in development…!")
36
How to choose first line treatment
Prognostic profile (Motzer/Heng) Toxicity profile and comorbidities Disease characteristics (site/sympthoms) Sequential strategies Oral/iv administration Physician experience Patient preference Biomarkers in development…!
 Toxicity profile and comorbidities. Disease characteristics (site/sympthoms) Sequential strategies. Oral/iv administration. Physician experience. Patient preference. Biomarkers in development…!")
38
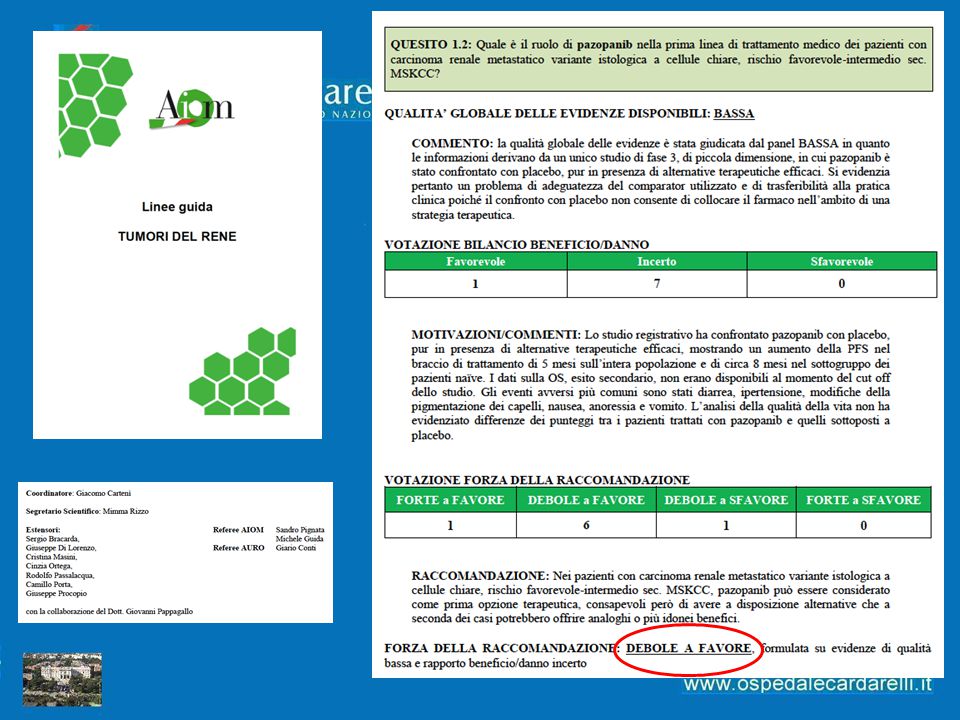
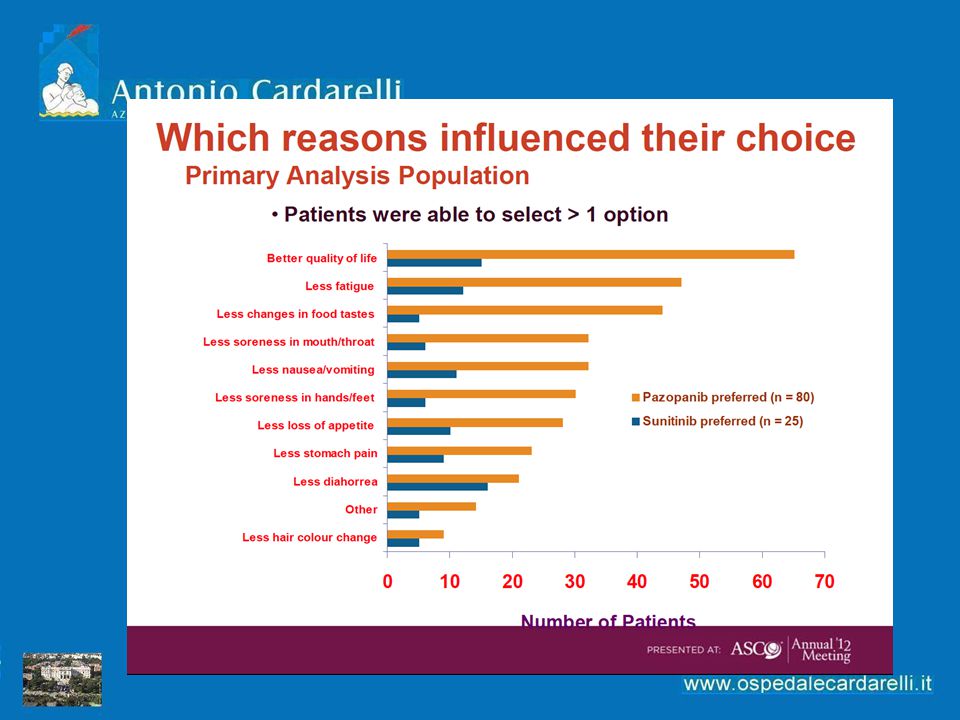
Significantly more patients preferred pazopanib over sunitinib (primary endpoint)1
70% (n=80) 22% (n=25) 8% (n=9) Escudier B, et al. J Clin Oncol 2012;30 suppl: abstr CRA4502.
 22% (n=25) 8% (n=9) Escudier B, et al. J Clin Oncol 2012;30 suppl: abstr CRA4502.")
40
Quali criteri vengono utilizzati per scegliere il farmaco da utilizzare in prima linea ?
Come monitorizzare la terapia ? Criteri di successo/insuccesso La gestione delle complicanze/effetti collaterali Trattamento delle metastasi ossee Associazione di farmaci ? terapie sequenziali ?

41
Necessario fare riferimento a criteri:
Valutazione dello stato di malattia in corso di trattamento con targeted therapies Necessario fare riferimento a criteri: Diagnostica strumentale Clinici Laboratorio

42
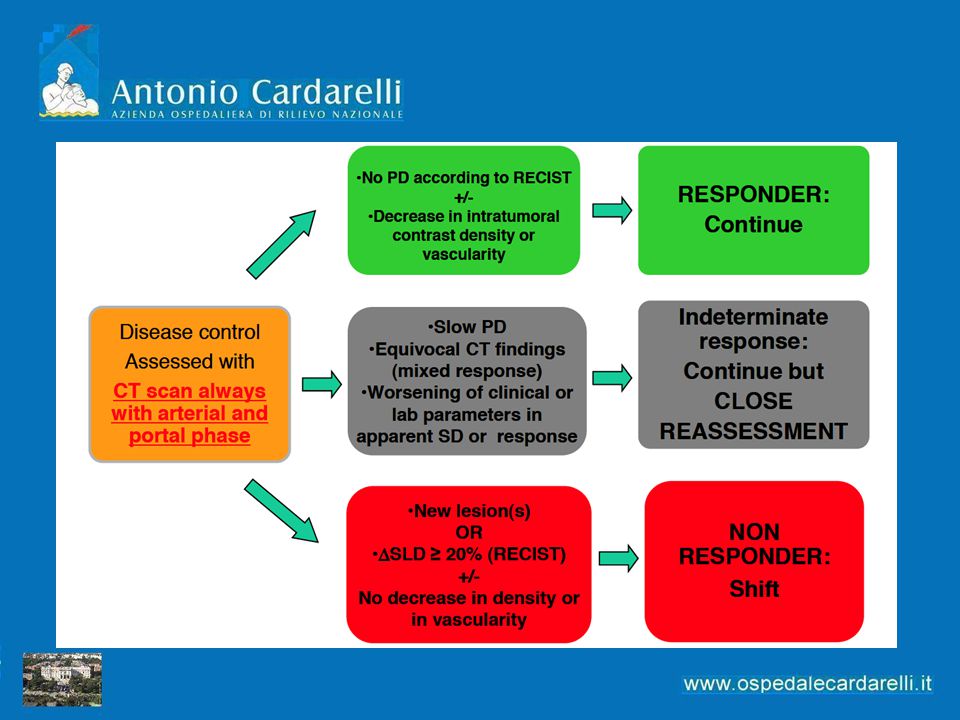
Criteri di risposta (RECIST) - Criticità
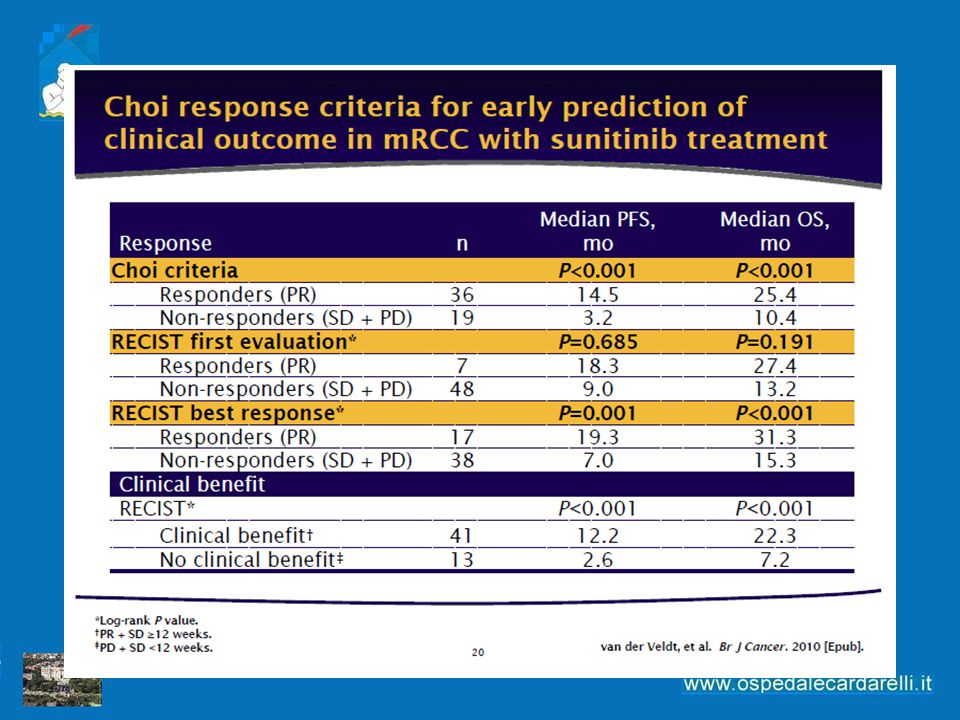
I criteri RECIST rappresentano lo standard di valutazione di risposta al trattamento in studi clinici su farmaci antitumorali1 La risposta parziale è definita come tumor shrinkage pari al 30% Un tumor shrinkage del < 30% è un risultato positivo per il paziente. Il controllo del tumore potrebbe essere un endpoint clinicamente più rilevante2 Potrebbe non essere appropriato per valutare la risposta alle targeted therapies (differente meccanismo d’azione) Le targeted therapies possono determinare necrosi tumorale piuttosto che tumor shrinkage3 Si basa sulle risposte agli agenti antitumorali citotossici Non si misurano le necrosi tumorali 1. Therasse P, et al. J Natl Cancer Inst 2000; 92:205–16 2. Nygren P, et al Acta Oncologia 2008; 47:316–29 3. Abou-Alfa G, et al. J Clin Oncol 2006;24:4293–300
 Le targeted therapies possono determinare necrosi tumorale piuttosto che tumor shrinkage3. Si basa sulle risposte agli agenti antitumorali citotossici. Non si misurano le necrosi tumorali. 1. Therasse P, et al. J Natl Cancer Inst 2000; 92:205– Nygren P, et al Acta Oncologia 2008; 47:316–29 3. Abou-Alfa G, et al. J Clin Oncol 2006;24:4293–300.")
43
Revisione criteri di risposta (RECIST v. 1.1)
Principali modifiche proposte: Numero delle lesioni valutabili; Dimensioni dei linfonodi patologici; Conferma della risposta; Supporto FDG-PET per valutare le progressioni.

44
I criteri RECIST e la loro più recente revisione non tengono conto di:
Come valutare la risposta al trattamento nell’era delle targeted therapies? I criteri RECIST e la loro più recente revisione non tengono conto di: Tecniche di imaging funzionale come la PET o la RMN Valutazione anatomica volumetrica del tumore Necessità di nuove metodiche di immagine atte a studiare la vascolarizzazione e la necrosi tumorale MRI DCE-US = dynamic contrast enhanced-ultrasonography FDG-PET DCE-US DCE-MRI

45
Imaging funzionale con DCE-US Valutazione della risposta a sorafenib
Abdominal lymph node from an RCC in a 37 year-old woman (good responder) treated with sorafenib DCE-US before treatment shows contrast uptake throughout the tumour estimated at 81% Lamuraglia et al. “In the group of good responders, mean contrast uptake was 92% before treatment and decreased to 60% at 3 weeks. The mean volume was 115 cm3 before treatment, 107 cm3 at 3 weeks and 104 cm3 at 6 weeks for the good responders”. DCE-US after 3 weeks of treatment shows contrast uptake throughout the tumour estimated at 48% DCE-US after 6 weeks of treatment shows contrast uptake throughout the tumour estimated at 31% Lamuraglia et al.EJC 2006
 treated with sorafenib. DCE-US. before treatment shows contrast uptake throughout the tumour estimated at 81% Lamuraglia et al. In the group of good responders, mean contrast uptake was 92% before treatment and decreased to 60% at 3 weeks. The mean volume was 115 cm3 before treatment, 107 cm3 at 3 weeks and 104 cm3 at 6 weeks for the good responders . DCE-US after 3 weeks of treatment. shows contrast uptake throughout the tumour estimated at 48% DCE-US after 6 weeks of treatment shows contrast uptake. throughout the tumour estimated at 31% Lamuraglia et al.EJC")
47
identifying patients with progression-free survival of >250 days
sensitivity specificity MASS criteria 86% 100% SACT criteria 75% OBJECTIVE: The objective of our study was to evaluate response assessment and predict clinical outcome in patients with metastatic renal cell carcinoma (RCC) receiving antiangiogenic targeted therapy. Target lesions were assessed on routine contrast-enhanced CT (CECT) images obtained during the portal venous phase using new response criteria. MATERIALS AND METHODS: Standard CECT examinations of patients with metastatic clear cell RCC on first-line sunitinib or sorafenib therapy (n = 84) were retrospectively evaluated using Mass, Attenuation, Size, and Structure (MASS) Criteria; Response Evaluation Criteria in Solid Tumors (RECIST); Size and Attenuation CT (SACT) Criteria; and modified Choi Criteria. The objective response to therapy was compared with clinical outcomes including time to progression (TTP) and disease-specific survival. The Kaplan-Meier method was used to estimate survival functions. RESULTS: A favorable response according to MASS Criteria had a sensitivity of 86% and specificity of 100% in identifying patients with a good clinical outcome (i.e., progression-free survival of > 250 days) versus 17% and 100%, respectively, for RECIST partial response. The objective categories of response used by MASS Criteria-favorable response, indeterminate response, and unfavorable response-differed significantly from one another with respect to TTP (p < , log-rank test) and disease-specific survival (p < , log-rank test). CONCLUSION: Assessment of metastatic RCC target lesions on CECT for changes in morphology, attenuation, size, and structure by MASS Criteria is more accurate than response assessment by SACT Criteria, RECIST, or modified Choi Criteria. Furthermore, the use of MASS Criteria for imaging response assessment showed high interobserver agreement and may predict disease outcome in patients with metastatic RCC on targeted therapy Smith AD, Shah SN, Rini BI, Lieber ML, Remer EM. Morphology, Attenuation, Size, and Structure (MASS) criteria: assessing response and predicting clinical outcome in metastatic renal cell carcinoma on antiangiogenic targeted therapy. AJR Am J Roentgenol Jun;194(6):1470-8
 receiving antiangiogenic targeted therapy. Target lesions were assessed on routine contrast-enhanced CT (CECT) images obtained during the portal venous phase using new response criteria. MATERIALS AND METHODS: Standard CECT examinations of patients with metastatic clear cell RCC on first-line sunitinib or sorafenib therapy (n = 84) were retrospectively evaluated using Mass, Attenuation, Size, and Structure (MASS) Criteria; Response Evaluation Criteria in Solid Tumors (RECIST); Size and Attenuation CT (SACT) Criteria; and modified Choi Criteria. The objective response to therapy was compared with clinical outcomes including time to progression (TTP) and disease-specific survival. The Kaplan-Meier method was used to estimate survival functions. RESULTS: A favorable response according to MASS Criteria had a sensitivity of 86% and specificity of 100% in identifying patients with a good clinical outcome (i.e., progression-free survival of > 250 days) versus 17% and 100%, respectively, for RECIST partial response. The objective categories of response used by MASS Criteria-favorable response, indeterminate response, and unfavorable response-differed significantly from one another with respect to TTP (p < , log-rank test) and disease-specific survival (p < , log-rank test). CONCLUSION: Assessment of metastatic RCC target lesions on CECT for changes in morphology, attenuation, size, and structure by MASS Criteria is more accurate than response assessment by SACT Criteria, RECIST, or modified Choi Criteria. Furthermore, the use of MASS Criteria for imaging response assessment showed high interobserver agreement and may predict disease outcome in patients with metastatic RCC on targeted therapy. Smith AD, Shah SN, Rini BI, Lieber ML, Remer EM. Morphology, Attenuation, Size, and Structure (MASS) criteria: assessing response and. predicting clinical outcome in metastatic renal cell carcinoma on antiangiogenic targeted therapy. AJR Am J Roentgenol Jun;194(6):")
48
Necessario fare riferimento a criteri:
Valutazione dello stato di malattia in corso di trattamento con targeted therapies Necessario fare riferimento a criteri: Diagnostica strumentale Clinici Laboratorio

49
Criteri clinici Esame obiettivo Performance status
Sintomi tumore-correlati Perdita di peso Consumo di analgesici Qualità di vita del paziente

50
Criteri di laboratorio
Emocromo completo Funzionalità epatica Funzionalità renale LDH Calcemia Tossicità o progressione di malattia?

51
Quando finisce una prima linea di trattamento ?

52
In assenza di una sicura progressione obiettiva, i criteri clinici che depongono per un beneficio per il paziente, devono sempre orientare verso la prosecuzione del trattamento con l’agente target in corso E viceversa….

53
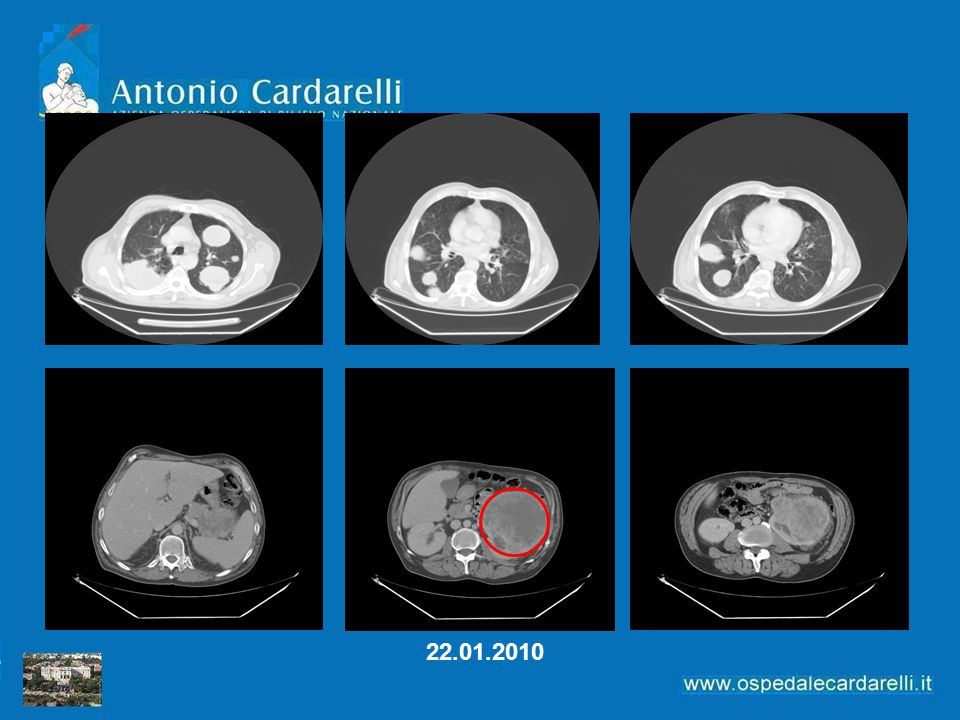
Case Study Sintomi all’esordio Ematuria Anemia Dolori addominali
Calo ponderale Astenia Dispnea Il paziente viene trasportato a braccia alla visita

54
Emoglobina: 9.0 gr/dl LDH 920 PS: sec Karnofsky 70% Pluri-metastatico

56
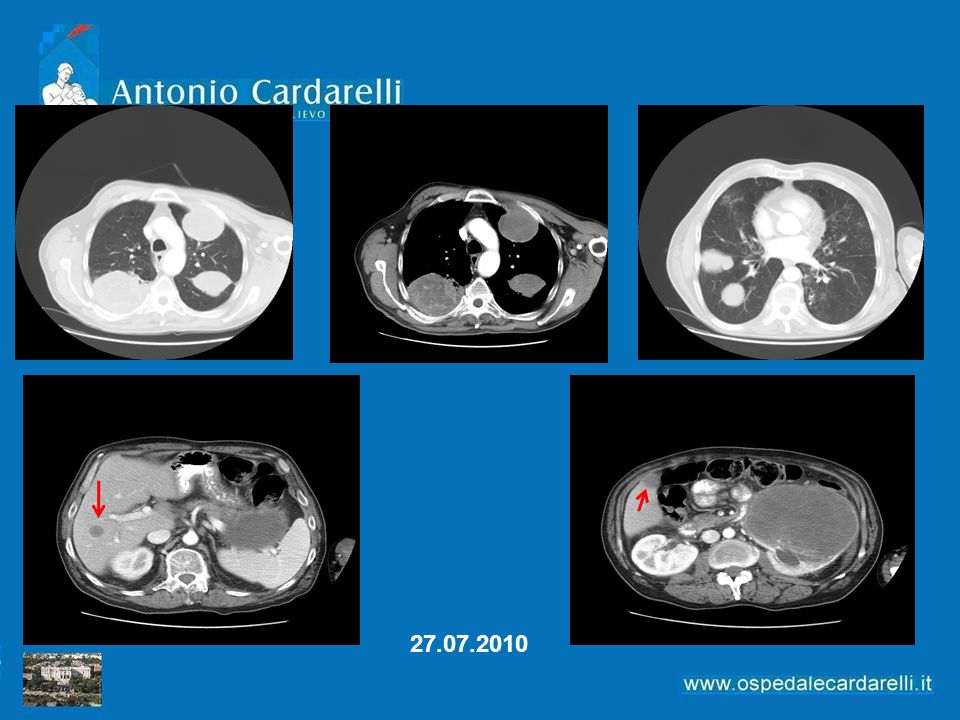
Maggio 2010 Praticati due cicli di Sutent Netto miglioramento delle condizioni cliniche Molto ridotto il dolore addominale Astenia quasi assente Hgb 11 g/dl Calcemia 8.6 mg/dl LDH 650 Karnofsky 80%

59
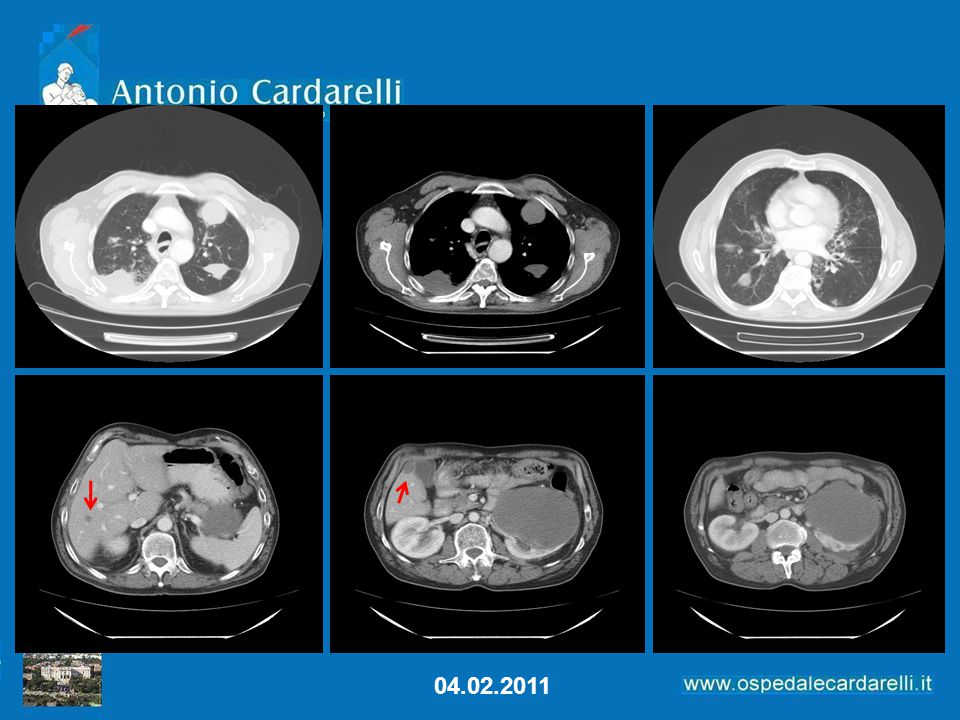
Inizia la riduzione

62
Quali criteri vengono utilizzati per scegliere il farmaco da utilizzare in prima linea ?
Come monitorizzare la terapia ? Criteri di successo/insuccesso La gestione delle complicanze/effetti collaterali Trattamento delle metastasi ossee Associazione di farmaci ? terapie sequenziali ?

63
ccRCC Predictive markers of target therapy
Bio-Clinical Hypertension (>90 mm/hg DBP) LDH Hypothiroidism (increased TSH)
 LDH. Hypothiroidism (increased TSH)")
64
Hypertension Biomarker of Efficacy with Sunitinib
In (A) HTN is defined by a maximum systolic blood pressure of at least 140 mm Hg. In (B), HTN is defined by a maximum diastolic blood pressure of at least 90 mm Hg. In this retrospective exploratory analysis of HTN as a biomarker of efficacy in more than 500 patients with metastatic renal cell carcinoma treated with sunitinib, which to our knowledge may be the largest such investigation to date, sunitinib treatment–induced HTN was associated with statistically significantly improved clinical outcome. These findings support the hypothesis that HTN may be a viable biomarker of antitumor efficacy in this patient population, although development of HTN during sunitinib treatment was neither necessary nor sufficient for clinical benefit in all patients. Median PFS and OS were more than fourfold longer for patients with HTN than for patients without HTN as defined by a maximum SBP of at least 140 mm Hg. In addition, ORR was more than six times greater in patients with HTN than in patients without HTN. Moreover, a Cox proportional hazards model, with the onset of HTN as a time-dependent covariate, demonstrated a statistically significant decrease in the relative risk of both disease progression and death in patients who developed HTN, as defined by maximum SBP (and in the relative risk of death but not disease progression, with HTN defined by maximum DBP). Importantly, landmark analyses of HTN onset by the end of the first or second treatment cycle were also associated with improved clinical outcome. These data, combined with a multivariable analysis of baseline prognostic factors that showed that HTN (particularly systolic-defined HTN) was a statistically significant predictor of clinical outcome, provide further support to the growing body of evidence that VEGF pathway inhibitors are associated with treatment-induced HTN, which, in turn, may be a correlative biomarker of antitumor efficacy. When we looked for an association of median OS with HTN status and defined HTN as a mean (instead of maximum) SBP of at least 140 mm Hg or a mean DBP of at least 90 mm Hg, we observed similar results, although to a lesser extent (data not shown). However, we observed no difference in median PFS when HTN status was defined by mean BP thresholds. B Rini, J Natl Cancer Inst 2011; 103:
 HTN is defined by a maximum systolic blood pressure of at least 140 mm Hg. In (B), HTN is defined by a maximum diastolic blood pressure of at least 90 mm Hg. In this retrospective exploratory analysis of HTN as a biomarker of efficacy in more than 500 patients with metastatic renal cell carcinoma treated with sunitinib, which to our knowledge may be the largest such investigation to date, sunitinib treatment–induced HTN was associated with statistically significantly improved clinical outcome. These findings support the hypothesis that HTN may be a viable biomarker of antitumor efficacy in this patient population, although development of HTN during sunitinib treatment was neither necessary nor sufficient for clinical benefit in all patients. Median PFS and OS were more than fourfold longer for patients with HTN than for patients without HTN as defined by a maximum SBP of at least 140 mm Hg. In addition, ORR was more than six times greater in patients with HTN than in patients without HTN. Moreover, a Cox proportional hazards model, with the onset of HTN as a time-dependent covariate, demonstrated a statistically significant decrease in the relative risk of both disease progression and death in patients who developed HTN, as defined by maximum SBP (and in the relative risk of death but not disease progression, with HTN defined by maximum DBP). Importantly, landmark analyses of HTN onset by the end of the first or second treatment cycle were also associated with improved clinical outcome. These data, combined with a multivariable analysis of baseline prognostic factors that showed that HTN (particularly systolic-defined HTN) was a statistically significant predictor of clinical outcome, provide further support to the growing body of evidence that VEGF pathway inhibitors are associated with treatment-induced HTN, which, in turn, may be a correlative biomarker of antitumor efficacy. When we looked for an association of median OS with HTN status and defined HTN as a mean (instead of maximum) SBP of at least 140 mm Hg or a mean DBP of at least 90 mm Hg, we observed similar results, although to a lesser extent (data not shown). However, we observed no difference in median PFS when HTN status was defined by mean BP thresholds. B Rini, J Natl Cancer Inst 2011; 103:")
65
Diastolic blood pressure Biomarker of efficacy with axitinib in solid tumors
OS with landmark at 8 weeks. B Rini, Clin Cancer Res; 17(11); 3841–9.2011
; 3841–")
66
Serum LDH Biomarker with Temsirolimus
The median OS for patients treated with temsirolimus was 10.6 months (95% CI, 8.5 to 12.1 months) versus 7.1 months (95% CI, 5.9 to 8.8 months) for IFN-. Nel secondo grafico: LDH remained statistically significant and prognostic for OS with an adjusted HR for death of 2.81 (95% CI, 2.01 to 3.94; P.001) for OS for patients with LDHmore than 1ULNversus1ULN. The unadjustedHRfor death forLDHmore than 1ULNversus1ULNwas 1.95 (95% CI, 1.54 to 2.47; P .001). Furthermore, the unadjusted HRs were 2.45 (95% CI, 1.76 to 3.41; P.001) and 1.55 (95% CI, 1.10 to 2.20; P .013) for patients treated with IFN and patients treated with mTOR, respectively. The interaction of treatment with LDH ( 1 ULN) was statistically significant (HR, 0.55; 95% CI, 0.34 to 0.90; P.016; Table 2 and Fig 4). In the group of patients with lowLDHat baseline (1ULN),OSwas not clearly improved. TheHRwas 0.90 (95% CI, 0.67 to 1.22; P .51), with median survival time of 11.7 months (95% CI, 9.9 to 14.2 months) for patients treated with temsirolimus compared with 10.4 months (95% CI, 7.4 to 13.5 months) for patients treated with IFN- Andrew J Armstrong et al, J Clin Oncol 30: 66
 versus 7.1 months (95% CI, 5.9 to 8.8 months) for IFN-. Nel secondo grafico: LDH remained. statistically significant and prognostic for OS with an adjusted HR for. death of 2.81 (95% CI, 2.01 to 3.94; P.001) for OS for patients with. LDHmore than 1ULNversus1ULN. The unadjustedHRfor. death forLDHmore than 1ULNversus1ULNwas 1.95 (95% CI, 1.54 to 2.47; P .001). Furthermore, the unadjusted HRs were (95% CI, 1.76 to 3.41; P.001) and 1.55 (95% CI, 1.10 to 2.20; P .013) for patients treated with IFN and patients treated with. mTOR, respectively. The interaction of treatment with LDH ( 1. ULN) was statistically significant (HR, 0.55; 95% CI, 0.34 to 0.90; P.016; Table 2 and Fig 4). In the group of patients with lowLDHat. baseline (1ULN),OSwas not clearly improved. TheHRwas (95% CI, 0.67 to 1.22; P .51), with median survival time of months (95% CI, 9.9 to 14.2 months) for patients treated with temsirolimus. compared with 10.4 months (95% CI, 7.4 to 13.5 months) for patients treated with IFN- Andrew J Armstrong et al, J Clin Oncol 30:")
67
Hypothyroidism (increased TSH) Biomarker of activity with TKI in solid tumors
Eleven patients who were receiving sunitinib and 5 patients who were receiving sorafenib achieved either complete remission (n ¼ 3) or partial remission (n ¼ 8), for an ORR of 19.3%. Fifteen of those 16 patients were diagnosed with (subclinical) hypothyroidism during sunitinib or sorafenib treatment. There was a statistically significant correlation between the occurrence of hypothyroidism and the achievement of remission (ORR: hypothyroid patients, 28.3%; euthyroid patients, 3.3%; P < .001). Objective Remission According to Response Evaluation Criteria in Solid Tumors Based on Increased Thyroid-Stimulating Hormone Levels Schmidinger M, Cancer 2011
 or partial remission (n ¼ 8), for an ORR of 19.3%. Fifteen of those 16 patients were diagnosed with (subclinical) hypothyroidism during sunitinib or sorafenib treatment. There was a statistically significant correlation between the occurrence of hypothyroidism and the achievement of. remission (ORR: hypothyroid patients, 28.3%; euthyroid patients, 3.3%; P < .001). Objective Remission According to Response Evaluation Criteria in Solid Tumors Based on Increased Thyroid-Stimulating Hormone Levels. Schmidinger M, Cancer")
68
Implicazioni cliniche
Trattiamo FINO alla tossicità ? Trattiamo LA tossicità ? Ruolo dei farmaci per la tossicità ?

69
Take home messages Metodi di valutazione e misure profilattiche verso gli effetti collaterali possono confondere questi risultati Gran parte dei risultati derivano da studi retrospettivi (validazione in studi prospettici) I ‘potenziali benefici’ derivanti dalla somministrazione contemporanea di medicinali devono essere considerati Nessuno di questi marcatori ideale: il marcatore ideale predittivo valutabile prima del trattamento, piuttosto che durante il trattamento
 I ‘potenziali benefici’ derivanti dalla somministrazione contemporanea di medicinali devono essere considerati. Nessuno di questi marcatori ideale: il marcatore ideale predittivo valutabile prima del trattamento, piuttosto che durante il trattamento.")
70
Quali criteri vengono utilizzati per scegliere il farmaco da utilizzare in prima linea ?
Come monitorizzare la terapia ? Criteri di successo/insuccesso La gestione delle complicanze/effetti collaterali Trattamento delle metastasi ossee Associazione di farmaci ? terapie sequenziali ?

71
Key Factors for Successful Therapy Management in mRCC
Dosing Side-effect Management Optimum Efficacy Treatment Duration Therapy management Specific clinical management strategies have emerged as being essential for the optimal use of targeted agents for mRCC1–3 Therapy management describes the implementation of these strategies, which focus on three key interlinked areas:1–3 Dosing Treatment duration Proactive side effect management References 1. Hutson TE, et al. Oncologist 2008 2. Négrier S, Ravaud A. Eur J Cancer Suppl 2007 3. Bhojani N, et al. Eur Urol 2008 Schedule 71

72
Quali criteri vengono utilizzati per scegliere il farmaco da utilizzare in prima linea ?
Come monitorizzare la terapia ? Criteri di successo/insuccesso La gestione delle complicanze/effetti collaterali Trattamento delle metastasi ossee Associazione di farmaci ? terapie sequenziali ?

73
Zoledronic acid significantly extended (A) the time to first skeletal
Epidemiologia Il 30% dei pazienti con carcinoma renale presenta metastasi alla diagnosi, il 20% delle quali interessa l’osso. Patogenesi Trattasi prevalentemente di lesioni osteolitiche, con rischio elevato di complicanze scheletriche come fratture patologiche e compressione midollare. Il tumore renale produce l’ormone simil paratiroideo (PTHrP), il paziente frequentemente manifesta ipercalcemia. Zoledronic acid significantly extended (A) the time to first skeletal complication compared with placebo and (B) the time to first pathologic fracture compared with placebo Rosen et al. Cancer 2004; 100:
, il paziente frequentemente manifesta ipercalcemia. Zoledronic acid significantly extended (A) the time to first skeletal. complication compared with placebo and (B) the time to first pathologic fracture compared with placebo. Rosen et al. Cancer 2004; 100:")
74
time to First On-Study SRE: 424 days vs 72 days (p=0.007)
mRCC patients: 74 total reduction of skeletal complications: 74% (ZA) vs 37% (placebo) (p=0.015) absolute reduction: 37% time to First On-Study SRE: 424 days vs 72 days (p=0.007) Conclusioni L’evidenza di efficacia dei bisfosfonati nel trattamento delle metastasi ossee da carcinoma renale è limitata ad una analisi per sottogruppi nell’ambito di un unico studio clinico randomizzato. L’acido zoledronico può essere impiegato per prevenire l’insorgenza di complicanze scheletriche nei pazienti con metastasi ossee da carcinoma renale. Rosen et al. Cancer 2004; 100:
 vs 37% (placebo) (p=0.015) absolute reduction: 37% time to First On-Study SRE: 424 days vs 72 days (p=0.007) Conclusioni. L’evidenza di efficacia dei bisfosfonati nel trattamento delle metastasi ossee da carcinoma renale è limitata ad una analisi per sottogruppi nell’ambito di. un unico studio clinico randomizzato. L’acido zoledronico può essere impiegato per prevenire l’insorgenza di complicanze scheletriche nei pazienti con metastasi ossee da carcinoma renale. Rosen et al. Cancer 2004; 100:")
75
Placebo IV* every 4 weeks Zoledronic acid 4 mg IV* and
Three Identical International, Randomized, Double-Blind, Active-Controlled Trials Key Inclusion Criteria Adults with breast, prostate, other solid tumors, or multiple myeloma and ≥1 bone metastasis Key Exclusion Criteria current or prior IV bisphosphonate administration creatinine clearance <30 mL/min Denosumab 120 mg SC and Placebo IV* every 4 weeks (n=2862) R A N D O M I Z A T I O N E N D O F S T U Y Zoledronic acid 4 mg IV* and Placebo SC every 4 weeks (n=2861) Key points: This is an integrated analysis of three identical randomized, double-blind, active-controlled trials that included patients with advanced cancer or multiple myeloma. ONJ-Specific Exclusion Criteria: Prior history or current evidence of ONJ or osteomyelitis of the jaw Active dental or jaw condition requiring surgery Planned invasive dental procedures over the course of study Non-healed oral or dental surgery References: Lipton A, Fizazi K, Stopeck A, et al. Superiority of denosumab to zoledronic acid for prevention of skeletal-related events: a combined analysis of 3 pivotal, randomized, phase 3 trials. Eur J Cancer 2012; Recommended: Daily supplementation with calcium (≥500 mg) and vitamin D (≥400 U) Primary Endpoint: Time to first on-study skeletal-related event (SRE) (Non-inferiority) Lipton A, Fizazi K, Stopeck A, et al. Eur J Cancer 2012 75
 R A N D O M I Z. A. T. I. O. N. E. N. D. O. F. S. T. U. Y. Zoledronic acid 4 mg IV* and. Placebo SC every 4 weeks. (n=2861) Key points: This is an integrated analysis of three identical randomized, double-blind, active-controlled trials that included patients with advanced cancer or multiple myeloma. ONJ-Specific Exclusion Criteria: Prior history or current evidence of ONJ or osteomyelitis of the jaw. Active dental or jaw condition requiring surgery. Planned invasive dental procedures over the course of study. Non-healed oral or dental surgery. References: Lipton A, Fizazi K, Stopeck A, et al. Superiority of denosumab to zoledronic acid for prevention of skeletal-related events: a combined analysis of 3 pivotal, randomized, phase 3 trials. Eur J Cancer 2012; Recommended: Daily supplementation with calcium (≥500 mg) and vitamin D (≥400 U) Primary Endpoint: Time to first on-study skeletal-related event (SRE) (Non-inferiority) Lipton A, Fizazi K, Stopeck A, et al. Eur J Cancer")
76
Baseline Characteristics
Characteristics, n (%) or Median (Q1, Q3) Denosumab (n=2862) Zoledronic Acid (n=2861) Tumor type† Breast 1026 (36) 1020 (36) Prostate 950 (33) 951 (33) Non-small cell lung 350 (12) 352 (12) Multiple myeloma 87 (3) 93 (3) Renal 70 (2) 85 (3) Small cell lung 61 (2) 48 (2) Bladder 28 (1) 35 (1) Rectal 25 (1) Colon 30 (1) 29 (1) Other§ 449 (16) 445 (16) Reference: Lipton A, Fizazi K, Stopeck A, et al. Superiority of Denosumab to Zoledronic Acid for Prevention of Skeletal-related Events: A Combined Analysis of 3 Pivotal, Randomized, Phase 3 Trials Eur J Cancer 2012 [accepted]. Lipton A, Fizazi K, Stopeck A, et al. Eur J Cancer 2012 76
 or Median (Q1, Q3) Denosumab. (n=2862) Zoledronic Acid. (n=2861) Tumor type† Breast (36) 1020 (36) Prostate. 950 (33) 951 (33) Non-small cell lung. 350 (12) 352 (12) Multiple myeloma. 87 (3) 93 (3) Renal. 70 (2) 85 (3) Small cell lung. 61 (2) 48 (2) Bladder. 28 (1) 35 (1) Rectal. 25 (1) Colon. 30 (1) 29 (1) Other§ 449 (16) 445 (16) Reference: Lipton A, Fizazi K, Stopeck A, et al. Superiority of Denosumab to Zoledronic Acid for Prevention of Skeletal-related Events: A Combined Analysis of 3 Pivotal, Randomized, Phase 3 Trials Eur J Cancer 2012 [accepted]. Lipton A, Fizazi K, Stopeck A, et al. Eur J Cancer")
77
Primary Endpoint: Time to First On-Study SRE
17% 1.0 0.8 0.6 0.4 0.2 HR 0.83 (95% CI: 0.76, 0.90) P<0.001 (Superiority) Risk Reduction Proportion without SRE KM Estimate of Median Months Denosumab 27.66 Zoledronic Acid 19.45 Key points: This is an integrated analysis of three identical randomized, double-blind, active-controlled trials that included patients with advanced cancer or multiple myeloma. Denosumab was superior to zoledronic acid in delaying the time to first on-study SRE [HR 0.83 (95% CI: 0.76, 0.90); P<0.001 (Superiority)], a 17% risk reduction. The KM estimate of the median time to first on-study SRE was 19.4 months for the zoledronic acid group and 27.7 months for the denosumab-treated group. References: Lipton A, Fizazi K, Stopeck A, et al. Superiority of denosumab to zoledronic acid for prevention of skeletal-related events: a combined analysis of 3 pivotal, randomized, phase 3 trials. Eur J Cancer 2012; Month Patients at Risk: Denosumab Zoledronic Acid Lipton A, Fizazi K, Stopeck A, et al. Eur J Cancer 2012 77
 P<0.001 (Superiority) Risk Reduction. Proportion without SRE. KM Estimate of Median Months. Denosumab Zoledronic Acid Key points: This is an integrated analysis of three identical randomized, double-blind, active-controlled trials that included patients with advanced cancer or multiple myeloma. Denosumab was superior to zoledronic acid in delaying the time to first on-study SRE [HR 0.83 (95% CI: 0.76, 0.90); P<0.001 (Superiority)], a 17% risk reduction. The KM estimate of the median time to first on-study SRE was 19.4 months for the zoledronic acid group and 27.7 months for the denosumab-treated group. References: Lipton A, Fizazi K, Stopeck A, et al. Superiority of denosumab to zoledronic acid for prevention of skeletal-related events: a combined analysis of 3 pivotal, randomized, phase 3 trials. Eur J Cancer 2012; Month. Patients at Risk: Denosumab Zoledronic Acid Lipton A, Fizazi K, Stopeck A, et al. Eur J Cancer")
78
Time to First and Subsequent On-Study SRE
18% 2.0 1.5 1.0 0.5 HR 0.82 (95% CI: 0.75, 0.89) P<0.001 (Superiority) Risk Reduction Total Number of Events Denosumab 1360 Zoledronic Acid 1628 Cumulative Mean Number of SRE Key points: This is an integrated analysis of three identical randomized, double-blind, active-controlled trials that included patients with advanced cancer or multiple myeloma. Denosumab was superior to zoledronic acid in delaying the time to first and subsequent on-study SRE [HR 0.82 (95% CI: 0.75, 0.89); P<0.001 (Superiority)], a 18% risk reduction. The total number of events recorded in the zoledronic acid group was 1628, compared to 1360 in the denosumab-treated group. References: Lipton A, Fizazi K, Stopeck A, et al. Superiority of denosumab to zoledronic acid for prevention of skeletal-related events: a combined analysis of 3 pivotal, randomized, phase 3 trials. Eur J Cancer 2012; Month Lipton A, Fizazi K, Stopeck A, et al. Eur J Cancer 2012 78
 P<0.001 (Superiority) Risk Reduction. Total Number of Events. Denosumab Zoledronic Acid Cumulative Mean Number of SRE. Key points: This is an integrated analysis of three identical randomized, double-blind, active-controlled trials that included patients with advanced cancer or multiple myeloma. Denosumab was superior to zoledronic acid in delaying the time to first and subsequent on-study SRE [HR 0.82 (95% CI: 0.75, 0.89); P<0.001 (Superiority)], a 18% risk reduction. The total number of events recorded in the zoledronic acid group was 1628, compared to 1360 in the denosumab-treated group. References: Lipton A, Fizazi K, Stopeck A, et al. Superiority of denosumab to zoledronic acid for prevention of skeletal-related events: a combined analysis of 3 pivotal, randomized, phase 3 trials. Eur J Cancer 2012; Month. Lipton A, Fizazi K, Stopeck A, et al. Eur J Cancer")
79
Quali criteri vengono utilizzati per scegliere il farmaco da utilizzare in prima linea ?
Come monitorizzare la terapia ? Criteri di successo/insuccesso La gestione delle complicanze/effetti collaterali Trattamento delle metastasi ossee Associazione di farmaci ? terapie sequenziali ?

80
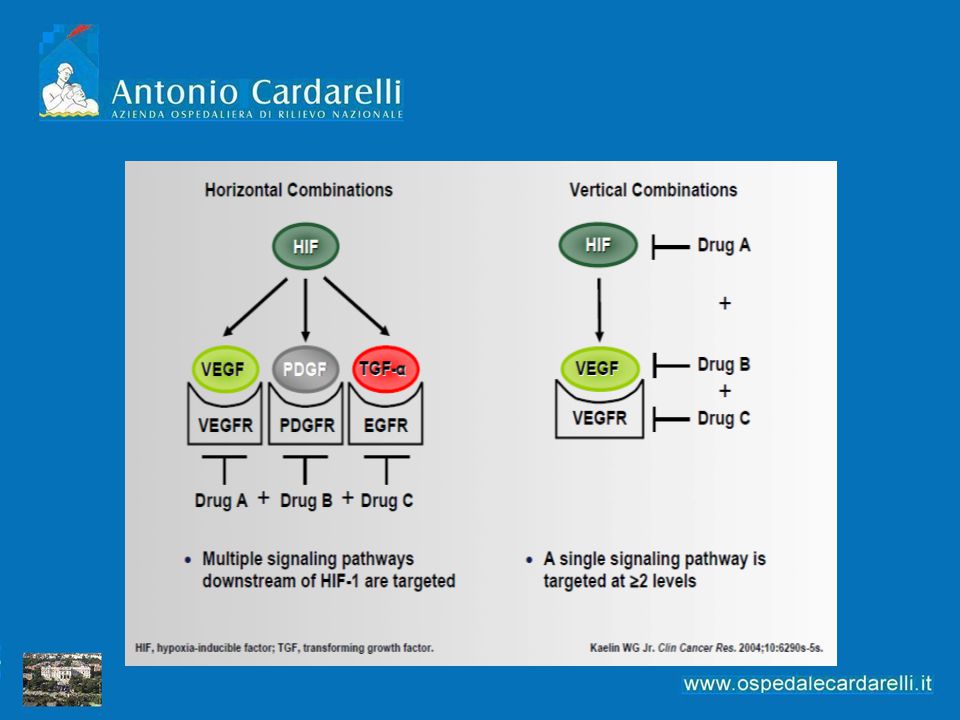
Combination or Sequential Therapy
Why Combine? Why Sequence? Mechanistically • “Vertically” block a pathway • “Horizontally” block multiple pathways Goals • increase response rates and prolong PFS Mechanistically • target resistant pathways upregulated by prior therapy Goals • maintain prolonged disease stability • decrease toxicity by diminishing drug interactions

82
Maior increases in response rate over monotherapy
What are we looking for ? Maior increases in response rate over monotherapy Ability to achieve a CR from therapy or in conjunction with metastasectomy Relative tolerability

83
Combination Therapy Antiangiogenic therapy combinations
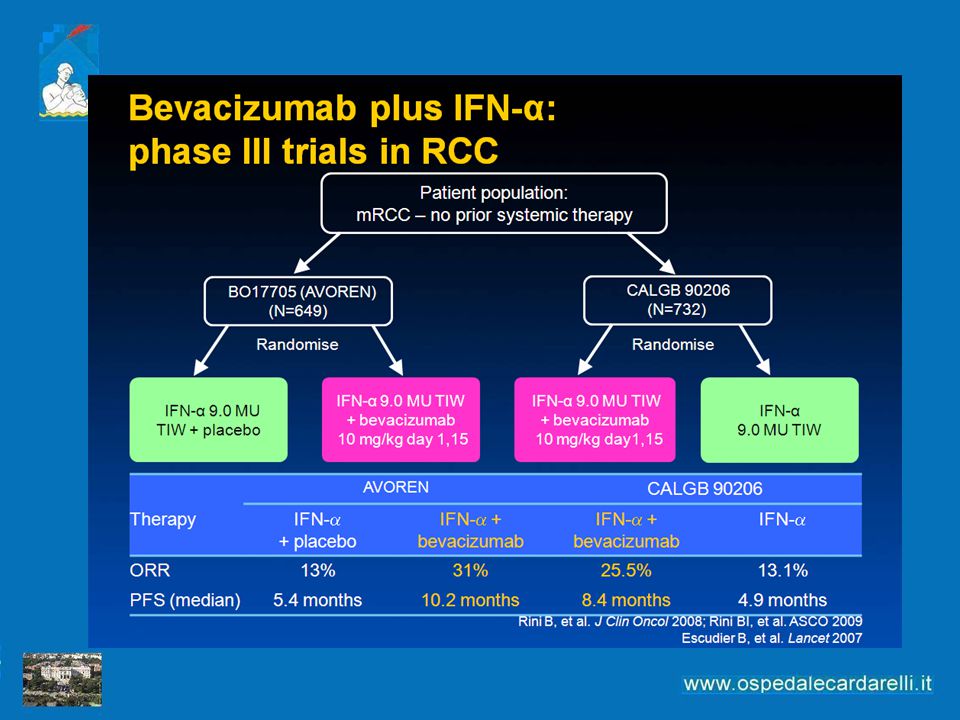
Sorafenib plus bevacizumab (Sosman et al. JCO 2006) Sorafenib and AMG 386 (Rini et al. JCO 2011) Sunitinib plus Bevacizumab (Feldman et al. JCO 2009) Antiangiogenic therapy-mTOR inhibitor combinations Sunitinib plus Temsirolimus (Patel et al. Clin Genitourinary Cancer 2009) Bevacizumab plus Temsirolimus (Merchan et al JCO 2007 abstract 5034; Escudier et al. JCO 2011 abstract 4516 ) Immunotherapy-Antiangiogenic therapy combinations Sunitinib+IFN (Motzer et al. Clin Genitourinary Cancer 2009) Sorafenib+ IFN (Jonasch et al. Cancer 2010) Bevacizumab+ IFN (Rini et al, JCO 2008)
 Sorafenib and AMG 386 (Rini et al. JCO 2011) Sunitinib plus Bevacizumab (Feldman et al. JCO 2009) Antiangiogenic therapy-mTOR inhibitor combinations. - Sunitinib plus Temsirolimus (Patel et al. Clin Genitourinary Cancer 2009) Bevacizumab plus Temsirolimus (Merchan et al JCO 2007 abstract 5034; Escudier et al. JCO 2011 abstract 4516 ) Immunotherapy-Antiangiogenic therapy combinations. Sunitinib+IFN (Motzer et al. Clin Genitourinary Cancer 2009) Sorafenib+ IFN (Jonasch et al. Cancer 2010) Bevacizumab+ IFN (Rini et al, JCO 2008)")
84
Combinations of Targeted Agents in mRCC: Sunitinib Combinations

85
Combinations of Targeted Agents in mRCC: Sorafenib Combinations

86
Combinations of Targeted Agents in mRCC: Bevacizumab Combinations

87
Sequenzial therapy: goals
Maximize efficacy and duration of first-line agent Minimize toxicity Choose both initial and subsequent therapy on the basis of robust predictive biomarkers

88
RECORD-1 vs AXIS: trial design discrepancies
RECORD-1 (everolimus) AXIS (axitinib) Accrual disease 12/ /2007 9/2008-7/2010 Comparator Placebo Sorafenib 2 or more prior therapies (TKI) 26% 0% MSKCC poor-risk 14% 33% Allowed TKI-intolerant patients Yes No Allowed crossover Allowed dose esclation Only prior sunitinib N=43, 13% of pts N=194, 26% of pts Attenzione ai confronti indiretti!
 AXIS. (axitinib) Accrual disease. 12/ / /2008-7/2010. Comparator. Placebo. Sorafenib. 2 or more prior therapies (TKI) 26% 0% MSKCC poor-risk. 14% 33% Allowed TKI-intolerant patients. Yes. No. Allowed crossover. Allowed dose esclation. Only prior sunitinib. N=43, 13% of pts. N=194, 26% of pts. Attenzione ai confronti indiretti!")
89
Presented By Thomas Powles, MD at 2013 ASCO Annual Meeting
[TITLE] Presented By Thomas Powles, MD at 2013 ASCO Annual Meeting

90
[TITLE]
![[TITLE]](http://slideplayer.it/slide/2799072/10/images/90/%5BTITLE%5D.jpg "[TITLE]")
91
[TITLE]
![[TITLE]](http://slideplayer.it/slide/2799072/10/images/91/%5BTITLE%5D.jpg "[TITLE]")
92
[TITLE]
![[TITLE]](http://slideplayer.it/slide/2799072/10/images/92/%5BTITLE%5D.jpg "[TITLE]")
93
[TITLE]
![[TITLE]](http://slideplayer.it/slide/2799072/10/images/93/%5BTITLE%5D.jpg "[TITLE]")
94
Ongoing clinical trials will solve all our doubts …
TKI mTOR Ongoing clinical trials will solve all our doubts …

Presentazioni simili