Scaricare la presentazione
La presentazione è in caricamento. Aspetta per favore

1
Attualità nell’impiego delle statine
Prof. P. Pauletto Dip. di Medicina Clinica e Sperimentale Università degli Studi di Padova U.O. di Medicina Interna I^ U.L.S.S. n° 9, Ospedale di Treviso

2
Risk Factors and Attributable Mortality Reduction
— which one stands out as best therapeutic target — Contribution from RF modification • Cholesterol (LDL/HDL) % • Blood pressure % • Cigarette smoking % Contribution comparators • Medical Rx of acute MI 21% • PCI or CABG %
 37% • Blood pressure 14% • Cigarette smoking 6% Contribution comparators. • Medical Rx of acute MI 21% • PCI or CABG 16%")
3
COLESTEROLO COME FATTORE DI RISCHIO PER LA CARDIOPATIA ISCHEMICA
35 30 Stati Uniti RA 200 = 11.5% RA 240 = 13.6% RR = 1,18 25 20 Tassi di mortalità per CHD (%) 15 Europa Meridionale RA 200 = 8.5% RA 240 = 10.1% RR = 1,18 10 5 RA = rischio assoluto RR = rischio relativo 2.60 (100) 3.25 (125) 3.90 (150) 4.50 (175) 5.15 (200) 5.80 (225) 6.45 (250) 7.10 (275) 7.75 (300) 8.40 (325) 9.05 (350) Il contributo del FR è lo stesso, ma si parte da livelli basali diversi Colesterolemia totale, mmol/L (mg/dL) Dati dallo studio Seven Countries su 12,467 uomini dell’Europa, USA e Giappone. Verschuren WM et al. JAMA 1995;274:131–136. Correlazione tra CT e mortalità da CHD in uno studio di 25 anni su uomini, abitanti in cinque paesi europei, negli USA e in Giappone (da Verschuren et al 1995).
 15. Europa Meridionale. RA 200 = 8.5% RA 240 = 10.1% RR = 1, RA = rischio assoluto. RR = rischio relativo (100) (125) (150) (175) (200) (225) (250) (275) (300) (325) (350) Il contributo del FR. è lo stesso, ma si. parte da livelli. basali diversi. Colesterolemia totale, mmol/L (mg/dL) Dati dallo studio Seven Countries su 12,467 uomini dell’Europa, USA e Giappone. Verschuren WM et al. JAMA 1995;274:131–136. Correlazione tra CT e mortalità da CHD in uno studio di 25 anni su uomini, abitanti in cinque paesi europei, negli USA e in Giappone (da Verschuren et al 1995).")
4
Le Linee Guida

5
Relationship Between LDL-C Levels and CHD Events
— data derived from epidemiologic studies and clinical trials — 3.7 2.9 2.2 1.7 1.3 1.0 • • Relative Risk of CHD (log scale) • • • “Rule of One” applies when LDL < 100 mg/dl • LDL-Cholesterol (mg/dl) S. Grundy et al. Circulation 2004;110:227-39
 • • • Rule of One applies when LDL < 100 mg/dl. • LDL-Cholesterol (mg/dl) S. Grundy et al. Circulation 2004;110:")
6
HEART PROTECTION STUDY
Lancet November 30, 2002, pag 1783

7
Le Linee Guida: i livelli di LDL-C
NCEP Adult Treatment Panel III update 2004 † National Cholesterol Education Program (NCEP) Expert Panel on Detection, Evaluation and Treatment of High Blood Cholesterol in Adults (Adult Treatment Panel, ATP) *TLC: therapeutic lifestyle change (cambiamenti terapeutici dello stile di vita) Grundy SM, Cleeman JI, Merz CNB, et al. Implications of recent clinical trials for the National Cholesterol Education Program Adult Treatment Panel III Guidelines. Circulation. 2004;110:227–239 Rischio alto: CHD o equivalenti del rischio di CHD (rischio di CHD a 10 aa >20%) Obiettivo LDL-C < 100 mg/dl valore ideale opzionale < 70 mg/dl Joint British Societes 2005 † JBS 2: Joint British Societies’ guidelines on prevention of cardiovascular disease in clinical practice; Formerly British Heart Journal Journal of the British Cardiac Society Volume 91 Supplement V December 2005 Rischio alto: CHD o equivalenti del rischio di CHD (Total CVD risk† ≥ 20%) Obiettivo LDL-C < 80 mg/dl European Guidelines On Vascular Disease Prevention in Clinical Practice 2007 Fourth Joint Task Force of the European Society of Cardiology and Other Societies on Cardiovascular Disease Prevention in ClinicalPractice (Constituted by representatives of nine societies and by invited experts) European Heart Journal (2007) 28, 2375–2414 Obiettivo LDL-C < 100 mg/dl valore auspicabile < 80 mg/dl
 Expert Panel on Detection, Evaluation and Treatment of High Blood Cholesterol in Adults (Adult Treatment Panel, ATP) *TLC: therapeutic lifestyle change (cambiamenti terapeutici dello stile di vita) Grundy SM, Cleeman JI, Merz CNB, et al. Implications of recent clinical trials for the National Cholesterol Education Program Adult Treatment Panel III Guidelines. Circulation. 2004;110:227–239. Rischio alto: CHD o equivalenti del rischio di CHD (rischio di CHD a 10 aa >20%) Obiettivo LDL-C < 100 mg/dl valore ideale opzionale < 70 mg/dl. Joint British Societes † JBS 2: Joint British Societies’ guidelines on prevention of cardiovascular disease in clinical practice; Formerly British Heart Journal. Journal of the British Cardiac Society Volume 91 Supplement V December Rischio alto: CHD o equivalenti del rischio di CHD (Total CVD risk† ≥ 20%) Obiettivo LDL-C < 80 mg/dl. European Guidelines On Vascular Disease Prevention in Clinical Practice Fourth Joint Task Force of the European Society of Cardiology and Other Societies on Cardiovascular Disease Prevention in ClinicalPractice (Constituted by. representatives of nine societies and by invited experts) European Heart Journal (2007) 28, 2375–2414. Obiettivo LDL-C < 100 mg/dl valore auspicabile < 80 mg/dl.")
9
Le opzioni di trattamento farmacologico

10
Effect of lipid-modifying therapies
Patient Therapy TC LDL HDL TG tolerability Bile acid sequestrants Down 15 – 30% Up 3 5% Neutral or up Poor 20% Nicotinic acid Down 25% Up 15 – 30% 20 50% Poor to reasonable Fibrates Down 15% 5 – Up 20% 20 50% Good Probucol Down 25% 10 – 15% 20 30% Neutral Reasonable Statins* Down 15 – 30% 24 50% Up 6 12% 10 - 29% Good Ezetimibe - Down 18% Up 1% 8% Good TC - total cholesterol, LDL- low density lipoprotein, HDL- high density lipoprotein, TG- triglyceride. *Daily dose of 40mg of each drug. This slide does not include rosuvastatin. Adapted from Yeshurun D, Gotto AM. Southern Med J 1995; 88 (4):379- 391, Knopp RH. N Engl J Med 1999; 341 :498 – 511, Ezetimibe Prescribing Information. ,
: , Knopp. RH. N Engl J Med. 1999; 341. :498. – 511, Ezetimibe Prescribing Information. ,")
11
Estimated change in the five-year relative risk of non-fatal myocardial infarction or CHD death associated with mean LDL-C reduction for the diet, bile-acid sequestrant, surgery, and statin trials (dashed line) along with the 95% probability interval (dotted line). The solid line has a slope=1 J.G. Robinson, J Am Coll Cardiol 2005; 46:

12
CHD EVENTS AND LDL-C IN STATIN TRIALS
Lancet 367, 69, 2006

13
L’ intensità del trattamento con statine e coronaropatia

14
Published at www.nejm.org March 8, 2005

15
Published at www.nejm.org March 8, 2005

16
NEJM 350, 2004

19
Effect of a 3-month lipid lowering therapy
on cell composition of carotid plaque Lymphocytes Smooth muscle cells ┌ - n.s. - ┐ ┌ ┐ Macrophages ┌ ┐ ┌ ┐ Percentage of plaque area (ANOVA p=0.031) (ANOVA p=0.003) (ANOVA n.s.=0.621) C-S AT-10 AT-80 P. Pauletto et al, AHA meeting 2009
 (ANOVA p=0.003) (ANOVA n.s.=0.621) C-S. AT-10. AT-80. P. Pauletto et al, AHA meeting")
20
Plasma LDL-Chol levels
before and after a 3-month lipid lowering therapy mg/dL NS NS

21
Effect of a 3-month lipid lowering therapy
on cell composition of carotid plaque Cells per area unit

22
Il rimodellamento coronarico nei pazienti trattati con statine

23
Intravascular Ultrasound Images at Baseline and Follow-up
— an example of plaque regression — Nissen et al. JAMA 2004;291:1079

24
JAMA 2004;291:

25
JAMA 2006; 295, 13 March

26
JAMA 2006; 295, 13 March

27
Correggendo i livelli di infiammazione si riduce il rischio CV ?

28
CRP in 3745 patients wiht ACS
(PROVE IT-TIMI22) Ridker PM et al. NEJM 2005
 Ridker PM et al. NEJM")
30
JUPITER - Primary Endpoint MI, Stroke, UA/Revascularization, CV Death
Placebo 251 / 8901 0.08 HR 0.56, 95% CI P < Number Needed to Treat (NNT2) = 95 Number Needed to Treat (NNT5) = 25 * -44% 0.06 109 Fewer Events *Extrapolated figure based on Altman and Andersen method Cumulative Incidence 0.04 Rosuvastatin 142 / 8901 0.02 Ridker P et al. N Eng J Med 2008;359: 0.00 1 2 3 4 Follow-up (years) Number at Risk Rosuvastatin 8,901 8,631 8,412 6,540 3,893 1,958 1,353 983 544 157 Placebo 8,901 8,621 8,353 6,508 3,872 1,963 1,333 955 534 174
 = 95. Number Needed to Treat (NNT5) = 25. * -44% Fewer Events. *Extrapolated figure based on. Altman and Andersen method. Cumulative Incidence Rosuvastatin 142 / Ridker P et al. N Eng J Med 2008;359: Follow-up (years) Number at Risk. Rosuvastatin. 8,901. 8,631. 8,412. 6,540. 3,893. 1,958. 1, Placebo. 8,901. 8,621. 8,353. 6,508. 3,872. 1,963. 1,")
31
JUPITER - Primary Endpoint Components
Placebo Rosuvastatin HR 95% CI p-value [n=8901] [n=8901] n (rate**) n (rate**) Primary Endpoint (1.36) (0.77) <0.001* (Time to first occurrence of CV death, MI, stroke, unstable angina, arterial revascularisation) Non-fatal MI (0.33) (0.12) <0.001* Fatal or non-fatal MI (0.37) (0.17) Non-fatal stroke (0.31) (0.16) Fatal or non-fatal stroke (0.34) (0.18) Arterial Revascularization (0.71) (0.38) <0.0001 Unstable angina† (0.14) (0.09) CV death, stroke, MI (0.85) (0.45) <0.001* Revascularization or unstable angina (0.77) (0.41) <0.001* Results: At the time of study termination (median follow-up 1.9 years, maximal follow up 5.0 years), the primary outcome had occurred in 142 patients in the rosuvastatin group and in 251 patients in the placebo group which represented a 44% relative risk reduction (HR 0.56; 95% CI: 0.46 to 0.69; p< ). Rosuvastatin also resulted in significant reductions in rates of the individual components of the primary endpoint, with the exception of unstable angina. Reference Ridker P et al. Rosuvastatin to prevent vascular events in men and women with elevated C-reactive protein. N Engl J Med 2008; 359: ** Rates are per 100 person years; † Hospitalisation due to unstable angina; *Actual p-value was < HR – Hazard Ratio; CI – Confidence Limit Ridker P et al. N Eng J Med 2008;359:
 n (rate**) Primary Endpoint 251 (1.36) 142 (0.77) <0.001* (Time to first occurrence of CV death, MI, stroke, unstable angina, arterial revascularisation) Non-fatal MI 62 (0.33) 22 (0.12) <0.001* Fatal or non-fatal MI 68 (0.37) 31 (0.17) Non-fatal stroke 58 (0.31) 30 (0.16) Fatal or non-fatal stroke 64 (0.34) 33 (0.18) Arterial Revascularization 131 (0.71) 71 (0.38) < Unstable angina† 27 (0.14) 16 (0.09) CV death, stroke, MI 157 (0.85) 83 (0.45) <0.001* Revascularization. or unstable angina 143 (0.77) 76 (0.41) <0.001* Results: At the time of study termination (median follow-up 1.9 years, maximal follow up 5.0 years), the primary outcome had occurred in 142 patients in the rosuvastatin group and in 251 patients in the placebo group which represented a 44% relative risk reduction (HR 0.56; 95% CI: 0.46 to 0.69; p< ). Rosuvastatin also resulted in significant reductions in rates of the individual components of the primary endpoint, with the exception of unstable angina. Reference Ridker P et al. Rosuvastatin to prevent vascular events in men and women with elevated C-reactive protein. N Engl J Med 2008; 359: ** Rates are per 100 person years; † Hospitalisation due to unstable angina; *Actual p-value was < HR – Hazard Ratio; CI – Confidence Limit. Ridker P et al. N Eng J Med 2008;359:")
32
JUPITER - Total Mortality Death from any cause
0.06 Placebo N=247 Hazard Ratio 0.80 (95% CI ) p=0.02 -20% 0.05 Rosuvastatin 20mg N=198 0.04 Cumulative Incidence 0.03 0.02 Results: Looking now at total mortality, there were 198 deaths in the rosuvastatin group compared to 247 deaths in the placebo group – HR 0.80; 95% CI: 0.67 to 0.97; p=0.02. Significantly reducing the risk of death from any cause is a unique finding for statins in a patient population without established coronary heart disease. The rates of death from any cause were 1.00 and 1.25 per 100 person-years of follow-up in the rosuvastatin and placebo groups, respectively. Reference Ridker P et al. Rosuvastatin to prevent vascular events in men and women with elevated C-reactive protein. N Engl J Med 2008; 359: NOTE: COPYRIGHT PERMISSIONS REQUIRED FOR THIS SLIDE 0.01 0.00 1 2 3 4 Follow-up (years) Number at Risk Rosuvastatin 8,901 8,847 8,787 6,999 4,312 2,268 1,602 1,192 683 227 Placebo 8,901 8,852 8,775 6,987 4,319 2,295 1,614 1,196 684 246 Ridker P et al. N Eng J Med 2008;359:
 p= % Rosuvastatin 20mg. N= Cumulative Incidence Results: Looking now at total mortality, there were 198 deaths in the rosuvastatin group compared to 247 deaths in the placebo group – HR 0.80; 95% CI: 0.67 to 0.97; p=0.02. Significantly reducing the risk of death from any cause is a unique finding for statins in a patient population without established coronary heart disease. The rates of death from any cause were 1.00 and 1.25 per 100 person-years of follow-up in the rosuvastatin and placebo groups, respectively. Reference Ridker P et al. Rosuvastatin to prevent vascular events in men and women with elevated C-reactive protein. N Engl J Med 2008; 359: NOTE: COPYRIGHT PERMISSIONS REQUIRED FOR THIS SLIDE Follow-up (years) Number at Risk. Rosuvastatin. 8,901. 8,847. 8,787. 6,999. 4,312. 2,268. 1,602. 1, Placebo. 8,901. 8,852. 8,775. 6,987. 4,319. 2,295. 1,614. 1, Ridker P et al. N Eng J Med 2008;359:")
33
LDL-CT and hs-CRP Levels during the Follow-up Period
Baseline level: LDL-CT=108 mg/dL both groups; hs-CRP=4.2 vs 4.3 mg/L in placebo PM Ridker, et al. N Engl J Med 2008;359:

34
Cumulative Incidence of Cardiovascular Events According to Study Group
Panel A shows the cumulative incidence of the primary end point (nonfatal myocardial infarction, nonfatal stroke, arterial revascularization, hospitalization for unstable angina, or confirmed death from cardiovascular causes). The hazard ratio for rosuvastatin, as compared with placebo, was 0.56 (95% confidence interval [CI], 0.46 to 0.69; P< ). Panel B shows the cumulative incidence of nonfatal myocardial infarction, nonfatal stroke, or death from cardiovascular causes, for which the hazard ratio in the rosuvastatin group was 0.53 (95% CI, 0.40 to 0.69; P< ). Panel C shows the cumulative incidence of arterial revascularization or hospitalization for unstable angina, for which the hazard ratio in the rosuvastatin group was 0.53 (95% CI, 0.40 to 0.70; P< ). Panel D shows the cumulative incidence of death from any cause, for which the hazard ratio in the rosuvastatin group was 0.80 (95% CI, 0.67 to 0.97; P = 0.02). In each panel, the inset shows the same data on an enlarged y axis and on a condensed x axis. PM Ridker, et al. N Engl J Med 2008;359:
. The hazard ratio for rosuvastatin, as compared with placebo, was 0.56 (95% confidence interval [CI], 0.46 to 0.69; P< ). Panel B shows the cumulative incidence of nonfatal myocardial infarction, nonfatal stroke, or death from cardiovascular causes, for which the hazard ratio in the rosuvastatin group was 0.53 (95% CI, 0.40 to 0.69; P< ). Panel C shows the cumulative incidence of arterial revascularization or hospitalization for unstable angina, for which the hazard ratio in the rosuvastatin group was 0.53 (95% CI, 0.40 to 0.70; P< ). Panel D shows the cumulative incidence of death from any cause, for which the hazard ratio in the rosuvastatin group was 0.80 (95% CI, 0.67 to 0.97; P = 0.02). In each panel, the inset shows the same data on an enlarged y axis and on a condensed x axis. PM Ridker, et al. N Engl J Med 2008;359:")
35
Relationship of the proportional reduction in cardiovascular event rate and mean LDL cholesterol difference between treatment groups in published statin trials Relationship of the proportional reduction in cardiovascular event rate and mean LDL cholesterol difference between treatment groups in published statin trials. Gray square represents summary data from randomized trials of statin therapy versus placebo as summarized by the Cholesterol Treatment Trialists’ (CTT) Collaboration, and solid squares represent results of individual trials comparing different intensities of statin therapy. Open circle represents projected benefit of rosuvastatin and closed circle represents observed benefit in the JUPITER trial. Vertical lines are 95 % confidence intervals. PROVE IT = Pravastatin or Atorvastatin Evaluation and Infection Therapy; IDEAL = Incremental Decrease in End Points Through Aggressive Lipid-Lowering; TNT = Treating to New Targets; A-to-Z = Aggrastat-to-Zocor. Figure adapted from Bowman L, Armitage J, Bulbulia R, Parish S, Collins R. Study of the effectiveness of additional reductions in cholesterol and homocysteine (SEARCH): characteristics of a randomized trial among myocardial infarction survivors. Am Heart J 2007; 154: PM Ridker, et al. N Engl J Med 2008;359: Online Supplemental Appendix
 Collaboration, and solid squares represent results of individual trials comparing different intensities of statin therapy. Open circle represents projected benefit of rosuvastatin and closed circle represents observed benefit in the JUPITER trial. Vertical lines are 95 % confidence intervals. PROVE IT = Pravastatin or Atorvastatin Evaluation and Infection Therapy; IDEAL = Incremental Decrease in End Points Through Aggressive Lipid-Lowering; TNT = Treating to New Targets; A-to-Z = Aggrastat-to-Zocor. Figure adapted from Bowman L, Armitage J, Bulbulia R, Parish S, Collins R. Study of the effectiveness of additional reductions in cholesterol and homocysteine (SEARCH): characteristics of a randomized trial among myocardial infarction survivors. Am Heart J 2007; 154: PM Ridker, et al. N Engl J Med 2008;359: Online Supplemental Appendix.")
36
and the primary prevention of CHD
The results of JUPITER and the primary prevention of CHD Should indications for statin treatment be expanded? How should measurements of hs-CRP be used?

37
JUPITER: potential limitations / warnings
Hard cardiac events 1.8% (157 of 8901 subjects) in the placebo group vs 0.9% (83 of 8901 subjects) in the rosuvastatin group: 120 participants were treated for 1.9 years to prevent one event. Significantly higher HbA1levels and incidence of diabetes in the rosuvastatin group (3.0%, vs. 2.4% in the placebo group;P=0.01) The trial did not compare subjects with and those without hs-CRP measurements Since statins lower both LDL cholesterol and hs-CRP we cannot determine whether CT, a reduction in inflammation, or a combination of both are responsible for the benefit Meta-regression is not a reliable technique, and the early termination of the trial owing to the efficacy data probably exaggerated the results to some degree
 in the placebo group. vs 0.9% (83 of 8901 subjects) in the rosuvastatin group: 120 participants were treated for 1.9 years to prevent one event. Significantly higher HbA1levels and incidence of diabetes in the rosuvastatin group (3.0%, vs. 2.4% in the placebo group;P=0.01) The trial did not compare subjects with and those without hs-CRP measurements. Since statins lower both LDL cholesterol and hs-CRP we cannot determine whether CT, a reduction in inflammation, or a combination of both are responsible for the benefit. Meta-regression is not a reliable technique, and the early termination of the trial owing to the efficacy data probably exaggerated the results to some degree.")
38
Statine e cardiopatie non ischemiche

40
- 53,6% - 61,3%

41
ENDPOINT PRIMARIO 22% p=0,02

43
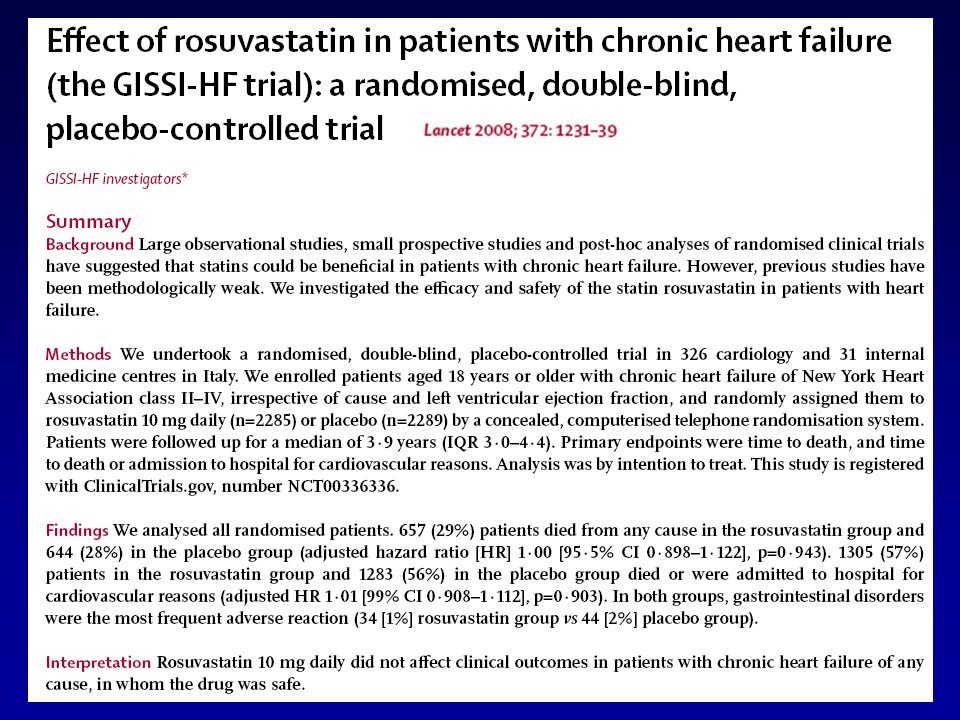
GISSI-HF trial: all-cause death (A)
and admission for cardiovascular reasons (B)
")
44
Terapia di associazione ?

45
Statine + Niacina Negli USA è entrata in commercio l’associazione Lovastatina 20 mg + niacina a lento rilascio (Advicor*) Possibili vantaggi: maggiore riduzione del colesterolo e trigliceridi, maggior incremento del colesterolo HDL e maggior riduzione delle LDL piccole e dense Potenziali rischi: maggior rischio di miopatia e rialzo degli enzimi epatici. Peggioramento del controllo metabolico del diabete o della gotta Brown BG, NEJM Wolfe ML, Am J Cardiol Bays HE, Am J Cardiol 2003

46
Strategie di incremento del colesterolo HDL
Storiche Uso dei fibrati (studio VA-HIT, Helsinki Heart Study) Uso della niacina (studi CLAS, FATS) Future Infusione di Apo A1 Milano (Nissen JAMA 2003) Inibitori della CETP (Brousseau NEJM 2004)
 Uso della niacina (studi CLAS, FATS) Future. Infusione di Apo A1 Milano (Nissen JAMA 2003) Inibitori della CETP (Brousseau NEJM 2004)")
47
Abbiamo bisogno di nuovi target di prevenzione primaria,
oltre all’abbassamento del colesterolo ?

48
Intervento: misure igienico dietetiche
Benefici del decremento ponderale (2- 9 kg) Riduzione dei fattori di rischio: Riduzione p.a.: mm Hg/ 10 kg Riduzione colesterolo LDL % Riduzione della mortalità totale (16- 65%) (Chaturvedi 1995, Eriksson 1998) Benefici dell’esercizio fisico moderato (20’- 30’ al dì / a gg alterni) Riduzione dei fattori di rischio: Aumento HDL Riduzione p.a. Riduzione insulino- resistenza Riduzione della patologia coronarica del 35-55% (Manson 1992, Lakka 1994) Riduzione della mortalità cv (31%) e totale (29%) (Bijnen 1998) Benefici del decremento ponderale Il decremento ponderale è molto difficile da ottenere e mantenere nei diabetici,[i],[ii] ed esistono pochi dati che dimostrino che restrizione calorica, aumento dell'esercizio fisico e decremento ponderale possano ridurre gli eventi clinici dipendenti dalla arteriosclerosi nei diabetici; data la difficoltà nella esecuzione di studi adeguatamente controllati, sono disponibili prevalentemente osservazioni longitudinali. Il decremento ponderale nel primo anno dopo la diagnosi riduce la mortalità cardiovascolare nei diabetici[iii]: in media il decremento di 1 kg aumenta la aspettativa di vita di 3- 4 mesi, cosicché il decremento ponderale di 10 kg in un obeso azzera la riduzione della aspettativa di vita legata all’obesità. Nella coorte europea del WHO Multinational Study of Vascular Disese in Diabetes il decremento ponderale in pazienti con iniziale BMI 29 riduce a 0.84 il rischio relativo di mortalità[iv]. Nello studio prospettico di Malmö[v],[vi] in diabetici neodiagnosticati ed in ipoglicotolleranti la mortalità totale dei soggetti con un decremento ponderale da 2 a 3.3 kg si è ridotta al 3.2% (analogo al 3.7% della popolazione generale), indipendentemente dalla riduzione di altri fattori di rischio, mentre la mortalità nei non dimagriti è stata del 11.9% Con il decremento ponderale (anche lieve 5- 9 kg) migliorano molti fattori di rischio arteriosclerotico[vii]: ipertensione, distribuzione del grasso corporeo[viii], iperglicemia, trigliceridi, colesterolo LDL, colesterolo HDL, sensibilità all'insulina ed iperinsulinismo[ix], PAI- 1[x]. La restrizione calorica produce gli stessi effetti anche quando non determina adeguato decremento ponderale[xi] . Benefici dell’esercizio fisico. E’ noto che l'esercizio fisico nei diabetici aumenta metabolismo aerobico, migliora la sensibilità alla insulina, riduce le fluttuazioni glicemiche e migliora l’equilibrio glicemico, favorisce il decremento ponderale e la riduzione dell'obesità addominale, migliora il profilo lipidico, riduce la pressione arteriosa, aumenta la fibrinolisi, aumenta il flusso vasale e migliora l’elasticità dei vasi[xii], [xiii], [xiv]. Nella popolazione generale l'attività fisica riduce il rischio di cardiopatia coronarica del %[xv], [xvi]. In particolare, secondo un recente studio prospettico di 10 anni, nei maschi di età 65 anni camminare o andare in bicicletta per almeno 20 minuti a giorni alterni è associato con ridotta mortalità cardiovascolare [R.R (I.C )] e ridotta mortalità per tutte le cause [R.R (IC )] [xvii]. Nel diabete di tipo 1 la attività fisica regolare (dispendio energetico 2000 Kcal /settimana) è associato con riduzione della mortalità totale e delle complicanze del diabete[xviii]. In sintesi: Il controllo del sovrappeso corporeo, la composizione qualitativa della dieta e lo svolgimento di un regolare esercizio fisico riducono nei pazienti diabetici i fattori di rischio cardiovascolare 32, 37, 38, 39 e la mortalità cardiovascolare 28, 29, 30, 31 (Evidenza di livello 3) [i] Turner R, Cull C, Holman R. United Kingdom Prospective Diabetes Study 17: a 9-year update of a randomized, controlled trial on the effect of improved metabolic control on complications in non-insulin-dependent diabetes mellitus. Ann Intern Med. 1996; 124: [ii] Wing RR. Weight Loss in the Management of Type 2 Diabetes in: Gerstein HC and Haynes RB (Eds) Evidence- Based Diabetes Care. Hamilton . London: BC Decker Inc; pagg [iii] Lean ME, Powrie JK, Anderson AS, Garthwaite PH. Obesity, weight loss and prognosis in type 2 diabetes. Diabet Med 1990; 7: [iv] Chaturvedi N, Fuller JH. Mortality risk by body weight and weight change in people with NIDDM. The WHO Multinational Study of Vascular Disease in Diabetes. Diabetes Care ; 18: [v] Eriksson KF, Lindgarde F. Prevention of type 2 (non-insulin-dependent) diabetes mellitus by diet and physical exercise. The 6-year Malmo feasibility study. Diabetologia. 1991; 34: [vi] Eriksson KF, Lindgarde F. No excess 12-year mortality in men with impaired glucose tolerance who participated in the Malmo Preventive Trial with diet and exercise. Diabetologia. 1998; 41: [vii] Wing RR, Koeske R, Epstein LH, Nowalk MP, Gooding W, Becker D. Long-term effects of modest weight loss in type II diabetic patients. Arch Intern Med. 1987; 147: [viii] Maggio CA, Pi-Sunyer FX. The prevention and treatment of obesity: application to type 2 diabetes. Technical Review Diabetes Care 1997; 20: [ix] Mann JI. The role of nutritional modifications in the prevention of macrovascular complications of diabetes. Diabetes. 1997; 46 Suppl 2: S [x] Charles MA, Morange P, Eschwege E, Andre P, Vague P, Juhan-Vague I. Effect of weight change and metformin on fibrinolysis and the von Willebrand factor in obese nondiabetic subjects: the BIGPRO1 Study. Biguanides and the Prevention of the Risk of Obesity. Diabetes Care ; 21: [xi] Wing RR, Blair EH, Bononi P, Marcus MD, Watanabe R, Bergman RN. Caloric restriction per se is a significant factor in improvements in glycemic control and insulin sensitivity during weight loss in obese NIDDM patients. Diabetes Care. 1994; 17: 30- 6 [xii] Schneider SH, Ruderman NB: Exercise and NIDDM (Technical Review). Diabetes Care 1990; 13:785–789, [xiii] Wasserman DH, Zinman B: Exercise in individuals with IDDM (Technical Review). Diabetes Care 1994; 17:924–937. [xiv] Physical Activity/Exercise and Diabetes Mellitus Diabetes Care : [xv] Lakka TA, Venalainen JM, Rauramaa R, Salonen R, Tuomilehto J, Salonen JT. Relation of leisure-time physical activity and cardiorespiratory fitness to the risk of acute myocardial infarction. N Engl J Med ; 330: [xvi] Manson JE, Nathan DM, Krolewski AS, Stampfer MJ, Willett WC, Hennekens CH. A prospective study of exercise and incidence of diabetes among US male physicians. JAMA. 1992; 268 : 63-7. [xvii] Bijnen FC, Caspersen CJ, Feskens EJ, Saris WH, Mosterd WL, Kromhout D. Related Articles, Links Physical activity and 10-year mortality from cardiovascular diseases and all causes: The Zutphen Elderly Study. Arch Intern Med. 1998; 158 : [xviii] Moy CS, Songer TJ, LaPorte RE, Dorman JS, Kriska AM, Orchard TJ, Becker DJ, Drash AL. Insulin-dependent diabetes mellitus, physical activity, and death. Am J Epidemiol. 1993; 137:
 Riduzione dei fattori di rischio: Riduzione p.a.: mm Hg/ 10 kg. Riduzione colesterolo LDL % Riduzione della mortalità totale (16- 65%) (Chaturvedi 1995, Eriksson 1998) Benefici dell’esercizio fisico moderato. (20’- 30’ al dì / a gg alterni) Riduzione dei fattori di rischio: Aumento HDL. Riduzione p.a. Riduzione insulino- resistenza. Riduzione della patologia coronarica del 35-55% (Manson 1992, Lakka 1994) Riduzione della mortalità cv (31%) e totale (29%) (Bijnen 1998) Benefici del decremento ponderale. Il decremento ponderale è molto difficile da ottenere e mantenere nei diabetici,[i],[ii] ed esistono pochi dati che dimostrino che restrizione calorica, aumento dell esercizio fisico e decremento ponderale possano ridurre gli eventi clinici dipendenti dalla arteriosclerosi nei diabetici; data la difficoltà nella esecuzione di studi adeguatamente controllati, sono disponibili prevalentemente osservazioni longitudinali. Il decremento ponderale nel primo anno dopo la diagnosi riduce la mortalità cardiovascolare nei diabetici[iii]: in media il decremento di 1 kg aumenta la aspettativa di vita di 3- 4 mesi, cosicché il decremento ponderale di 10 kg in un obeso azzera la riduzione della aspettativa di vita legata all’obesità. Nella coorte europea del WHO Multinational Study of Vascular Disese in Diabetes il decremento ponderale in pazienti con iniziale BMI 29 riduce a 0.84 il rischio relativo di mortalità[iv]. Nello studio prospettico di Malmö[v],[vi] in diabetici neodiagnosticati ed in ipoglicotolleranti la mortalità totale dei soggetti con un decremento ponderale da 2 a 3.3 kg si è ridotta al 3.2% (analogo al 3.7% della popolazione generale), indipendentemente dalla riduzione di altri fattori di rischio, mentre la mortalità nei non dimagriti è stata del 11.9% Con il decremento ponderale (anche lieve 5- 9 kg) migliorano molti fattori di rischio arteriosclerotico[vii]: ipertensione, distribuzione del grasso corporeo[viii], iperglicemia, trigliceridi, colesterolo LDL, colesterolo HDL, sensibilità all insulina ed iperinsulinismo[ix], PAI- 1[x]. La restrizione calorica produce gli stessi effetti anche quando non determina adeguato decremento ponderale[xi] . Benefici dell’esercizio fisico. E’ noto che l esercizio fisico nei diabetici aumenta metabolismo aerobico, migliora la sensibilità alla insulina, riduce le fluttuazioni glicemiche e migliora l’equilibrio glicemico, favorisce il decremento ponderale e la riduzione dell obesità addominale, migliora il profilo lipidico, riduce la pressione arteriosa, aumenta la fibrinolisi, aumenta il flusso vasale e migliora l’elasticità dei vasi[xii], [xiii], [xiv]. Nella popolazione generale l attività fisica riduce il rischio di cardiopatia coronarica del %[xv], [xvi]. In particolare, secondo un recente studio prospettico di 10 anni, nei maschi di età 65 anni camminare o andare in bicicletta per almeno 20 minuti a giorni alterni è associato con ridotta mortalità cardiovascolare [R.R (I.C )] e ridotta mortalità per tutte le cause [R.R (IC )] [xvii]. Nel diabete di tipo 1 la attività fisica regolare (dispendio energetico 2000 Kcal /settimana) è associato con riduzione della mortalità totale e delle complicanze del diabete[xviii]. In sintesi: Il controllo del sovrappeso corporeo, la composizione qualitativa della dieta e lo svolgimento di un regolare esercizio fisico riducono nei pazienti diabetici i fattori di rischio cardiovascolare 32, 37, 38, 39 e la mortalità cardiovascolare 28, 29, 30, 31 (Evidenza di livello 3) [i] Turner R, Cull C, Holman R. United Kingdom Prospective Diabetes Study 17: a 9-year update of a randomized, controlled trial on the effect of improved metabolic control on complications in non-insulin-dependent diabetes mellitus. Ann Intern Med. 1996; 124: [ii] Wing RR. Weight Loss in the Management of Type 2 Diabetes in: Gerstein HC and Haynes RB (Eds) Evidence- Based Diabetes Care. Hamilton . London: BC Decker Inc; pagg [iii] Lean ME, Powrie JK, Anderson AS, Garthwaite PH. Obesity, weight loss and prognosis in type 2 diabetes. Diabet Med 1990; 7: [iv] Chaturvedi N, Fuller JH. Mortality risk by body weight and weight change in people with NIDDM. The WHO Multinational Study of Vascular Disease in Diabetes. Diabetes Care ; 18: [v] Eriksson KF, Lindgarde F. Prevention of type 2 (non-insulin-dependent) diabetes mellitus by diet and physical exercise. The 6-year Malmo feasibility study. Diabetologia. 1991; 34: [vi] Eriksson KF, Lindgarde F. No excess 12-year mortality in men with impaired glucose tolerance who participated in the Malmo Preventive Trial with diet and exercise. Diabetologia. 1998; 41: [vii] Wing RR, Koeske R, Epstein LH, Nowalk MP, Gooding W, Becker D. Long-term effects of modest weight loss in type II diabetic patients. Arch Intern Med. 1987; 147: [viii] Maggio CA, Pi-Sunyer FX. The prevention and treatment of obesity: application to type 2 diabetes. Technical Review Diabetes Care 1997; 20: [ix] Mann JI. The role of nutritional modifications in the prevention of macrovascular complications of diabetes. Diabetes. 1997; 46 Suppl 2: S [x] Charles MA, Morange P, Eschwege E, Andre P, Vague P, Juhan-Vague I. Effect of weight change and metformin on fibrinolysis and the von Willebrand factor in obese nondiabetic subjects: the BIGPRO1 Study. Biguanides and the Prevention of the Risk of Obesity. Diabetes Care ; 21: [xi] Wing RR, Blair EH, Bononi P, Marcus MD, Watanabe R, Bergman RN. Caloric restriction per se is a significant factor in improvements in glycemic control and insulin sensitivity during weight loss in obese NIDDM patients. Diabetes Care. 1994; 17: [xii] Schneider SH, Ruderman NB: Exercise and NIDDM (Technical Review). Diabetes Care 1990; 13:785–789, [xiii] Wasserman DH, Zinman B: Exercise in individuals with IDDM (Technical Review). Diabetes Care 1994; 17:924–937. [xiv] Physical Activity/Exercise and Diabetes Mellitus Diabetes Care : [xv] Lakka TA, Venalainen JM, Rauramaa R, Salonen R, Tuomilehto J, Salonen JT. Relation of leisure-time physical activity and cardiorespiratory fitness to the risk of acute myocardial infarction. N Engl J Med ; 330: [xvi] Manson JE, Nathan DM, Krolewski AS, Stampfer MJ, Willett WC, Hennekens CH. A prospective study of exercise and incidence of diabetes among US male physicians. JAMA. 1992; 268 : [xvii] Bijnen FC, Caspersen CJ, Feskens EJ, Saris WH, Mosterd WL, Kromhout D. Related Articles, Links Physical activity and 10-year mortality from cardiovascular diseases and all causes: The Zutphen Elderly Study. Arch Intern Med. 1998; 158 : [xviii] Moy CS, Songer TJ, LaPorte RE, Dorman JS, Kriska AM, Orchard TJ, Becker DJ, Drash AL. Insulin-dependent diabetes mellitus, physical activity, and death. Am J Epidemiol. 1993; 137:")
49
Bisogna, alla luce dell’elevatissima prevalenza della sindrome metabolica, educare già i nostri giovani ad una corretta alimentazione associata ad un adeguato esercizio fisico.

50
del C-LDL calcolato (settimana 12) Variazione % media dal basale
Ezetimibe associato con simvastatina: efficacia sul C-LDL Ezetimibe 10 mg + simvastatina 20 mg Simvastatina 20 mg 40 mg 80 mg –10 –20 del C-LDL calcolato (settimana 12) Variazione % media dal basale –30 –36* –36* Informazione chiave: L’Ezetimibe associato con simvastatina 10 mg ha fornito una riduzione del C-LDL significativamente superiore a tutte le dosi tranne che alla dose massima raccomandata di simvastatina da sola. Nello studio l’Ezetimibe (10 mg/die) è stato associato con simvastatina al dosaggio di 10, 20, 40 e 80 mg/die. Le dosi più basse di simvastatina studiate (10 e 20 mg/die) associate con 10 mg di Ezetrol sono state efficaci quanto la simvastatina 80 mg/die in monoterapia e significativamente più efficaci (p<0,01) della simvastatina in monoterapia al dosaggio di 10, 20 o 40 mg/die nel ridurre il valore calcolato di C-LDL. L’ Ezetimibe associato con simvastatina 10 mg ha ridotto il valore calcolato del C-LDL del 44% mentre la simvastatina al dosaggio di 10, 20, 40 e 80 mg ha fornito le rispettive riduzioni del 27%, 36%, 36% e 44%. Oltre ai dati mostrati, l’ Ezetimibe associato con ciascuna dose di simvastatina ha fornito una significativa riduzione incrementale del C-LDL, superiore alla dose di statina somministrata da sola (p<0,01 per ciascuna dose).31 –40 –44 –44 –50 –60 *p<0.01 terapia di associazione vs. statina da sola Tratto da Davidson MH et al J Am Coll Cardiol 2002;40:
 Variazione % media dal basale. –30. –36* –36* Informazione chiave: L’Ezetimibe associato con simvastatina 10 mg ha fornito una riduzione del C-LDL significativamente superiore a tutte le dosi tranne che alla dose massima raccomandata di simvastatina da sola. Nello studio l’Ezetimibe (10 mg/die) è stato associato con simvastatina al dosaggio di 10, 20, 40 e 80 mg/die. Le dosi più basse di simvastatina studiate (10 e 20 mg/die) associate con 10 mg di Ezetrol sono state efficaci quanto la simvastatina 80 mg/die in monoterapia e significativamente più efficaci (p<0,01) della simvastatina in monoterapia al dosaggio di 10, 20 o 40 mg/die nel ridurre il valore calcolato di C-LDL. L’ Ezetimibe associato con simvastatina 10 mg ha ridotto il valore calcolato del C-LDL del 44% mentre la simvastatina al dosaggio di 10, 20, 40 e 80 mg ha fornito le rispettive riduzioni del 27%, 36%, 36% e 44%. Oltre ai dati mostrati, l’ Ezetimibe associato con ciascuna dose di simvastatina ha fornito una significativa riduzione incrementale del C-LDL, superiore alla dose di statina somministrata da sola (p<0,01 per ciascuna dose).31. –40. –44. –44. –50. –60. *p<0.01 terapia di associazione vs. statina da sola. Tratto da Davidson MH et al J Am Coll Cardiol 2002;40:")
51
Ezetimibe associato con atorvastatina: efficacia sul C-LDL
Ezetimibe 10 mg + atorvastatina 10 mg Atorvastatina 10 mg 20 mg 40 mg 80 mg –10 –20 del C-LDL calcolato (settimana 12) Variazione % media dalbasale –30 –37* –42* Informazione chiave: L’ Ezetimibe associato con atorvastatina 10 mg ha fornito una riduzione del C-LDL significativamente superiore a tutte le dosi tranne che alla dose massima raccomandata di atorvastatina da sola. L’associazione di Ezetimibe (10 mg/die) con la dose più bassa di atorvastatina (10 mg/die) è stata efficace quanto l’atorvastatina 80 mg/die da sola nel ridurre il C-LDL. L’associazione dell’ Ezetimibe con atorvastatina, entrambe a 10 mg/die, è stata significativamente più efficace (p<0,01) della monoterapia con atorvastatina 10, 20 o 40 mg al giorno. L’ Ezetimibe associato con l’atorvastatina 10 mg ha ridotto il valore di C-LDL calcolato del 53%; le rispettive riduzioni con atorvastatina 10, 20, 40, e 80 mg sono state del 37%, 42%, 45% e 54%. Oltre ai dati qui mostrati, l’Ezetimibe associato con ciascuna dose di atorvastatina ha fornito significative riduzioni incrementali del C-LDL, superiore alla dose di statina da sola (p<0,01 per ciascuna dose).30 –40 –45* –53 –50 –54 –60 *p<0,01 terapia di associazione vs. statina da sola Tratto da Ballantyne CM et al Circulation 2003;107:
 Variazione % media dalbasale. –30. –37* –42* Informazione chiave: L’ Ezetimibe associato con atorvastatina 10 mg ha fornito una riduzione del C-LDL significativamente superiore a tutte le dosi tranne che alla dose massima raccomandata di atorvastatina da sola. L’associazione di Ezetimibe (10 mg/die) con la dose più bassa di atorvastatina (10 mg/die) è stata efficace quanto l’atorvastatina 80 mg/die da sola nel ridurre il C-LDL. L’associazione dell’ Ezetimibe con atorvastatina, entrambe a 10 mg/die, è stata significativamente più efficace (p<0,01) della monoterapia con atorvastatina 10, 20 o 40 mg al giorno. L’ Ezetimibe associato con l’atorvastatina 10 mg ha ridotto il valore di C-LDL calcolato del 53%; le rispettive riduzioni con atorvastatina 10, 20, 40, e 80 mg sono state del 37%, 42%, 45% e 54%. Oltre ai dati qui mostrati, l’Ezetimibe associato con ciascuna dose di atorvastatina ha fornito significative riduzioni incrementali del C-LDL, superiore alla dose di statina da sola (p<0,01 per ciascuna dose).30. –40. –45* –53. –50. –54. –60. *p<0,01 terapia di associazione vs. statina da sola. Tratto da Ballantyne CM et al Circulation 2003;107:")
52
simvastatina (10–80 mg) (n=274) C-LDL calcolato (mmol/l)
Studio sull’associazione fra ezetimibe e simvastatina: risultati raggruppati sul C-LDL Simvastatina (10–80 mg) (n=263) 4,66 mmol/l Ezetimibe + simvastatina (10–80 mg) (n=274) 4,60 mmol/l Dosi raggruppate C-LDL basale –0,5 –1,0 C-LDL calcolato (mmol/l) Variazione media del –1,5 –1,71 Informazione chiave: L’Ezetimibe associato alla simvastatina è stato più efficace della simvastatina da sola nel ridurre il C-LDL. I dati raggruppati hanno dimostrato che l’Ezetimibe 10 mg/die associato con simvastatina 10, 20, 40 o 80 mg ha fornito un valore finale medio del C-LDL calcolato di 2,22 mmol/l versus 2,95 mmol/l ottenuto con la simvastatina da sola. Globalmente, le riduzioni medie del C-LDL calcolato sono state di 2,38 mmol/l nei pazienti che hanno ricevuto la terapia di associazione e di 1,71 mmol/l in quelli trattati con la simvastatina da sola (una differenza del 28,2%, p<0,01).31 –0,67 mmol/l (–28,2%)* –2,0 –2,38 –2,5 –3,0 *p<0,01 terapia di associazione vs. statina da sola Tratto da Davidson MH et al J Am Coll Cardiol 2002;40:
 (n=263) 4,66 mmol/l. Ezetimibe + simvastatina (10–80 mg) (n=274) 4,60 mmol/l. Dosi raggruppate. C-LDL basale. –0,5. –1,0. C-LDL calcolato (mmol/l) Variazione media del. –1,5. –1,71. Informazione chiave: L’Ezetimibe associato alla simvastatina è stato più efficace della simvastatina da sola nel ridurre il C-LDL. I dati raggruppati hanno dimostrato che l’Ezetimibe 10 mg/die associato con simvastatina 10, 20, 40 o 80 mg ha fornito un valore finale medio del C-LDL calcolato di 2,22 mmol/l versus 2,95 mmol/l ottenuto con la simvastatina da sola. Globalmente, le riduzioni medie del C-LDL calcolato sono state di 2,38 mmol/l nei pazienti che hanno ricevuto la terapia di associazione e di 1,71 mmol/l in quelli trattati con la simvastatina da sola (una differenza del 28,2%, p<0,01).31. –0,67 mmol/l (–28,2%)* –2,0. –2,38. –2,5. –3,0. *p<0,01 terapia di associazione vs. statina da sola. Tratto da Davidson MH et al J Am Coll Cardiol 2002;40:")
53
atorvastatina (10–80 mg) (n=255) C-LDL calcolato (mmol/l)
Studio sull’associazione fra ezetimibe e atorvastatina: risultati raggruppati sul C-LDL Atorvastatina (10–80 mg) (n=248) 4,69 mmol/l Ezetimibe + atorvastatina (10–80 mg) (n=255) 4,70 mmol/l Dosi raggruppate C-LDL basale –0,5 –1,0 C-LDL calcolato (mmol/l) Variazione media del –1,5 –2,07 Informazione chiave: L’Ezetimibe associato con la atorvastatina è stato più efficace della atorvastatina da sola nel ridurre il C-LDL. I dati raggruppati hanno dimostrato che l’Ezetimibe 10 mg/die associato con atorvastatina 10, 20, 40 o 80 mg ha fornito un valore finale medio del C-LDL calcolato di 2,04 mmol/l versus 2,61 mmol/l con la atorvastatina in monoterapia. Globalmente, le riduzioni medie del C-LDL calcolato sono state di 2,66 mmol/l nei pazienti che hanno ricevuto la terapia di associazione vs. 2,07 mmol/l in quelli trattati con la sola atorvastatina (una differenza del 22,2%, p<0,01).36 –2,0 –0,59 mmol/l (–22,2%)* –2,66 –2,5 –3,0 *p<0,01 terapia di associazione vs. statina da sola Tratto da Ballantyne CM et al Circulation 2003;107: ; Ballantyne C et al J Am Coll Cardiol 2002;39(suppl A):227A.
 (n=248) 4,69 mmol/l. Ezetimibe + atorvastatina (10–80 mg) (n=255) 4,70 mmol/l. Dosi raggruppate. C-LDL basale. –0,5. –1,0. C-LDL calcolato (mmol/l) Variazione media del. –1,5. –2,07. Informazione chiave: L’Ezetimibe associato con la atorvastatina è stato più efficace della atorvastatina da sola nel ridurre il C-LDL. I dati raggruppati hanno dimostrato che l’Ezetimibe 10 mg/die associato con atorvastatina 10, 20, 40 o 80 mg ha fornito un valore finale medio del C-LDL calcolato di 2,04 mmol/l versus 2,61 mmol/l con la atorvastatina in monoterapia. Globalmente, le riduzioni medie del C-LDL calcolato sono state di 2,66 mmol/l nei pazienti che hanno ricevuto la terapia di associazione vs. 2,07 mmol/l in quelli trattati con la sola atorvastatina (una differenza del 22,2%, p<0,01).36. –2,0. –0,59 mmol/l (–22,2%)* –2,66. –2,5. –3,0. *p<0,01 terapia di associazione vs. statina da sola. Tratto da Ballantyne CM et al Circulation 2003;107: ; Ballantyne C et al J Am Coll Cardiol 2002;39(suppl A):227A.")
54
al termine dello studio
Ezetimibe associato con statine dall’inizio: conformità dei risultati degli studi Ezetimibe più statina ha fornito un C-LDL più basso del % rispetto alla statina da sola Statina da sola Statina + ezetimibe ,5 1,5 2,5 3 3,5 1 2 ,5 1,5 2,5 3 3,5 1 2 3,4 3,4 18% 21% 3,4 21% 2,9 24% 2,8 2,6 23% 2,7 2,7 C-LDL medio (mmol/l) al termine dello studio 2,2 2,0 Informazione chiave: L’Ezetimibe associato con una statina ha fornito livelli di C-LDL uniformemente inferiori rispetto alla monoterapia con statina. Per tutte le statine esaminate (raggruppate per i dosaggi), l’associazione con l’ Ezetimibe ha fornito livelli di C-LDL calcolato uniformemente inferiori al termine dello studio rispetto alla monoterapia con statine. I livelli di C-LDL sono risultati del % inferiori con la terapia di associazione fra l’Ezetimibe e statina rispetto alla monoterapia con statina da sola.26,31,32 Atorvastatina Simvastatina Pravastatina Lovastatina Studio con statina già iniziata Tratto da Dati di Registrazione, MSP; Davidson MH et al J Am Coll Cardiol 2002;40: ; Melani L et al Eur Heart J 2003;24:
 al termine dello studio. 2,2. 2,0. Informazione chiave: L’Ezetimibe associato con una statina ha fornito livelli di C-LDL uniformemente inferiori rispetto alla monoterapia con statina. Per tutte le statine esaminate (raggruppate per i dosaggi), l’associazione con l’ Ezetimibe ha fornito livelli di C-LDL calcolato uniformemente inferiori al termine dello studio rispetto alla monoterapia con statine. I livelli di C-LDL sono risultati del % inferiori con la terapia di associazione fra l’Ezetimibe e statina rispetto alla monoterapia con statina da sola.26,31,32. Atorvastatina. Simvastatina. Pravastatina. Lovastatina. Studio con. statina già iniziata. Tratto da Dati di Registrazione, MSP; Davidson MH et al J Am Coll Cardiol 2002;40: ; Melani L et al Eur Heart J 2003;24:")
55
Variazione % media alla settimana 12
Statina a dose elevata rispetto ad Ezetimibe associato con statina a dose starter (C-LDL) Ezetimibe 10 mg + atorvastatina 10 mg (n=65) Ezetimibe 10 mg + simvastatina 20 mg (n=67) Ezetimibe 10 mg + pravastatina 10 mg (n=71) Atorvastatina 80 mg (n=62) Simvastatina 80 mg (n=67) Pravastatina 40 mg (n=69) –50 –40 –30 –20 –10 –60 Variazione % media alla settimana 12 –31 –34 Informazione chiave: L’Ezetimibe 10 mg/die associato con la più bassa dose di statina ha ridotto il C-LDL plasmatico in modo equivalente alla dose più elevata di statina testata da sola. Negli studi fattoriali, l’associazione di Ezetimibe 10 mg/die con la dose più bassa di statina (10 mg/die) ha fornito riduzioni del C-LDL plasmatico calcolato, simili a quelle osservate con la dose più elevata testata per le rispettive statine in monosomministrazione (40 mg/die per pravastatina, 80 mg/die per simvastatina ed atorvastatina).17,30,31 –44 –44 –53 –54 Tratto dalla Worldwide Product Circular (ezetimibe), MSP; Dati di Registrazione, MSP; Ballantyne CM et al Circulation 2003;107: ; Davidson MH et al J Am Coll Cardiol 2002;40:
 Ezetimibe. 10 mg + atorvastatina. 10 mg. (n=65) Ezetimibe. 10 mg + simvastatina. 20 mg. (n=67) Ezetimibe. 10 mg + pravastatina. 10 mg. (n=71) Atorvastatina. 80 mg. (n=62) Simvastatina. 80 mg. (n=67) Pravastatina. 40 mg. (n=69) –50. –40. –30. –20. –10. –60. Variazione % media alla settimana 12. –31. –34. Informazione chiave: L’Ezetimibe 10 mg/die associato con la più bassa dose di statina ha ridotto il C-LDL plasmatico in modo equivalente alla dose più elevata di statina testata da sola. Negli studi fattoriali, l’associazione di Ezetimibe 10 mg/die con la dose più bassa di statina (10 mg/die) ha fornito riduzioni del C-LDL plasmatico calcolato, simili a quelle osservate con la dose più elevata testata per le rispettive statine in monosomministrazione (40 mg/die per pravastatina, 80 mg/die per simvastatina ed atorvastatina).17,30,31. –44. –44. –53. –54. Tratto dalla Worldwide Product Circular (ezetimibe), MSP; Dati di Registrazione, MSP; Ballantyne CM et al Circulation 2003;107: ; Davidson MH et al J Am Coll Cardiol 2002;40:")
56
Variazione % media dei TG dal basale alla settimana 12
Efficacia sui trigliceridi: Ezetimibe associato con statine - risultati raggruppati Ezetimibe + atorvastatina (n=255) Ezetimibe + simvastatina (n=274) Ezetimibe + pravastatina (n=204) Ezetimibe + lovastatina (n=192) Atorvastatina (n=248) Simvastatina (n=263) Pravastatina (n=205) Lovastatina (n=220) –5 –8 –11 –10 10%** –15 –17 –18 11%** Variazione % media dei TG dal basale alla settimana 12 –20 –22 7%** –25* –24 –25 Informazione chiave: L’associazione dell’Ezetimibe con una statina è stata significativamente più efficace rispetto alla statina da sola nel ridurre i trigliceridi. I risultati degli studi fattoriali hanno mostrato significative riduzioni incrementali dei trigliceridi per ciascuna statina somministrata in associazione con l’Ezetimibe rispetto a ciascuna statina da sola (dal 18 al 33% di riduzione per l’ Ezetimibe più statina, rispetto alla riduzione dall’8 al 25% per la statina da sola). I risultati raggruppati sulla riduzione dei livelli plasmatici di trigliceridi per le dosi di statina derivati da quattro studi clinici di fase III, hanno indicato una significativa superiorità dell’Ezetimibe associato con lovastatina, simvastatina, pravastatina o atorvastatina rispetto alla statina in monosomministrazione (p≤ 0,01 per tutti) 8%** –30 –33* –35 –40 *Variazione mediana; **p<0,01 ezetimibe + dosi raggruppate delle statine vs. dosi raggruppate delle statine da sole Tratto da Ballantyne CM et al Circulation 2003;107: ; Davidson MH et al J Am Coll Cardiol 2002;40: ; Melani L et al Eur Heart J 2003;24: ; Kerzner B et al Am J Cardiol 2003;91:
 Ezetimibe. + simvastatina. (n=274) Ezetimibe. + pravastatina. (n=204) Ezetimibe. + lovastatina. (n=192) Atorvastatina. (n=248) Simvastatina. (n=263) Pravastatina. (n=205) Lovastatina. (n=220) –5. –8. –11. –10. 10%** –15. –17. –18. 11%** Variazione % media dei TG dal basale alla settimana 12. –20. –22. 7%** –25* –24. –25. Informazione chiave: L’associazione dell’Ezetimibe con una statina è stata significativamente più efficace rispetto alla statina da sola nel ridurre i trigliceridi. I risultati degli studi fattoriali hanno mostrato significative riduzioni incrementali dei trigliceridi per ciascuna statina somministrata in associazione con l’Ezetimibe rispetto a ciascuna statina da sola (dal 18 al 33% di riduzione per l’ Ezetimibe più statina, rispetto alla riduzione dall’8 al 25% per la statina da sola). I risultati raggruppati sulla riduzione dei livelli plasmatici di trigliceridi per le dosi di statina derivati da quattro studi clinici di fase III, hanno indicato una significativa superiorità dell’Ezetimibe associato con lovastatina, simvastatina, pravastatina o atorvastatina rispetto alla statina in monosomministrazione (p≤ 0,01 per tutti) %** –30. –33* –35. –40. *Variazione mediana; **p<0,01 ezetimibe + dosi raggruppate delle statine vs. dosi raggruppate delle statine da sole. Tratto da Ballantyne CM et al Circulation 2003;107: ; Davidson MH et al J Am Coll Cardiol 2002;40: ; Melani L et al Eur Heart J 2003;24: ; Kerzner B et al Am J Cardiol 2003;91:")
57
Variazione % media del C-HDL dal basale alla settimana 12
Efficacia sul C- HDL: Ezetimibe associato con statine – risultati raggruppati 2 4 6 8 10 4 7 9 8 3%* 2%** 5%* 1% Variazione % media del C-HDL dal basale alla settimana 12 Informazione chiave: L’associazione dell’Ezetimibe con una statina è stata significativamente più efficace della sola statina nell’incrementare il C-HDL. In quattro studi clinici di fase III, l’associazione dell’Ezetimibe con lovastatina, simvasatina, o atorvastatina è stata significativamente superiore alla sola statina nell’incrementare i livelli plasmatici di C-HDL. Per le dosi di statina studiate, i risultati raggruppati hanno mostrato un incremento del 7% per Ezetimibe più atorvastatina (p<0,01) e del 9% per Ezetimibe più simvastatina (p=0,03) o lovastatina (p<0,01). L’incremento dell’8% osservato per l’associazione con pravastatina non è risultato significativamente diverso dall’incremento del 7% osservato con la statina da sola.30-33 Ezetimibe + atorvastatina (n=255) Atorvastatina (n=248) simvastatina (n=274) Simvastatina (n=263) lovastatina (n=192) Lovastatina (n=220) pravastatina (n=204) Pravastatina (n=205) *p<0,01 ezetimibe + dosi raggruppate della statina vs. dosi raggruppate della statina da sola; **p=0,03 ezetimibe + dosi raggruppate della statina vs. dosi raggruppate della statina da sola. Tratto da Ballantyne CM et al Circulation 2003;107: ; Davidson MH et al J Am Coll Cardiol 2002;40: ; Melani L et al Eur Heart J 2003;24: ; Kerzner B et al Am J Cardiol 2003;91:
 e del 9% per Ezetimibe più simvastatina (p=0,03) o lovastatina (p<0,01). L’incremento dell’8% osservato per l’associazione con pravastatina non è risultato significativamente diverso dall’incremento del 7% osservato con la statina da sola Ezetimibe. + atorvastatina. (n=255) Atorvastatina. (n=248) simvastatina. (n=274) Simvastatina. (n=263) lovastatina. (n=192) Lovastatina. (n=220) pravastatina. (n=204) Pravastatina. (n=205) *p<0,01 ezetimibe + dosi raggruppate della statina vs. dosi raggruppate della statina da sola; **p=0,03 ezetimibe + dosi raggruppate della statina vs. dosi raggruppate della statina da sola. Tratto da Ballantyne CM et al Circulation 2003;107: ; Davidson MH et al J Am Coll Cardiol 2002;40: ; Melani L et al Eur Heart J 2003;24: ; Kerzner B et al Am J Cardiol 2003;91:")
58
Ezetimibe e statine L’ Ezetimibe, quando associato con le statine fin dall’inizio Ha sostanzialmente migliorato l’efficacia su C-LDL, TG, e C-HDL rispetto a ciascuna statina da sola Ezetimibe + bassa dose di statina ha fornito una efficacia simile al massimo dosaggio testato per ciascuna statina Informazione chiave: L’Ezetimibe ha avuto effetti additivi sostanziali quando è stato somministrato in associazione con atorvastatina, simvastatina, pravastatina o lovastatina. L’associazione dell’ Ezetimibe con una statina ha fornito riduzioni significativamente superiori del C-LDL calcolato rispetto a quelle fornite dalle statine in monoterapia (p<0,01). E’ importante sottolineare che le riduzioni ottenute con Ezetimibe 10 mg/die più la dose più bassa di statina sono state almeno della stessa entità di quelle ottenute con i dosaggi massimi raccomandati per la statina. L’associazione dell’Ezetimibe con una statina ha comportato effetti benefici sia sui trigliceridi che, per 3 delle 4 statine studiate, sul C-HDL.30-33 Tratto da Ballantyne CM et al Circulation 2003;107: ; Davidson MH et al J Am Coll Cardiol 2002;40: ; Melani L et al Eur Heart J 2003;24: ; Kerzner B et al Am J Cardiol 2003;91:
. E’ importante sottolineare che le riduzioni ottenute con Ezetimibe 10 mg/die più la dose più bassa di statina sono state almeno della stessa entità di quelle ottenute con i dosaggi massimi raccomandati per la statina. L’associazione dell’Ezetimibe con una statina ha comportato effetti benefici sia sui trigliceridi che, per 3 delle 4 statine studiate, sul C-HDL Tratto da Ballantyne CM et al Circulation 2003;107: ; Davidson MH et al J Am Coll Cardiol 2002;40: ; Melani L et al Eur Heart J 2003;24: ; Kerzner B et al Am J Cardiol 2003;91:")
59
Residual CVD Risk Niacin and Simvastatin
P. Pauletto Medicina Interna I^, Treviso University of Padova - Italy

61
Time to the first primary clinical end point
(death from coronary causes, nonfatal MI, stroke, or revascularization) Figure 2. Kaplan–Meier Curves for the Time to the First of the Components of the Composite Primary Clinical End Point (Death from Coronary Causes, Nonfatal Myocardial Infarction, Confirmed Stroke, or Revascularization for Worsening Ischemia). Panel A shows the curves for the 38 patients in the simvastatin–niacin group and for the 38 in the placebo group; the relative risk (RR) of an event was 0.10 (95 percent confidence interval, 0.01 to 0.81). Panel B shows the curves for the 42 patients assigned to receive simvastatin–niacin and antioxidants and for the 42 in the antioxidant group. Panel C shows the curves for all 80 patients who were assigned to receive simvastatin plus niacin and for the 80 who were not. Panel D shows the curves for the 84 patients who were assigned to receive antioxidants and for the 76 who were not. Brown BG et al. N Engl J Med 2001;345:1583
 Figure 2. Kaplan–Meier Curves for the Time to the First of the Components of the Composite Primary Clinical End Point (Death. from Coronary Causes, Nonfatal Myocardial Infarction, Confirmed Stroke, or Revascularization for Worsening Ischemia). Panel A shows the curves for the 38 patients in the simvastatin–niacin group and for the 38 in the placebo group; the relative risk (RR) of an event was 0.10 (95 percent confidence interval, 0.01 to 0.81). Panel B shows the curves for the 42 patients assigned to receive simvastatin–niacin and antioxidants and for the 42 in the antioxidant group. Panel C shows the curves for all 80 patients who were assigned to receive simvastatin plus niacin and for the 80 who were not. Panel D shows the curves for the 84 patients who were assigned to receive antioxidants and for the 76 who were not. Brown BG et al. N Engl J Med 2001;345:1583.")
62
Stenosis (%) and minimal luminal diameter for nine proximal lesions, for all lesions, and for lesions in various categories of base-line severity, according to treatment group. TABLE 3. MEAN CHANGES, PER PATIENT, IN THE PERCENTAGE OF STENOSIS AND THE MINIMAL LUMINAL DIAMETER FOR NINE PROXIMAL LESIONS, FOR ALL LESIONS, AND FOR LESIONS IN VARIOUS CATEGORIES OF BASE-LINE SEVERITY, ACCORDING TO TREATMENT GROUP.* *The mean for each group (±SD) is based on the mean changes per patient in the various categories of lesions. Data have not been adjusted for multiple comparisons; the results for the primary end point (top row) that were obtained with the Bonferroni–Dunn adjustment for multiple comparisons are given in the text. With Bonferroni’s adjustment, the P values for the comparisons between the active treatment groups and the placebo group are three times the unadjusted P values. Brown BG et al. N Engl J Med 2001;345:1583
 is based on the mean changes per patient in the various categories of lesions. Data have not been adjusted for multiple comparisons; the results for the primary end point (top row) that were obtained with the Bonferroni–Dunn adjustment for multiple comparisons are given in the text. With Bonferroni’s adjustment, the P values for the comparisons between the active treatment groups and the placebo group are three times the unadjusted P values. Brown BG et al. N Engl J Med 2001;345:1583.")
63
Dose ranges and efficacy of
statins, ezetimibe, and bile acid sequestrants Runhua H et al. Endocrinol Metab Clin N Am 2009;38:79

64
Residual CVD Risk After Statin Therapy
In major statin trials, significant reductions in CHD events occur with statins compared with placebo. However, a substantial percentage of major CHD events still occurs in the statin-treated groups. AFCAPS/TexCAPS indicates Air Force/Texas Coronary Atherosclerosis Prevention Study; CARE, Cholesterol and Recurrent Events; CHD, coronary heart disease; CVD, cardiovascular disease; 4S, Scandinavian Simvastatin Survival Study; HPS, Heart Protection Study; LDL, low-density lipoprotein; LIPID, Long-Term Intervention with Pravastatin in Ischaemic Disease; WOSCOPS, West of Scotland Coronary Prevention Study. Alagona P. Am J Manag Care 2009;15:s65

65
Low HDL-C Is Associated With High CVD Risk
Even If LDL-C Levels Are Well-Controlled (TNT Study) In the TNT study, patients in the highest HDL-C quintile (≥55 mg/dL) had a lower risk for major CVD events than did patients in the lowest quintile (<37 mg/dL). The mean LDL-C level in this group of patients (n = 2661, receiving statin therapy for 3 months) was 56 mg/dL; mean TG level was 126 mg/dL.22 CVD indicates cardiovascular disease; HDL-C, high-density lipoprotein cholesterol; LDL-C, low-density lipoprotein cholesterol; TG, triglyceride; TNT, Treating to New Targets. aP = .03 for differences among HDL-C quintiles. Alagona P. Am J Manag Care 2009;15:s65
 In the TNT study, patients in the highest HDL-C quintile (≥55 mg/dL) had a lower risk. for major CVD events than did patients in the lowest quintile (<37 mg/dL). The mean. LDL-C level in this group of patients (n = 2661, receiving statin therapy for 3 months) was 56 mg/dL; mean TG level was 126 mg/dL.22. CVD indicates cardiovascular disease; HDL-C, high-density lipoprotein cholesterol; LDL-C, low-density lipoprotein cholesterol; TG, triglyceride; TNT, Treating to New. Targets. aP = .03 for differences among HDL-C quintiles. Alagona P. Am J Manag Care 2009;15:s65.")
66
Strategies for Reducing CHD Risk
In a comparison of different types of trials, the LDL-C–lowering plus HDL-C–raising drug trials showed the greatest beneficial effects, achieving an average clinical event relative risk reduction of 71.6%, an average NNT of 9.6, and an average NNT/year of AFCAPS/TexCAPS indicates Air Force/Texas Coronary Atherosclerosis Prevention Study; CARDS, Collaborative Atorvastatin Diabetes Study; CARE, Cholesterol and Recurrent Events; CCAIT, Canadian Coronary Atherosclerosis Intervention Trial; CHD, coronary heart disease; CLAS, Cholesterol-Lowering Atherosclerosis Study; FATS, Familial Atherosclerosis Treatment Study; 4S, Scandinavian Simvastatin Survival Study; HATS, HDL-Atherosclerosis Treatment Study; HDL-C, high-density lipoprotein cholesterol; IDEAL, Incremental Decrease in Clinical Endpoints Through Aggressive Lipid Lowering; LDL-C, low-density lipoprotein cholesterol; LIPID, Long-Term Intervention with Pravastatin in Ischaemic Disease; MAAS, Multicenter Anti-Atheroma Study; MARS, Monitored Atherosclerosis Regression Study; NNT, number needed to treat to prevent 1 clinical event; PLAC-I, Pravastatin Limitation of Atherosclerosis in the Coronary Arteries; PROVE-IT, Pravastatin or Atorvastatin Evaluation and Infection Therapy; REGRESS, Regression Growth Evaluation Statin Study; SCRIP, Study of Cardiovascular Risk Intervention by Pharmacists; TNT, Treating to New Targets; WOSCOPS, West of Scotland Coronary Prevention Study. Alagona P. Am J Manag Care 2009;15:s65

67
Efficacy of niacin ER/simvastatin combination therapy:
SEACOAST I Efficacy of niacin ER/simvastatin combination therapy: SEACOAST I. Niacin ER/simvastatin 1000-mg/20-mg and 2000-mg/20- mg combination therapies demonstrated significant, dose-related improvements in non–HDL-C, HDL-C, TG, and Lp(a) compared with simvastatin 20-mg monotherapy.34 ER indicates extended release; HDL-C, high-density lipoprotein cholesterol; LDL-C, low-density lipoprotein cholesterol; Lp(a), lipoprotein (a); SEACOAST, Safety and Efficacy of Fixed Dose Niacin ER and Simvastatin Combination Therapy; TG, triglyceride. aSimvastatin 20 mg at baseline. bP <.01 vs simvastatin 20 mg. cP <.001 vs simvastatin 20 mg. Alagona P. Am J Manag Care 2009;15:s65
 compared with. simvastatin 20-mg monotherapy.34. ER indicates extended release; HDL-C, high-density lipoprotein cholesterol; LDL-C, low-density lipoprotein cholesterol; Lp(a), lipoprotein. (a); SEACOAST, Safety and Efficacy of Fixed Dose Niacin ER and Simvastatin Combination Therapy; TG, triglyceride. aSimvastatin 20 mg at baseline. bP <.01 vs simvastatin 20 mg. cP <.001 vs simvastatin 20 mg. Alagona P. Am J Manag Care 2009;15:s65.")
68
Efficacy of niacin ER/simvastatin combination therapy:
SEACOAST II Efficacy of niacin ER/simvastatin combination therapy: SEACOAST II. Niacin ER/simvastatin 1000-mg/40-mg and 2000-mg/40-mg combination therapies were comparable to simvastatin 80-mg monotherapy in reduction of non–HDL-C. Both niacin ER/simv astatin 1000-mg/40-mg and 2000-mg/40-mg combination therapies resulted in significant, dose-related improvements in HDL-C, Lp(a), and TG compared with simvastatin 80-mg therapy.33 ER indicates extended release; HDL-C, high-density lipoprotein cholesterol; LDL-C, low-density lipoprotein cholesterol; Lp(a), lipoprotein (a); SEACOAST, Safety and Efficacy of Fixed Dose Niacin ER and Simvastatin Combination Therapy; TG, triglyceride. aSimvastatin 40 mg at baseline. bComparable to simvastatin 80 mg. cP <.001 vs simvastatin 80 mg. dP <.01 vs simvastatin 80 mg. Alagona P. Am J Manag Care 2009;15:s65
, and TG compared with simvastatin 80-mg therapy.33. ER indicates extended release; HDL-C, high-density lipoprotein cholesterol; LDL-C, low-density lipoprotein cholesterol; Lp(a), lipoprotein. (a); SEACOAST, Safety and Efficacy of Fixed Dose Niacin ER and Simvastatin Combination Therapy; TG, triglyceride. aSimvastatin 40 mg at baseline. bComparable to simvastatin 80 mg. cP <.001 vs simvastatin 80 mg. dP <.01 vs simvastatin 80 mg. Alagona P. Am J Manag Care 2009;15:s65.")
69
Fenofibric Acid and Rosuvastatin Combination Therapy in Patients With Mixed Dyslipidemia
Combination therapy with fenofibric acid and rosuvastatin resulted in a significantly greater reduction in LDL-C compared with fenofibric acid monotherapy. Combination therapy with fenofibric acid and rosuvastatin also resulted in significantly greater increases in HDL-C and reductions in TGs compared with rosuvastatin monotherapy.35 HDL-C indicates high-density lipoprotein cholesterol; LDL-C, low-density lipoprotein cholesterol; TG, triglyceride. aMixed dyslipidemia: LDL-C ≥130 mg/dL, TG ≥150 mg/dL, and HDL-C <40 mg/dL in men and <50 mg/dL in women. bP <.001 vs fenofibric acid. cP <.001 vs rosuvastatin 10 mg. Alagona P. Am J Manag Care 2009;15:s65

Presentazioni simili


 Guidelines May 2001 Ipercolesterolemie famigliari Ipercolesterolemie e rischio cardio vascolare globale.>")


 Area Prevenzione ANMCO>")
 sottoposto a CABG.>")
