Scaricare la presentazione
La presentazione è in caricamento. Aspetta per favore

1
Chart Patterns SIAT 08-11-2014 Relatore Silvio Bona Bona-silvio@tiscali.it

2
FIGURE D’INVERSIONE

3
Requisiti e caratteristiche delle formazioni d’inversione
Sia gia in atto un trend primario Rottura importante trendline Maggiore estensione temporale avrà la figura, più forte sarà il movimento dei prezzi Il volume ha maggior peso nella fase rialzista

4
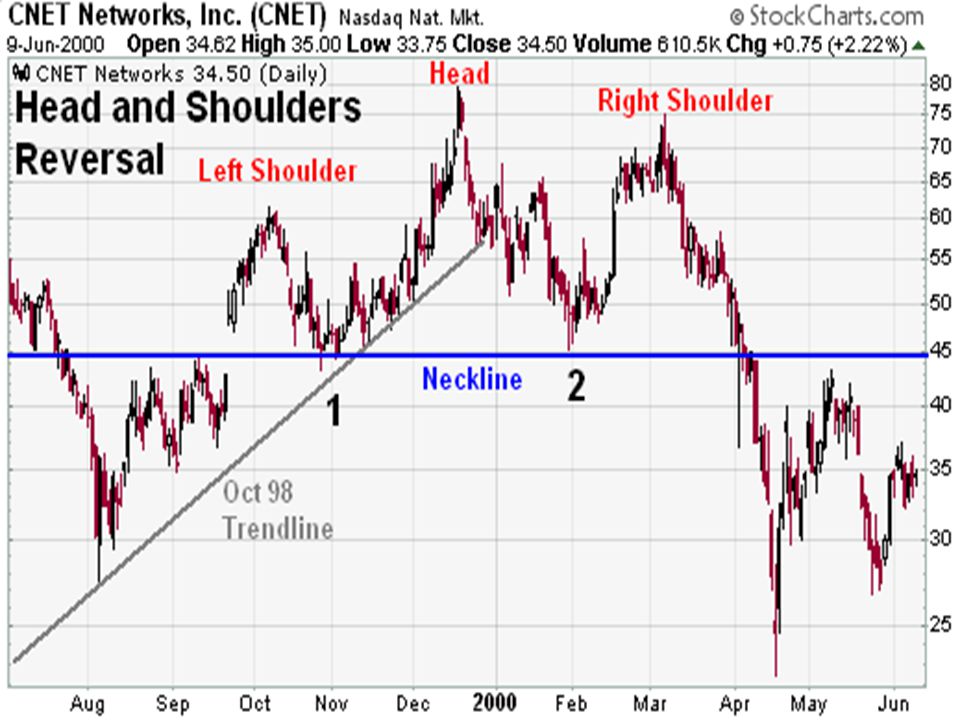
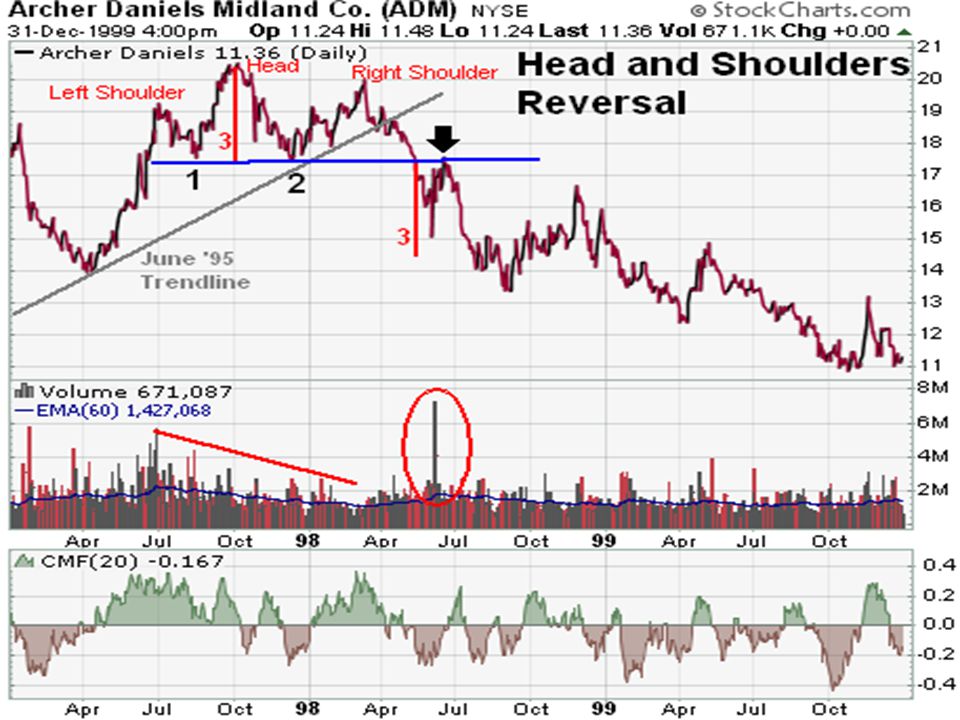
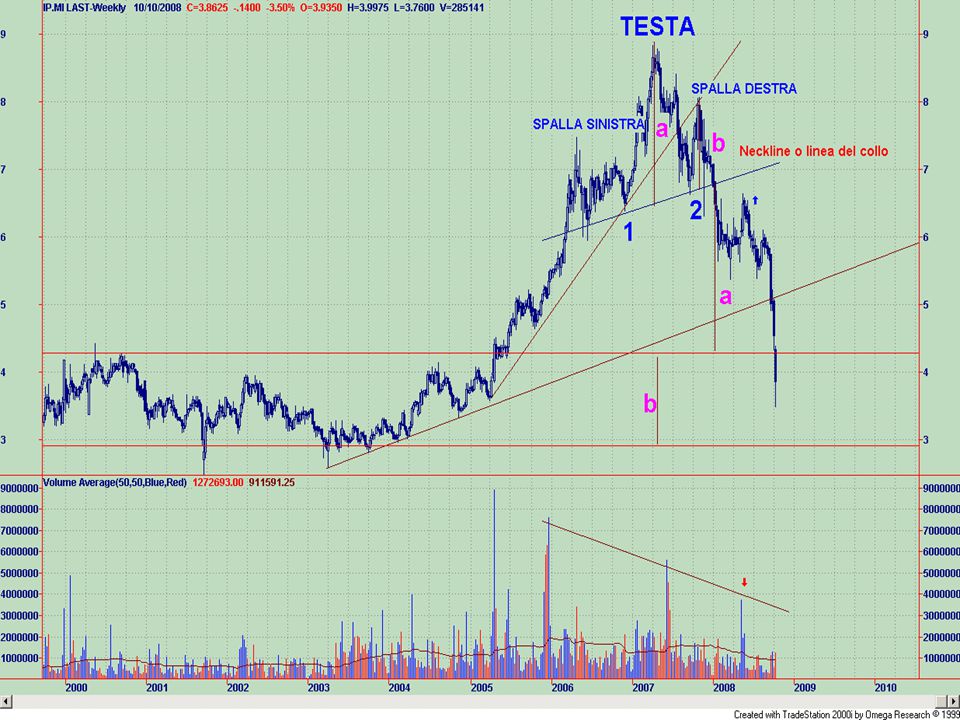
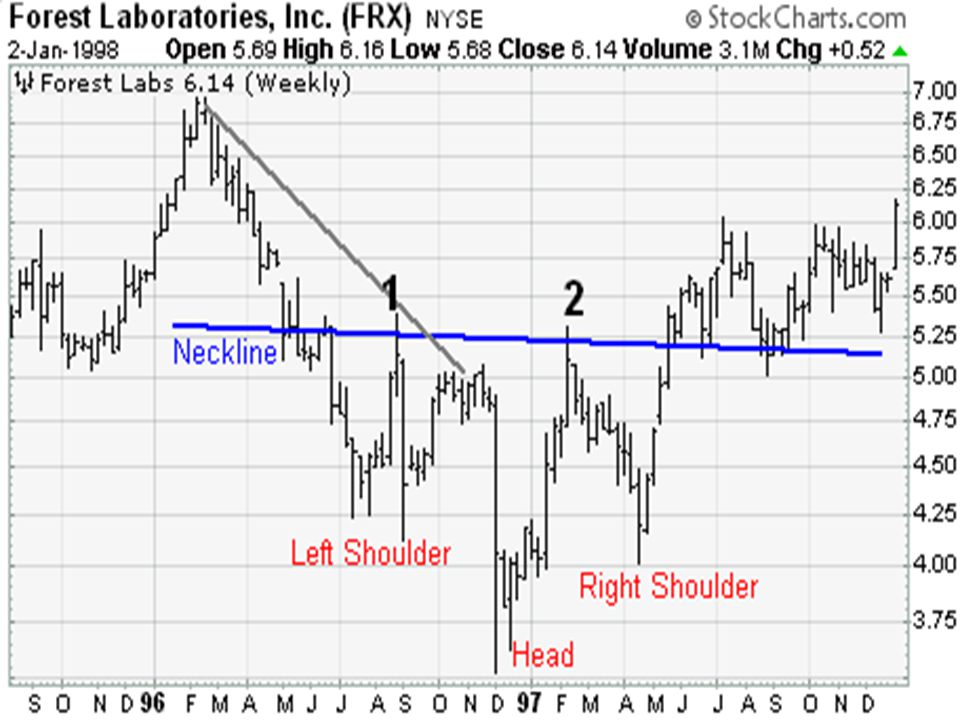
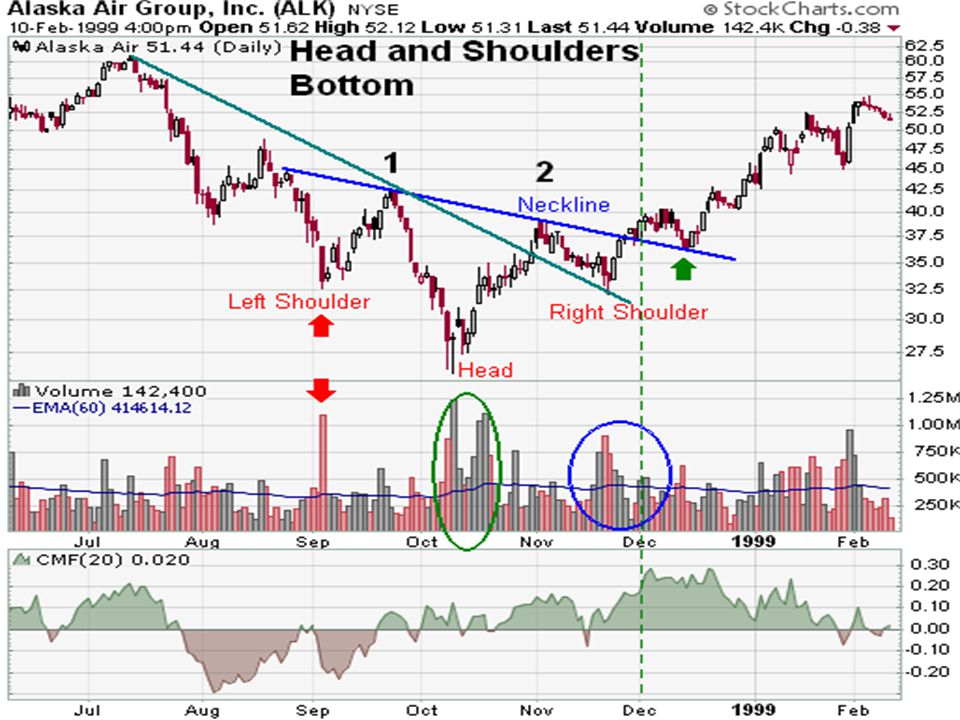
Head and shoulders “Testa e spalle”

7
As its name implies, the Head and Shoulders reversal pattern is made up of a left shoulder, a head, a right shoulder, and a neckline. Other parts playing a role in the pattern are volume, the breakout, price target and support turned resistance. We will look at each part individually, and then put them together with some examples. Prior Trend: It is important to establish the existence of a prior uptrend for this to be a reversal pattern. Without a prior uptrend to reverse, there cannot be a Head and Shoulders reversal pattern (or any reversal pattern for that matter). Left Shoulder: While in an uptrend, the left shoulder forms a peak that marks the high point of the current trend. After making this peak, a decline ensues to complete the formation of the shoulder (1). The low of the decline usually remains above the trend line, keeping the uptrend intact. Head: From the low of the left shoulder, an advance begins that exceeds the previous high and marks the top of the head. After peaking, the low of the subsequent decline marks the second point of the neckline (2). The low of the decline usually breaks the uptrend line, putting the uptrend in jeopardy. Right Shoulder: The advance from the low of the head forms the right shoulder. This peak is lower than the head (a lower high) and usually in line with the high of the left shoulder. While symmetry is preferred, sometimes the shoulders can be out of whack. The decline from the peak of the right shoulder should break the neckline. Neckline: The neckline forms by connecting low points 1 and 2. Low point 1 marks the end of the left shoulder and the beginning of the head. Low point 2 marks the end of the head and the beginning of the right shoulder. Depending on the relationship between the two low points, the neckline can slope up, slope down or be horizontal. The slope of the neckline will affect the pattern's degree of bearishness: a downward slope is more bearish than an upward slope. Sometimes more than one low point can be used to form the neckline. Volume: As the Head and Shoulders pattern unfolds, volume plays an important role in confirmation. Volume can be measured as an indicator (OBV, Chaikin Money Flow) or simply by analyzing volume levels. Ideally, but not always, volume during the advance of the left shoulder should be higher than during the advance of the head. This decrease in volume and the new high of the head, together, serve as a warning sign. The next warning sign comes when volume increases on the decline from the peak of the head. Final confirmation comes when volume further increases during the decline of the right shoulder. Neckline Break: The head and shoulders pattern is not complete and the uptrend is not reversed until neckline support is broken. Ideally, this should also occur in a convincing manner, with an expansion in volume. Support Turned Resistance: Once support is broken, it is common for this same support level to turn into resistance. Sometimes, but certainly not always, the price will return to the support break, and offer a second chance to sell. Price Target: After breaking neckline support, the projected price decline is found by measuring the distance from the neckline to the top of the head. This distance is then subtracted from the neckline to reach a price target. Any price target should serve as a rough guide, and other factors should be considered as well. These factors might include previous support levels, Fibonacci retracements, or long-term moving averages.
. Left Shoulder: While in an uptrend, the left shoulder forms a peak that marks the high point of the current trend. After making this peak, a decline ensues to complete the formation of the shoulder (1). The low of the decline usually remains above the trend line, keeping the uptrend intact. Head: From the low of the left shoulder, an advance begins that exceeds the previous high and marks the top of the head. After peaking, the low of the subsequent decline marks the second point of the neckline (2). The low of the decline usually breaks the uptrend line, putting the uptrend in jeopardy. Right Shoulder: The advance from the low of the head forms the right shoulder. This peak is lower than the head (a lower high) and usually in line with the high of the left shoulder. While symmetry is preferred, sometimes the shoulders can be out of whack. The decline from the peak of the right shoulder should break the neckline. Neckline: The neckline forms by connecting low points 1 and 2. Low point 1 marks the end of the left shoulder and the beginning of the head. Low point 2 marks the end of the head and the beginning of the right shoulder. Depending on the relationship between the two low points, the neckline can slope up, slope down or be horizontal. The slope of the neckline will affect the pattern s degree of bearishness: a downward slope is more bearish than an upward slope. Sometimes more than one low point can be used to form the neckline. Volume: As the Head and Shoulders pattern unfolds, volume plays an important role in confirmation. Volume can be measured as an indicator (OBV, Chaikin Money Flow) or simply by analyzing volume levels. Ideally, but not always, volume during the advance of the left shoulder should be higher than during the advance of the head. This decrease in volume and the new high of the head, together, serve as a warning sign. The next warning sign comes when volume increases on the decline from the peak of the head. Final confirmation comes when volume further increases during the decline of the right shoulder. Neckline Break: The head and shoulders pattern is not complete and the uptrend is not reversed until neckline support is broken. Ideally, this should also occur in a convincing manner, with an expansion in volume. Support Turned Resistance: Once support is broken, it is common for this same support level to turn into resistance. Sometimes, but certainly not always, the price will return to the support break, and offer a second chance to sell. Price Target: After breaking neckline support, the projected price decline is found by measuring the distance from the neckline to the top of the head. This distance is then subtracted from the neckline to reach a price target. Any price target should serve as a rough guide, and other factors should be considered as well. These factors might include previous support levels, Fibonacci retracements, or long-term moving averages.")
13
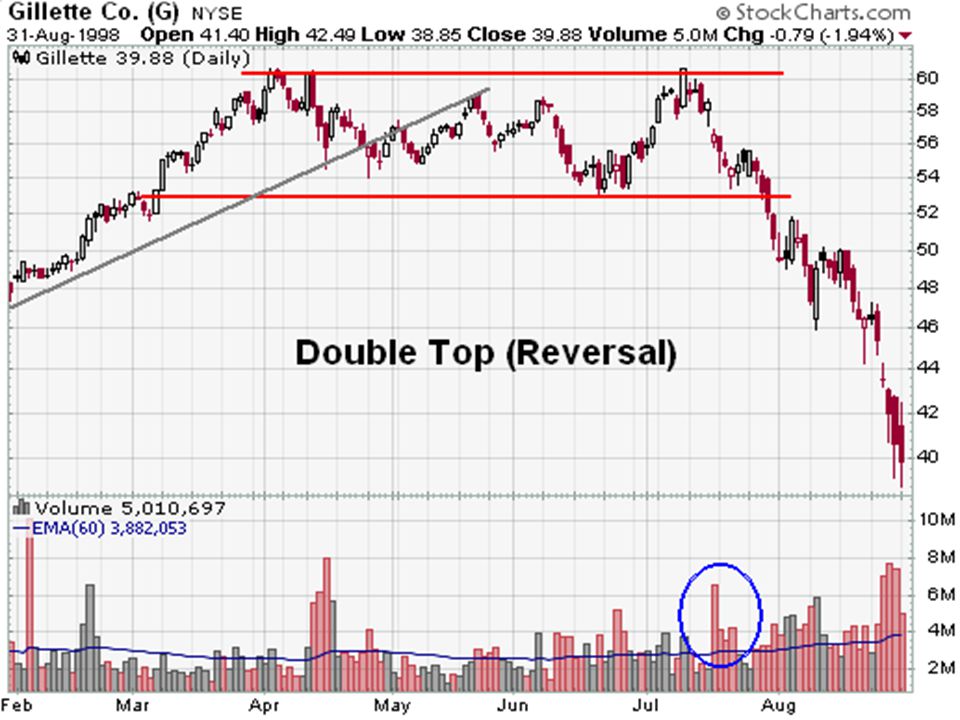
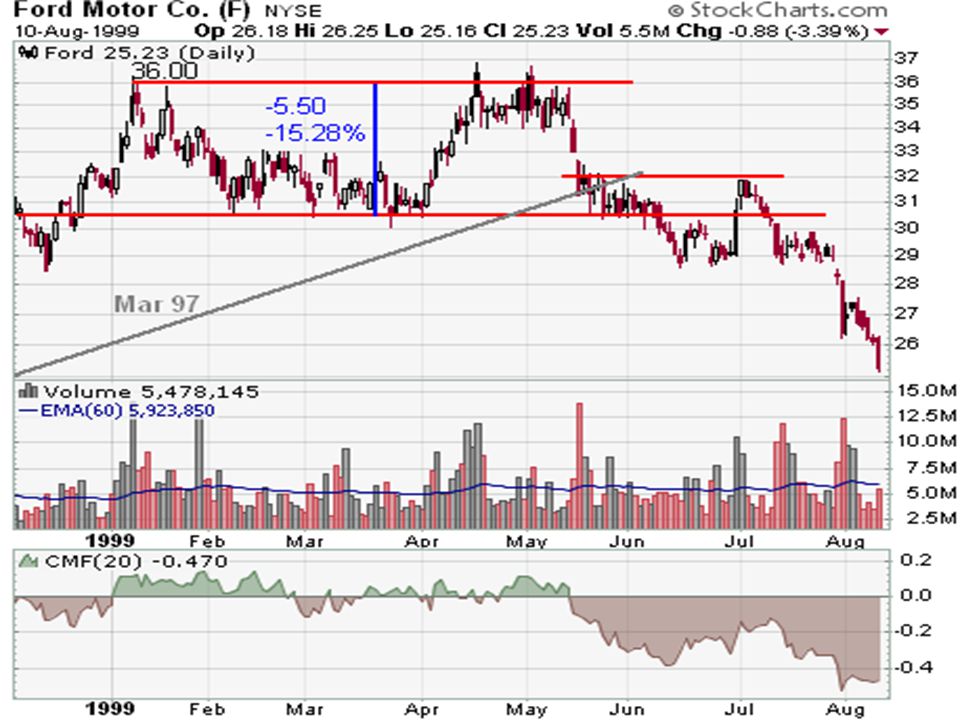
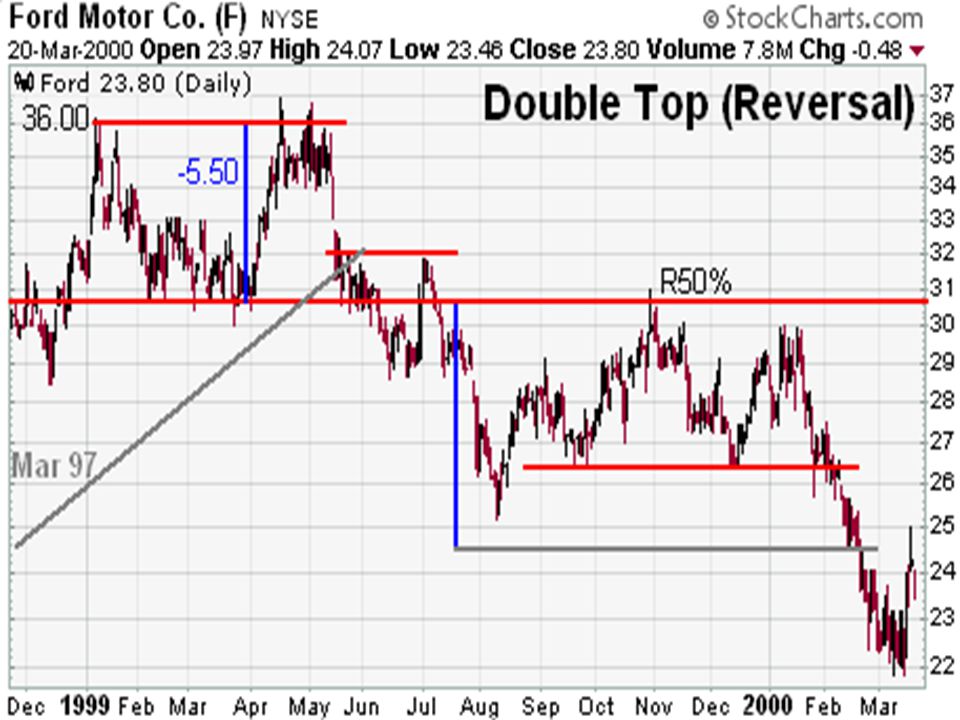
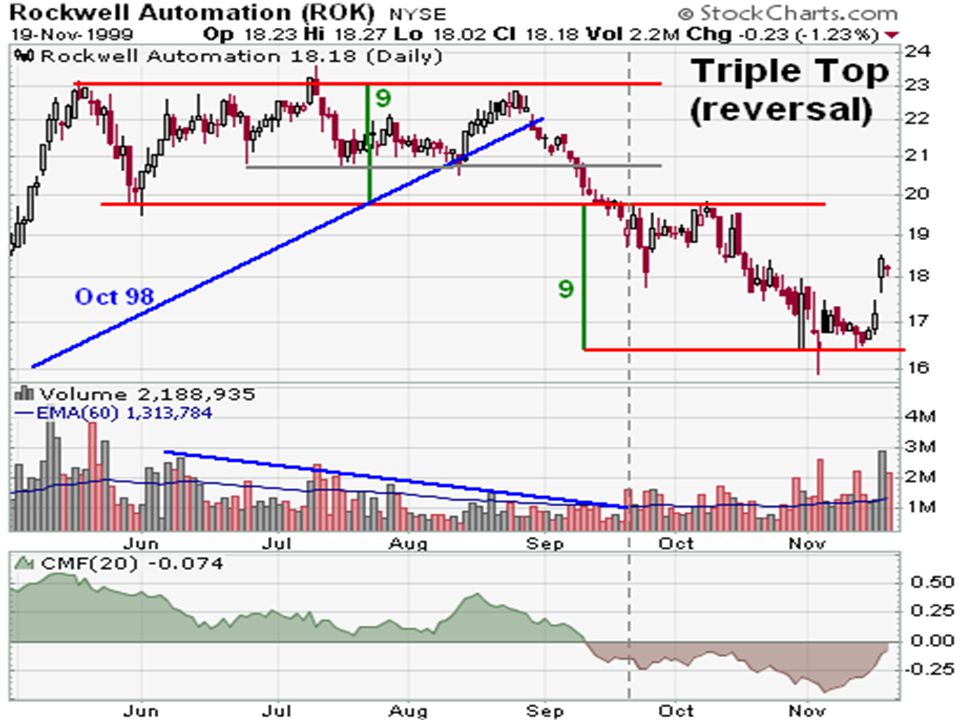
Doppi, tripli massimi e minimi

14
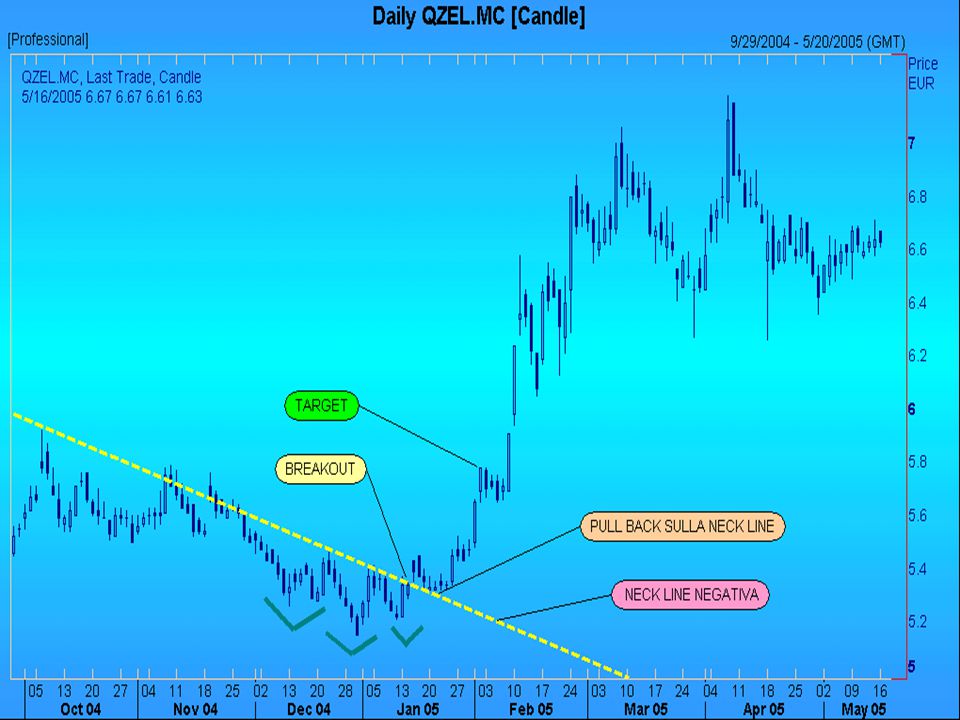
Anche se ci possono essere variazioni, il classico doppio massimo dei voti di almeno un cambiamento intermedi, se non a lungo termine un cambiamento, di tendenza da rialzista a ribassista. Molti potenziali DOPPI MASSIMI si possono formare lungo il percorso, ma fino a quando il supporto chiave non è rotto, un ripristino di valore non può essere confermata. Per contribuire a chiarire, prenderemo in considerazione i punti chiave nella formazione e poi un esempio. Prima Trend: Con qualsiasi modello di inversione, ci deve essere una tendenza esistente per invertire. Nel caso del doppio massimo, una significativa tendenza rialzista di alcuni mesi dovrebbe essere a posto. Prima di picco: il primo picco dovrebbe segnare il punto più alto del trend attuale. In quanto tale, il primo picco è abbastanza normale e il trend non è in pericolo (o in questione) in questo momento. Attraverso: Dopo il primo picco, con un calo avviene che va di solito dal 10 al 20%. Volume in declino dal primo picco è di solito irrilevante. La bassi sono a volte arrotondati o tirato un po ', che può essere un segno della domanda tiepida. Secondo picco: L'anticipo al largo della bassi si verifica in genere con volume in contarzione e incontra resistenza da parte degli alti precedente. Resistenza da parte degli alti precedente ci si dovrebbe aspettare. Anche dopo incontrare resistenza, solo la possibilità di un doppio piano esiste. Il modello deve ancora essere confermata. Il periodo di tempo tra i picchi può variare da poche settimane a molti mesi, con la norma è 1-3 mesi. Mentre i picchi esatti sono da preferire, c'è qualche margine di manovra. Di solito un picco entro il 3% del precedente elevata è adeguato. Scendere dal picco: Il declino successive al secondo TOP dovrebbe espandere in termini di volume e / o con una discesa accelerata, a volte contrassegnati con un gap o due. Tale ribasso risulta che le forze della domanda sono più deboli di approvvigionamento e di untest al supporto è imminente. Break Supporto: Anche dopo il ribasso sul supporto e la foprmazione di un eventuale doppio minimo, l'inversione di tendenza non è ancora completa. SOLO LA VIOLAZIONE DEL supporto OFFERTO dal punto più basso tra i picchi SI completa il doppio massimo. Anche questo dovrebbe avvenire con un aumento in volume e / o una discesa accelerata. Resistenza Supporto PULL BACK: IL SUPPORTO diventa, UNA VOLTA ROTTO potenziale resistenza e non vi è talvolta un test di questo livello di resistenza ritrovata con un RALLY DI reazione. Tale test in grado di offrire una seconda possibilità per uscire da una posizione o di avviare UN RIBASSO. Prezzo indicativo: La distanza dalla rottura di supporto a picco può essere dedotta dal supporto per l'interruzione di un obiettivo di prezzo. Ciò dedurre che il più grande è la formazione è, maggiore è il potenziale declino. Mentre la formazione di doppio in alto, può sembrare semplice, i tecnici dovrebbero adottare misure per evitare la corretta ingannevoli cime doppio. Le cime devono essere separati da circa un mese. Se le cime sono troppo vicini, potrebbero semplicemente rappresentare la resistenza normale, piuttosto che un cambiamento duraturo nella fornitura / foto domanda. Garantire che il basso tra le cime declina almeno il 10%. Cali meno del 10% non può essere indicativo di un aumento significativo della pressione alla vendita. Dopo il declino, analizzare il trogolo di indizi sulla forza della domanda. Se la depressione si trascina un po 'e ha difficoltà a muoversi il backup, la domanda potrebbe essere prosciugamento. Quando la sicurezza ha anticipato, cercare una contrazione in termini di volume, come un ulteriore segno di indebolimento della domanda. Forse l'aspetto più importante di un doppio piano è quello di evitare di saltare la pistola. Attendere per il sostegno devono essere ripartiti in modo convincente, e di solito con una espansione del volume. Un prezzo o di tempo del filtro può essere applicato a distinguere tra le interruzioni valido supporto e false. Un filtro prezzo potrebbe essere necessaria una pausa di sostegno 3%, prima della convalida. Un filtro di tempo potrebbe richiedere l'interruzione di sostegno a tenere per 3 giorni prima di considerare che valido. La tendenza è in vigore fino a prova contraria. Questo vale per il doppio piano pure. Fino a quando il supporto è rotto in modo convincente, la tendenza rimane alto

23
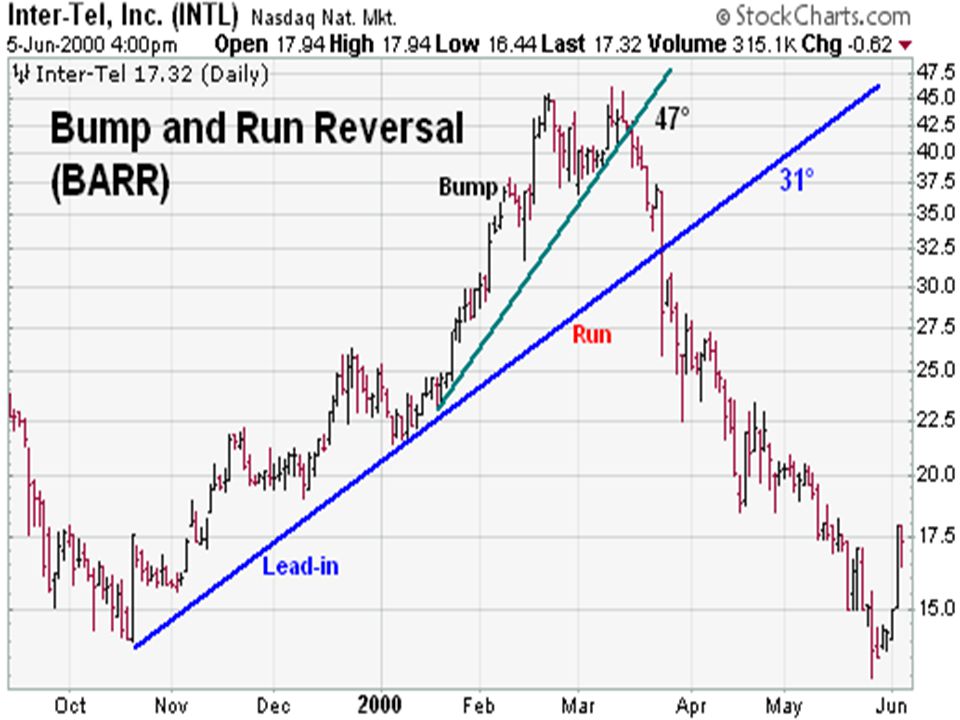
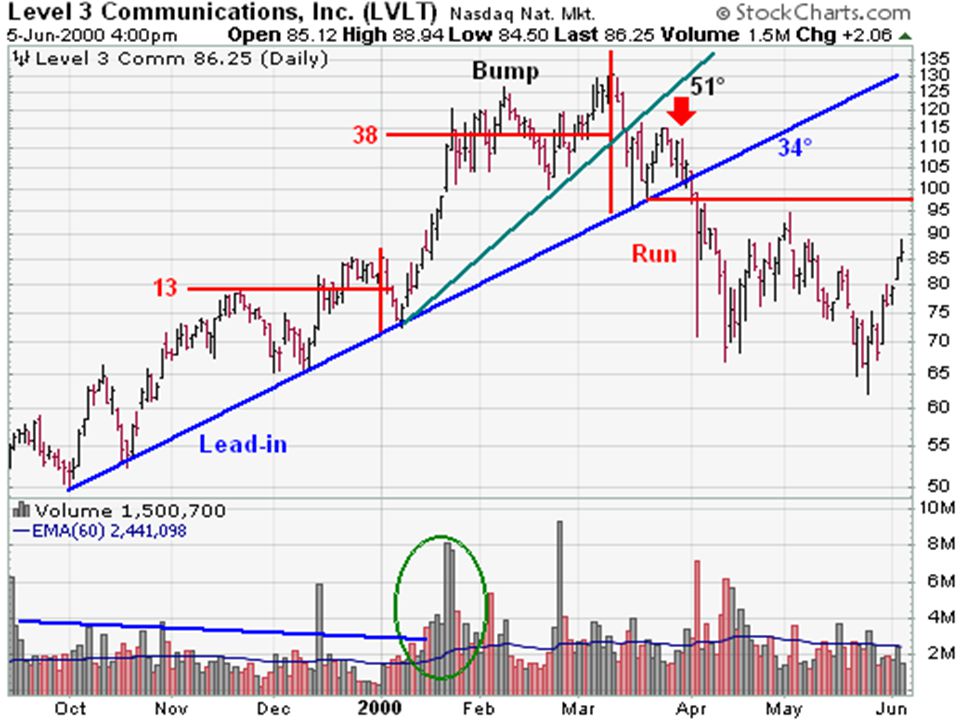
Bump and Run Reversal

26
Orecchiette di lupo

28
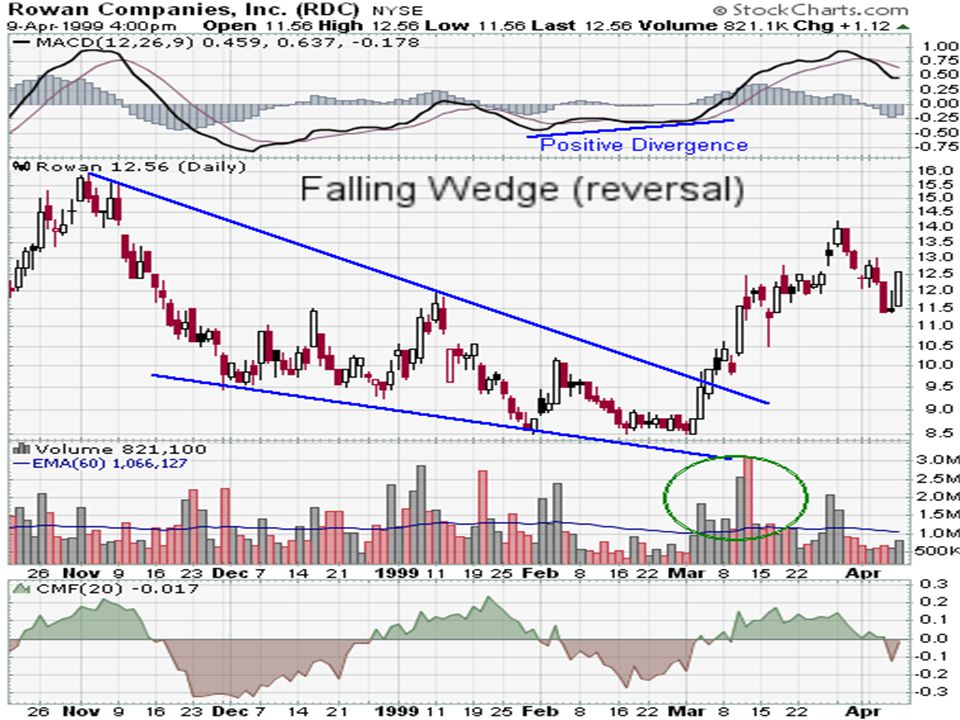
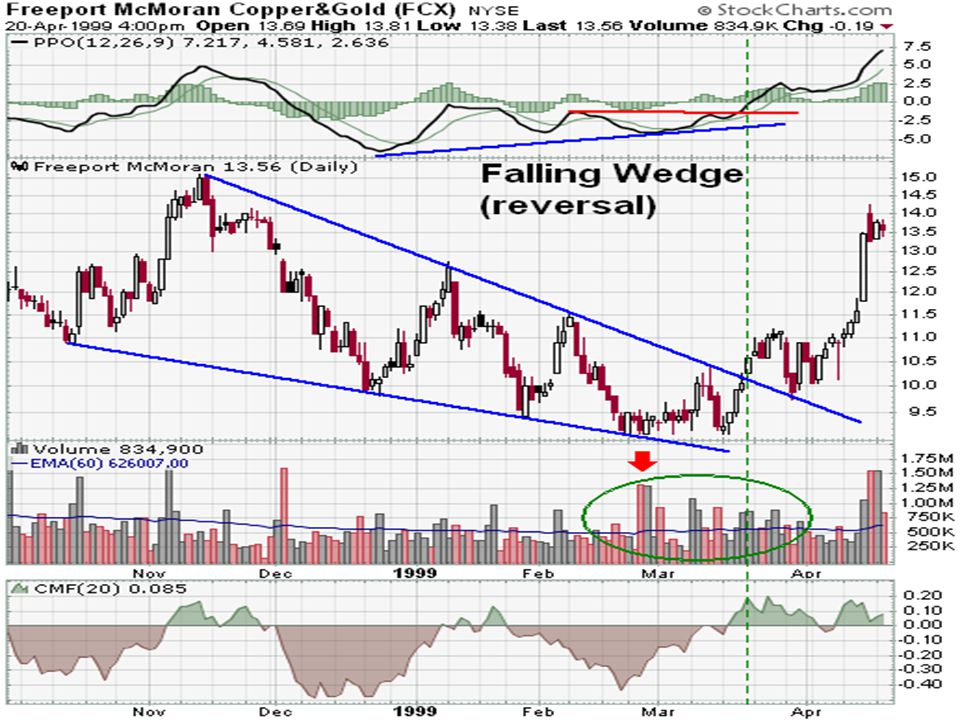
FALLING WEDGE

31
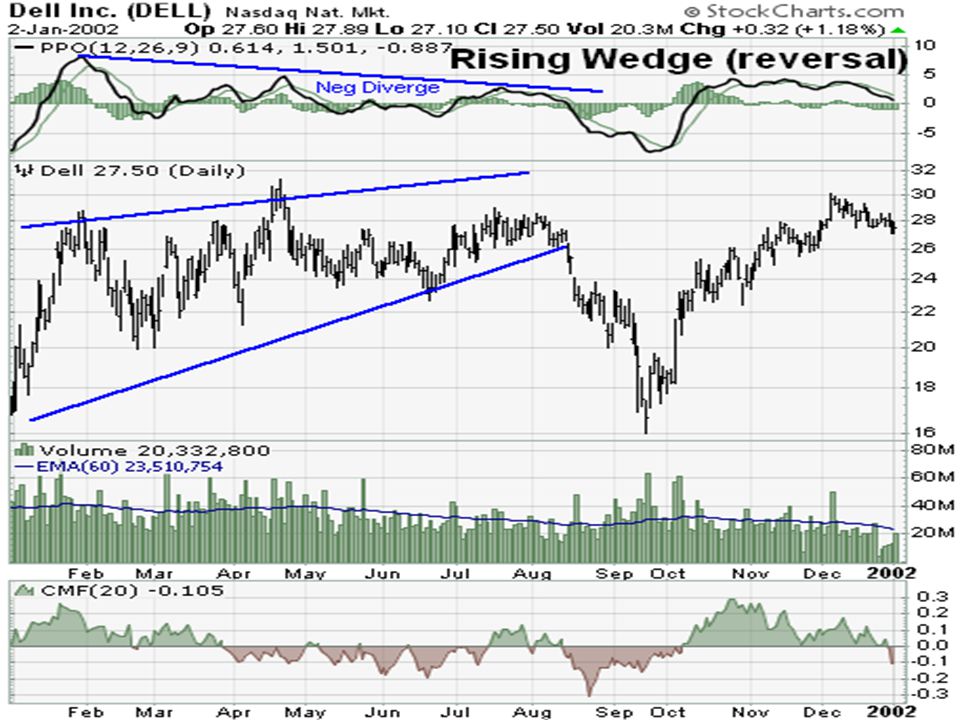
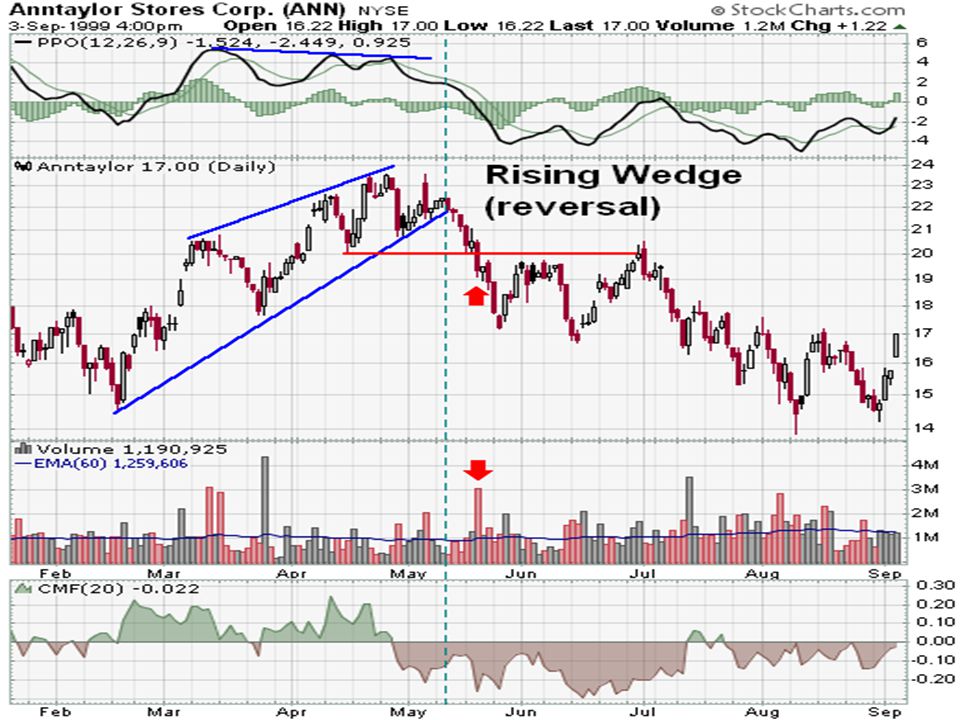
RISING WEDGE

34
BRODERING FORMATION O CUNEO IN ESPANSIONE

36
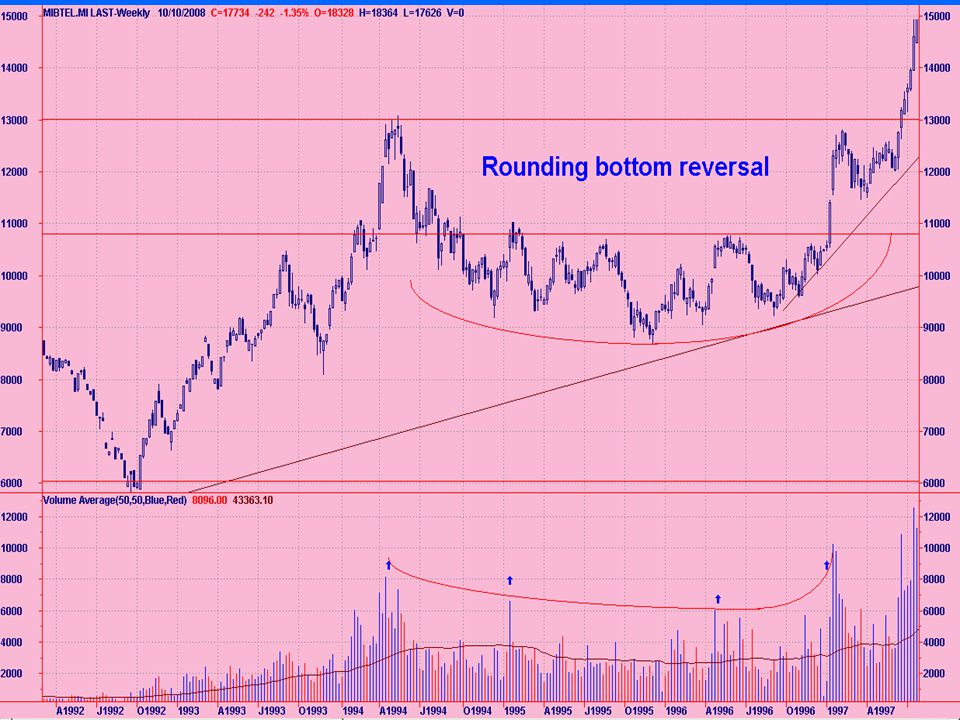
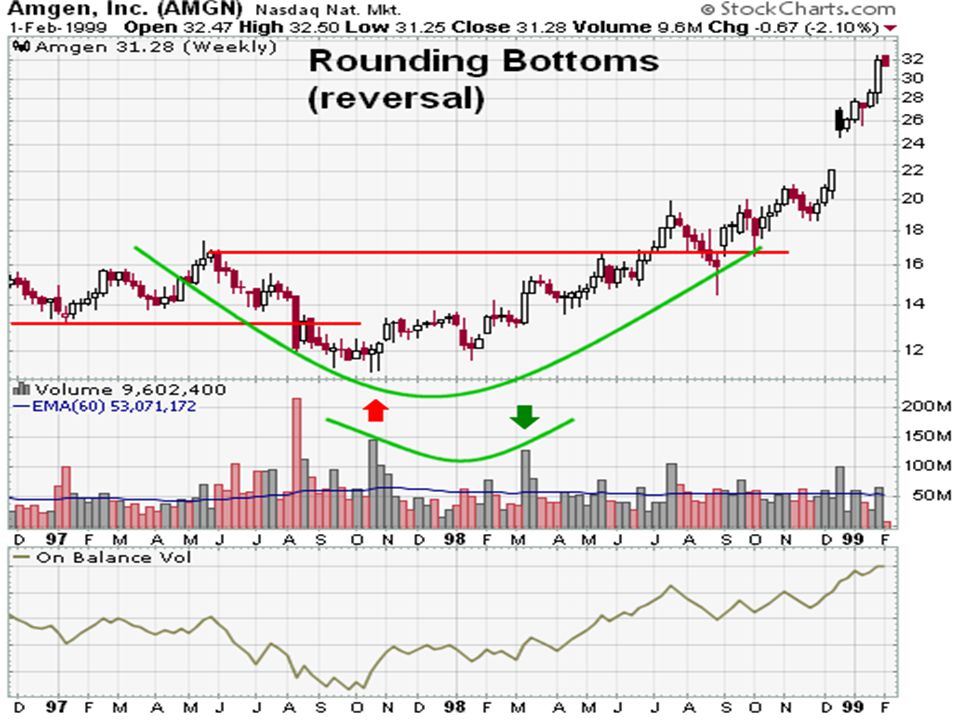
ROUNDING BOTTOM

39
ISLAND REVERSAL O ISOLA D’INVERSIONE

41
FIGURE DI CONTINUAZIONE

42
PRINCIPALI REQUISITI F. C.
Indicano una pausa del trend prevalente che è in essere e un conseguente movimento nella direzione precedente tali formazioni. Le figure di continuazione sono formate generalmente da movimenti di breve periodo

43
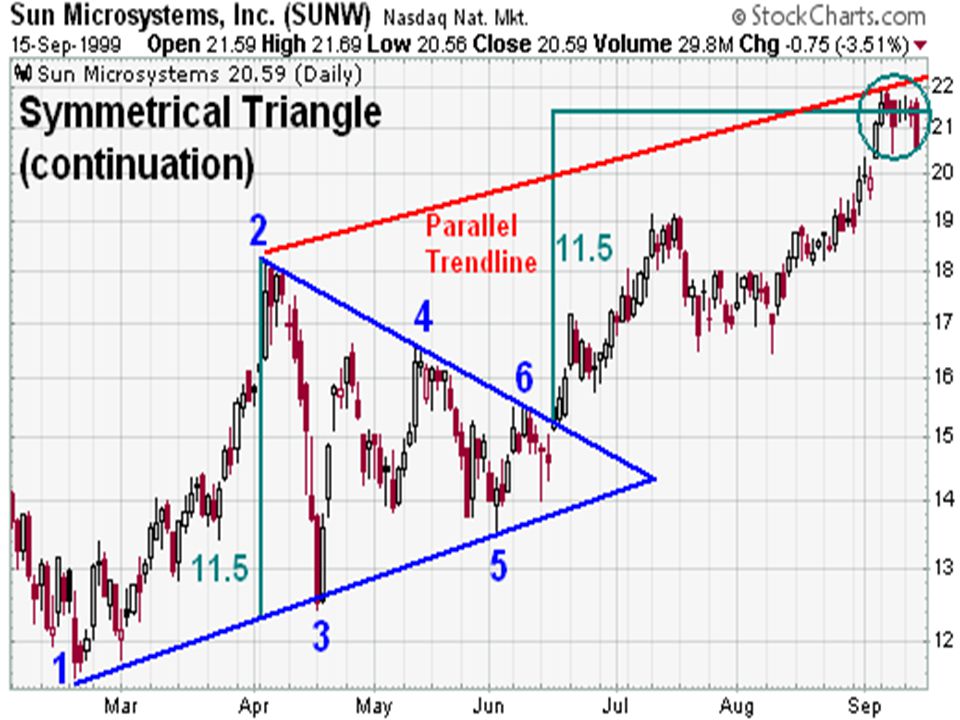
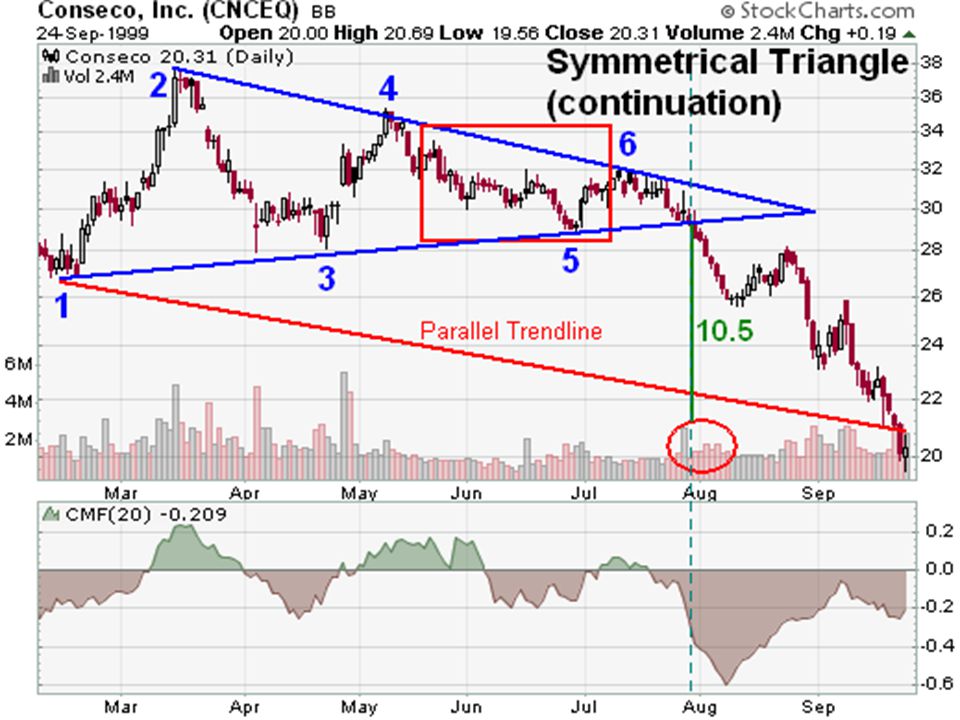
SYMMETRICAL TRIANGLE O CUNEO

46
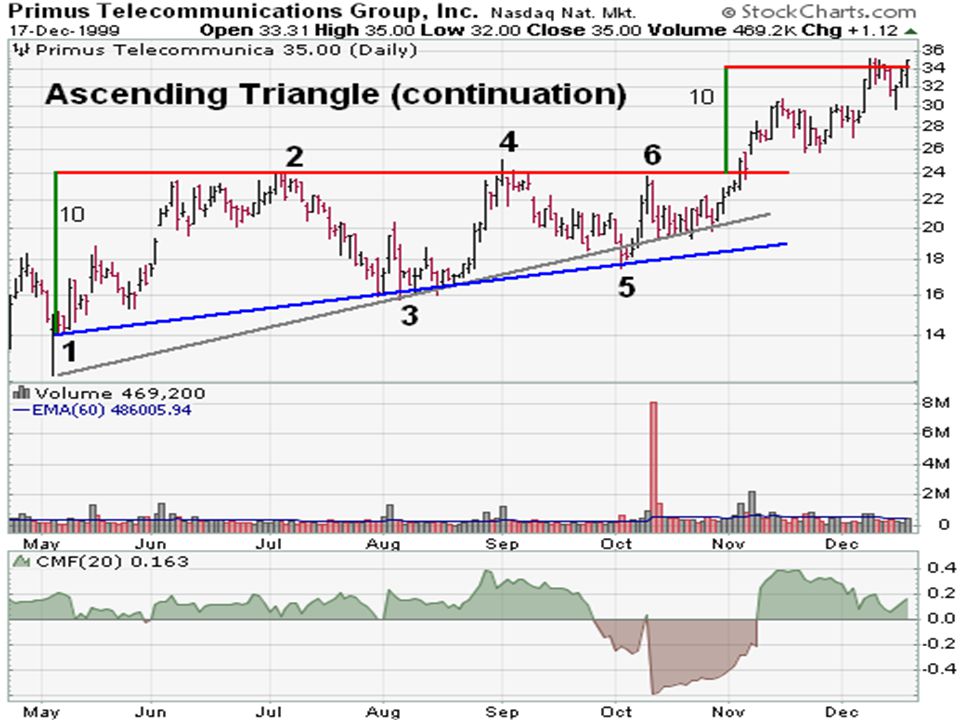
ASCENDING TRIANGLE

49
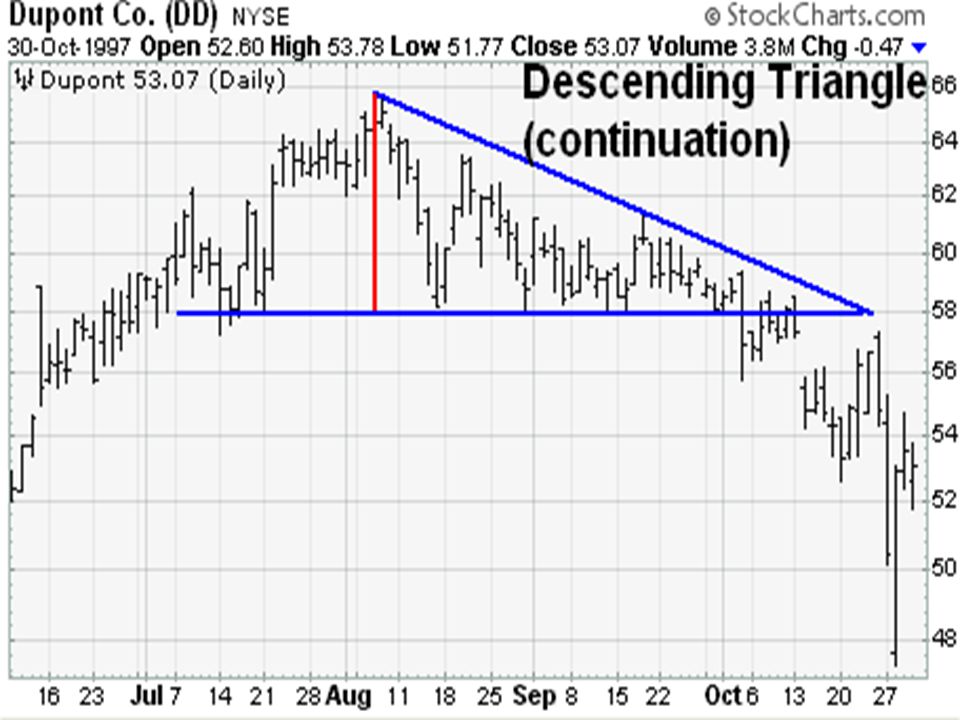
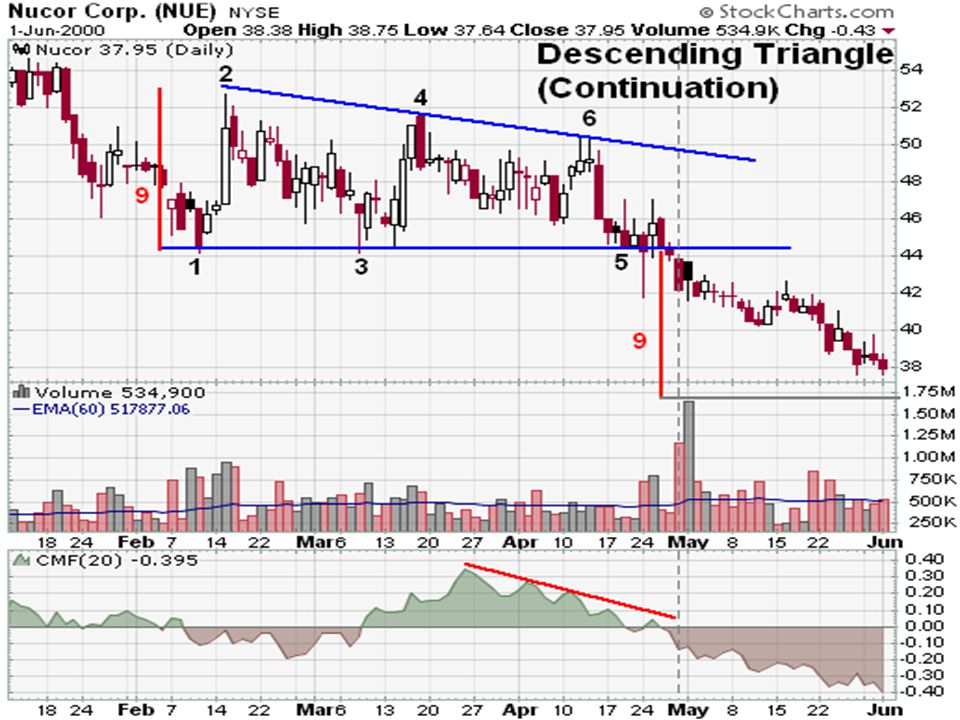
DESCENDING TRIANGLE ????

53
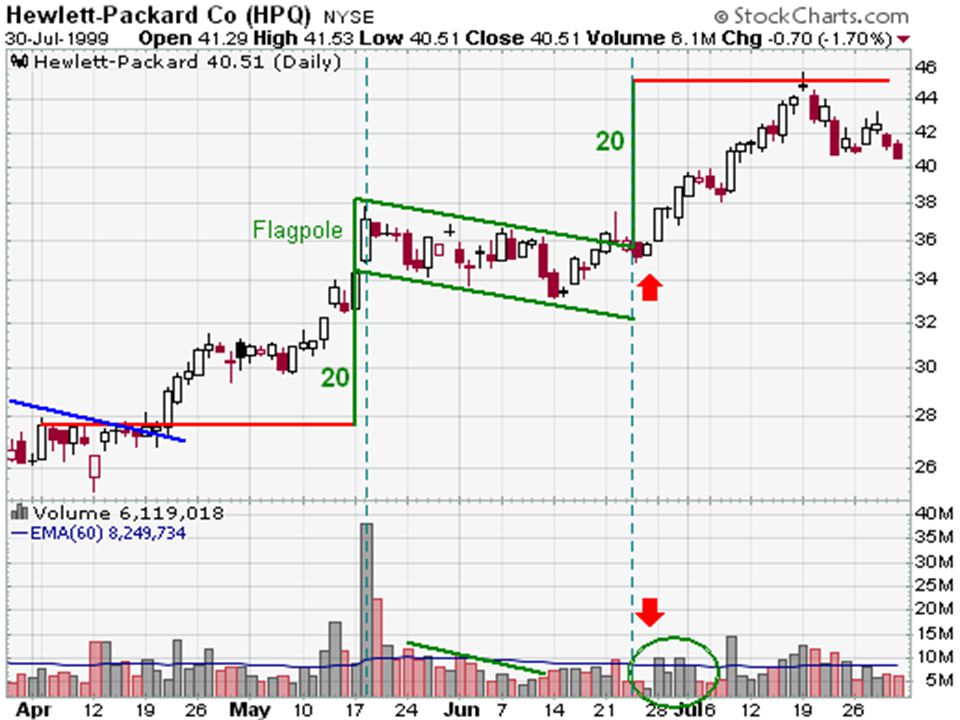
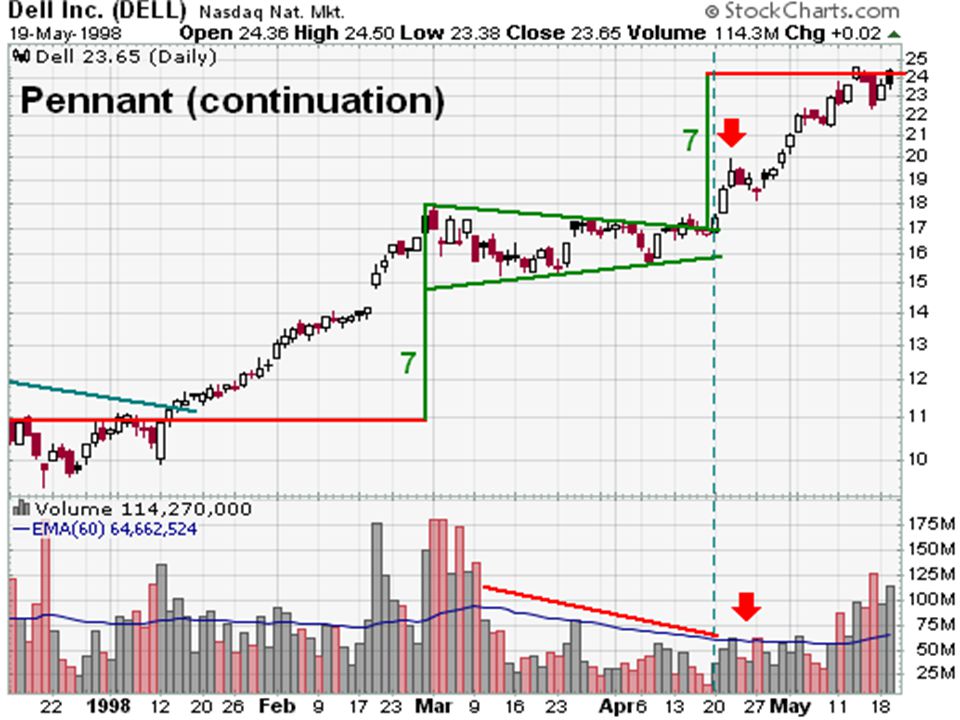
FLAG E PENNANT

56
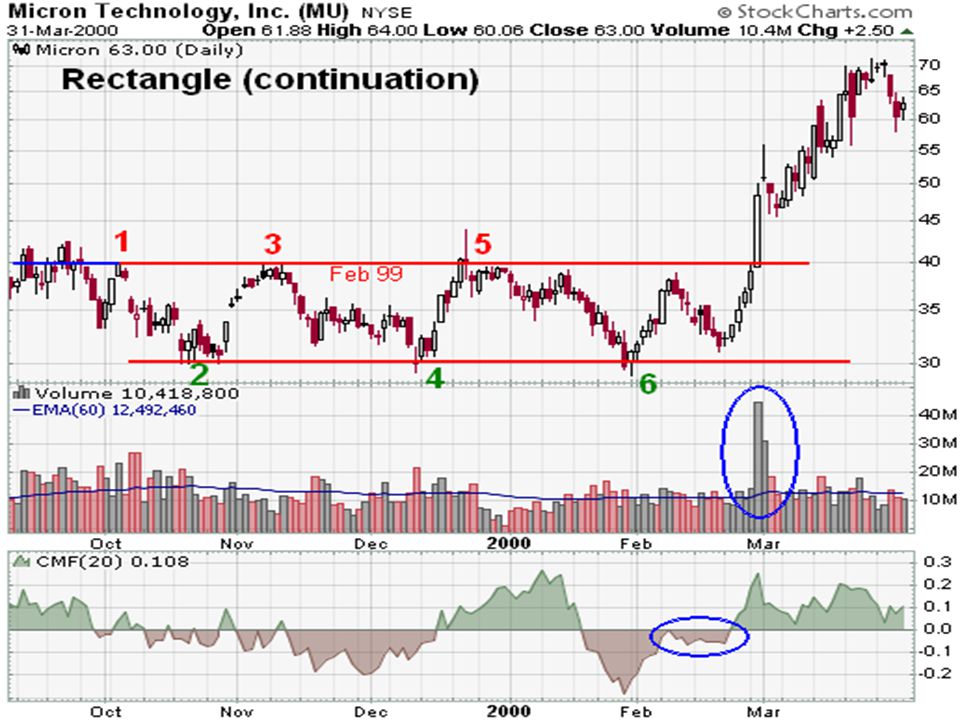
RECTANGLE

59
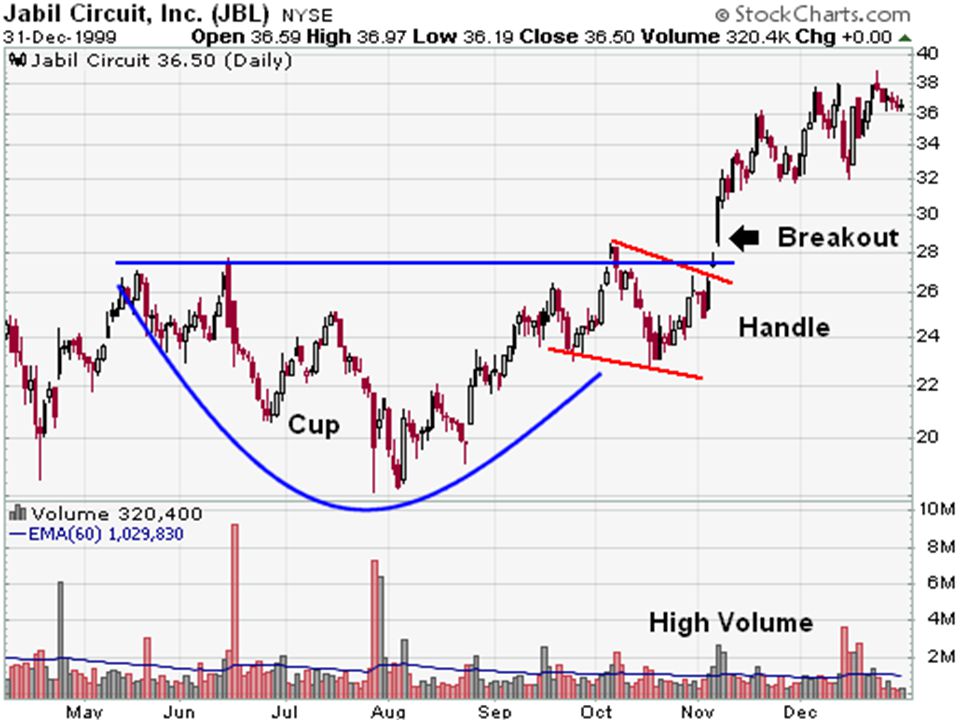
Cup with Handle

61
ESERCITAZIONI

63
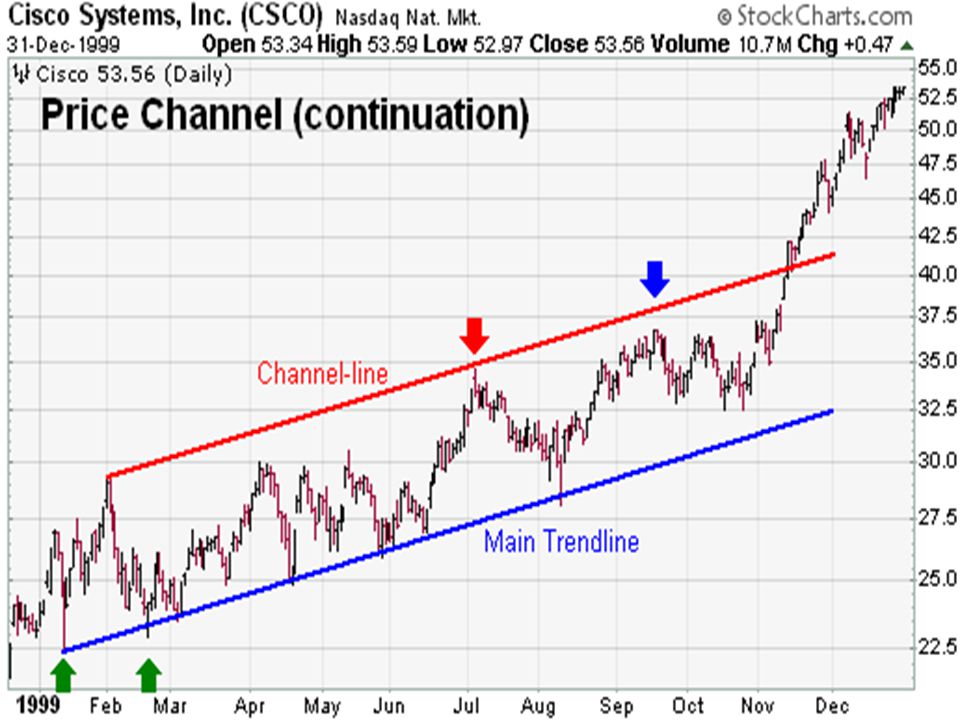
PRICE CHANNEL CONTINUATION

Presentazioni simili