Scaricare la presentazione
La presentazione è in caricamento. Aspetta per favore

1
Ipertensione arteriosa: percorsi diagnostico terapeutici condivisi

3
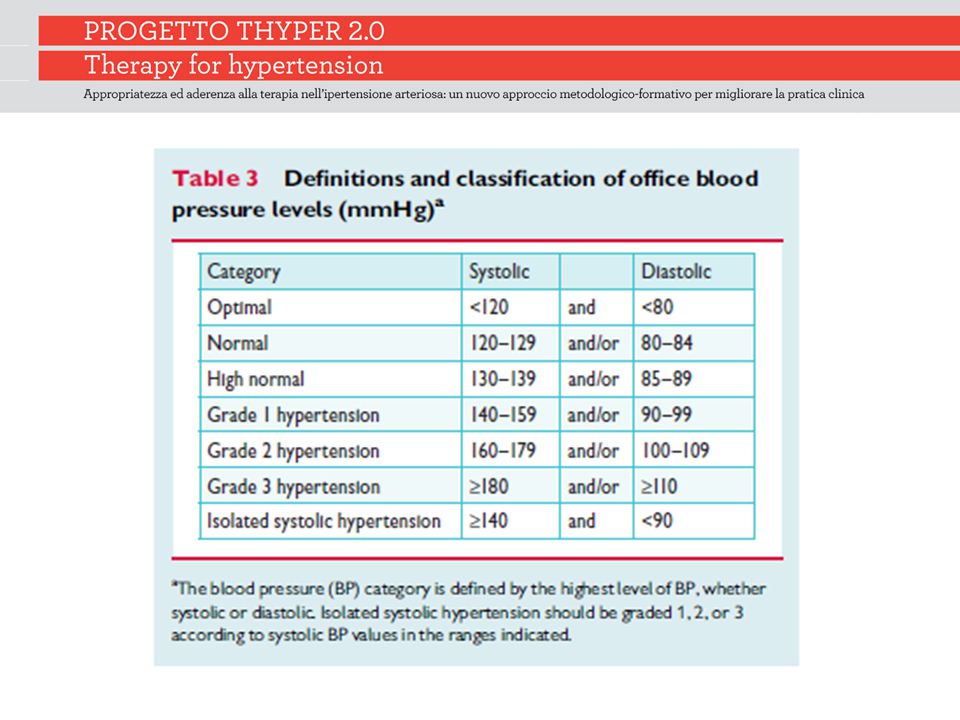
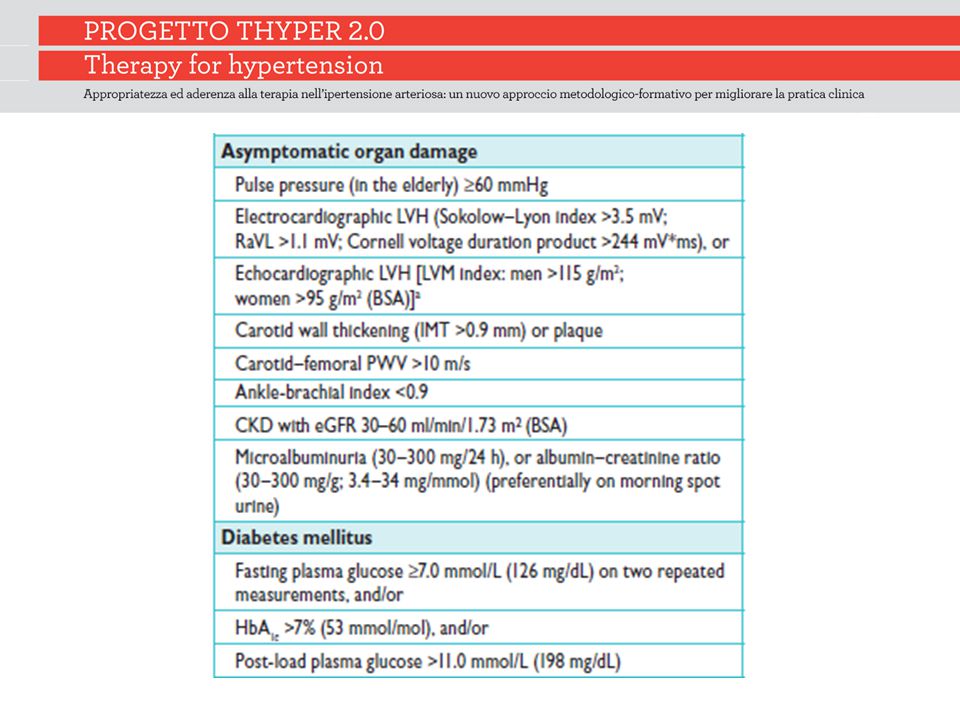
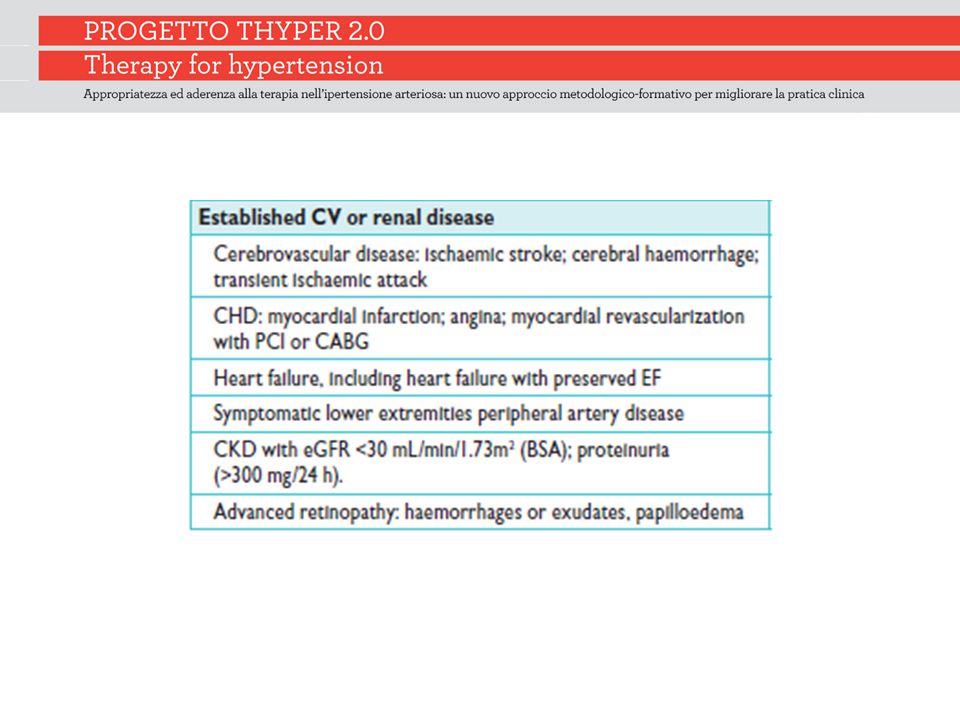
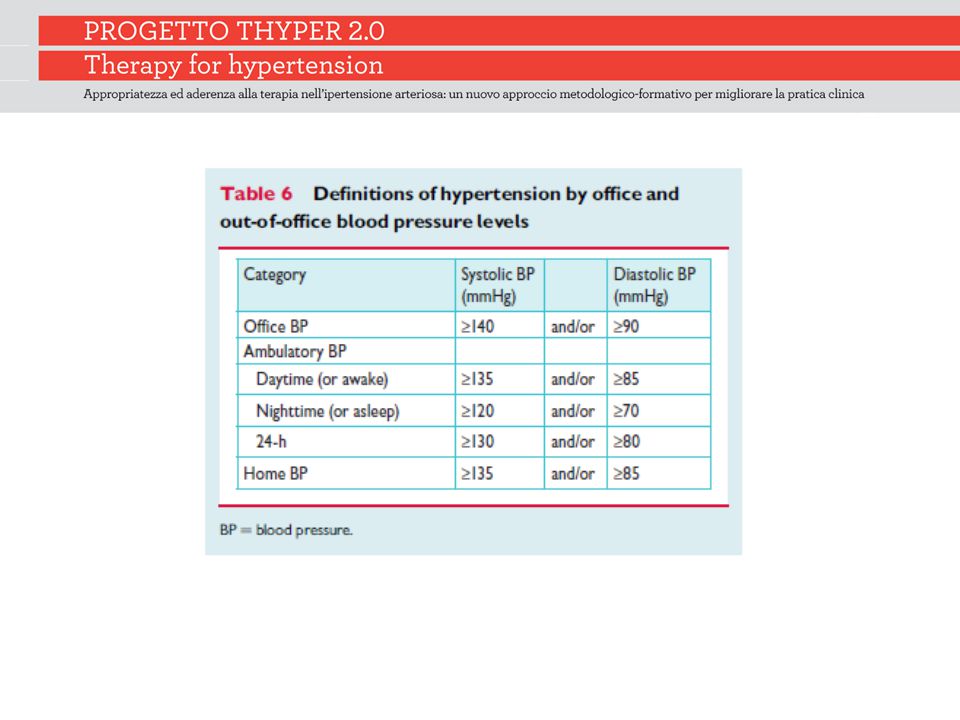
Definition and classification of hypertension

9
Obiettivo pressorio <140/85 mmHg diabetici <130/85 mmHg in nefropatici con franca proteinuria 80 anni <140/90 per tutti gli altri

10
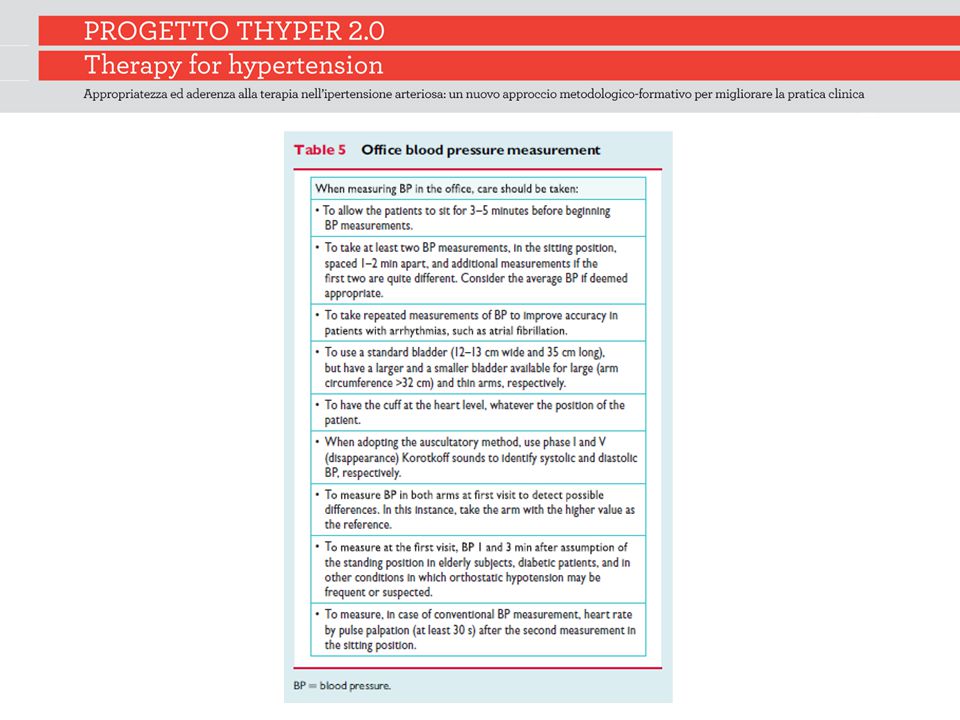
Blood pressure measurement

14
Dotazione minima a disposizione del MMG Apparecchio a mercurio o automatico «validato» Set di manicotti per pz obesi, normali, magri/bambini Possibilità di ottenere auto misurazione domiciliare con apparecchio automatico validato in caso di primo sospetto diagnostico, pz con ipertensione da camice bianco

15
Percorso diagnostico indispensabile esame clinico (in particolare: ricerca di danno d’organo) glicemia plasmatica a digiuno profilo lipidico uricemia, creatinemia, potassiemia analisi urine (stick urinario ed analisi del sedimento) creatinina clearance (formula Cockroft-Gault) o calcolo filtrato glomerulare (formula MDRD) emoglobina, ematocrito ECG
 glicemia plasmatica a digiuno profilo lipidico uricemia, creatinemia, potassiemia analisi urine (stick urinario ed analisi del sedimento) creatinina clearance (formula Cockroft-Gault) o calcolo filtrato glomerulare (formula MDRD) emoglobina, ematocrito ECG")
16
Periodicità nel follow-up Esame clinico (annuale) Creatininemia (e stima con formule del GFR) (annuale) Profilo lipidico (colesterolo totale, HDL, trigliceridi LDL calcolato) (annuale) ECG (biennale)
 Creatininemia (e stima con formule del GFR) (annuale) Profilo lipidico (colesterolo totale, HDL, trigliceridi LDL calcolato) (annuale) ECG (biennale)")
17
Treatment strategies

24
Gli indicatori di processo Gli indicatori di processo verranno utilizzati per monitorare la qualità dell’assitenza dei pazienti ipertesi CReG Si verificherà la registrazione e periodicità nelle estrazioni automatiche dei dati dalle cartelle cliniche riportati nella diapositiva successiva

25
INDICATORI DI PROCESSO Prevalenza dell’Ipertensione N° Pazienti con almeno una registrazione di pressione arteriosa negli ultimi 12 mesi N° Pazienti con ultimo valore registrato di pressione arteriosa negli ultimi 12 mesi ≤ 140/90 mmHg N° Pazienti con una registrazione di ECG negli ultimi 2 anni N° Pazienti con almeno una registrazione di creatinina (e stima del filtrato glomerulare) nell’ultimo anno N° Pazienti con almeno una registrazione di colesterolo LDL nell’ultimo anno N° Pazienti con colesterolo LDL registrato e <100 mg/dl
 nell’ultimo anno N° Pazienti con almeno una registrazione di colesterolo LDL nell’ultimo anno N° Pazienti con colesterolo LDL registrato e <100 mg/dl")
34
J Hypertens. 2003 Apr;21(4):797-804 Benefits and risks of more intensive blood pressure lowering in hypertensive patients of the HOT study with different risk profiles: does a J-shaped curve exist in smokers? Zanchetti A, Hansson L, Clement D, Elmfeldt D, Julius S, Rosenthal T, Waeber B, Wedel H; HOT Study Group Although subanalyses have only a descriptive value, it appears reasonable to recommend intensive antihypertensive treatment to hypertensives with diabetes, IHD and high global cardiovascular risk. In smokers, treatment intensification should be associated with the greatest efforts to induce smoking cessation.
: Benefits and risks of more intensive blood pressure lowering in hypertensive patients of the HOT study with different risk profiles: does a J-shaped curve exist in smokers. Zanchetti A, Hansson L, Clement D, Elmfeldt D, Julius S, Rosenthal T, Waeber B, Wedel H; HOT Study Group Although subanalyses have only a descriptive value, it appears reasonable to recommend intensive antihypertensive treatment to hypertensives with diabetes, IHD and high global cardiovascular risk. In smokers, treatment intensification should be associated with the greatest efforts to induce smoking cessation..")
35
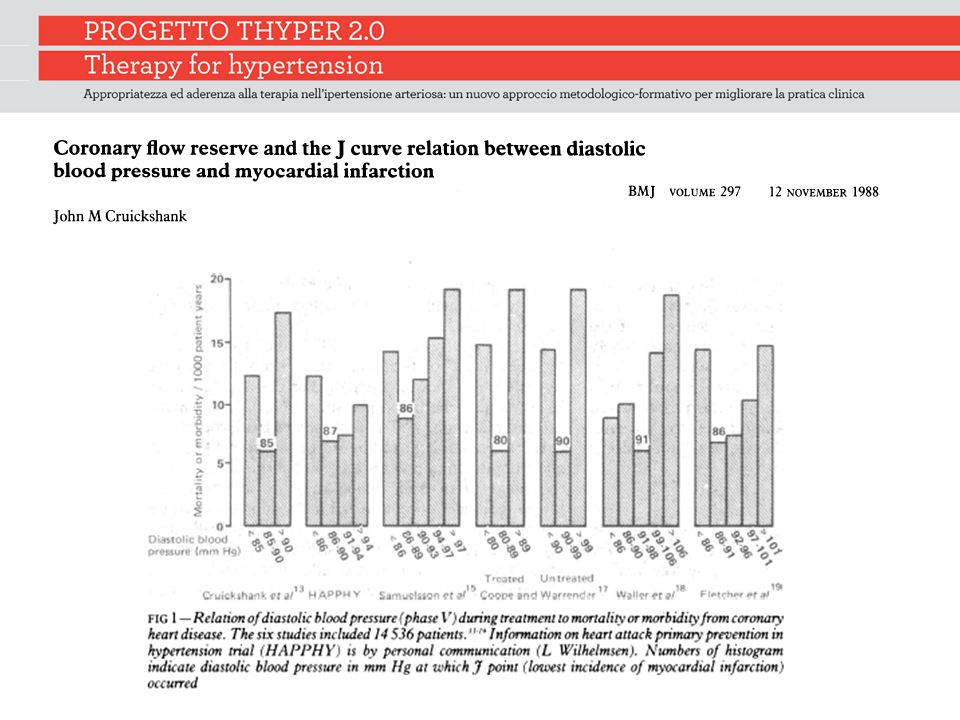
Curr Cardiol Rep. 2003 Nov;5(6):441-52 The J-curve in hypertension. Cruickshank J. The J-curve debate has continued for 25 years. Dependency upon observational and retrospective studies has confused the issue; only the full publication of data from the prospective, randomized Hypertension Optimal Treatment (HOT) study has thrown genuine light on the problem. Many examples of the J-curve relationship between blood pressure and cardiovascular/noncardiovascular events are due to reverse causality, where underlying disease (eg, poor left ventricular function, poor general health, poorly compliant/stiff arteries) is the cause of both the low blood pressure and the increased risk of both cardiovascular and noncardiovascular events
 study has thrown genuine light on the problem. Many examples of the J-curve relationship between blood pressure and cardiovascular/noncardiovascular events are due to reverse causality, where underlying disease (eg, poor left ventricular function, poor general health, poorly compliant/stiff arteries) is the cause of both the low blood pressure and the increased risk of both cardiovascular and noncardiovascular events.")
36
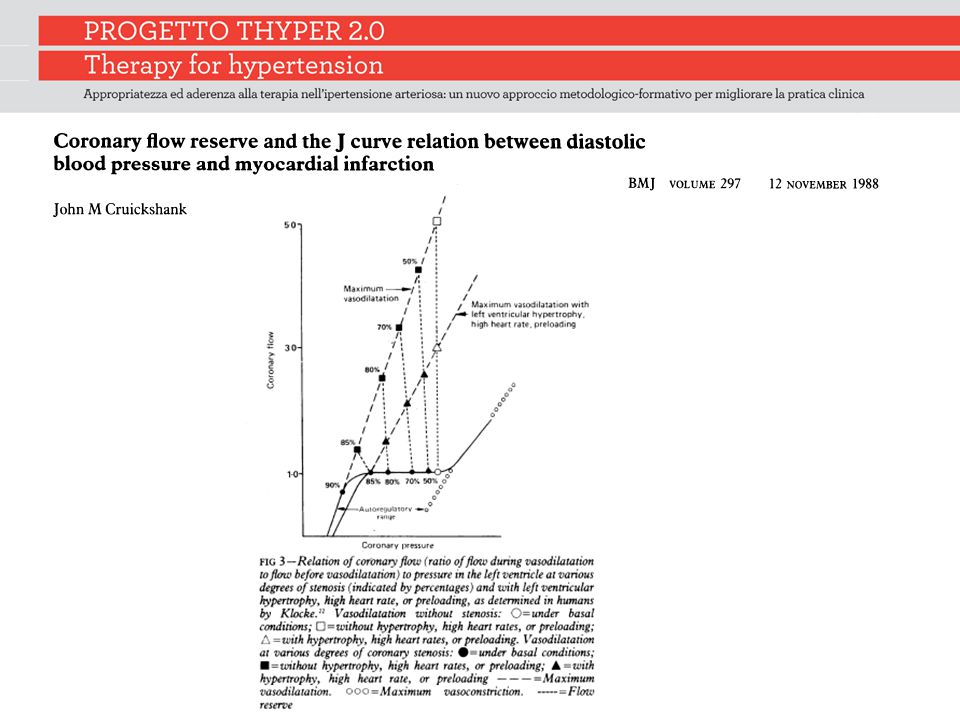
Curr Cardiol Rep. 2003 Nov;5(6):441-52. The J-curve in hypertension. Cruickshank J. The J-curve in patients with stiff arteries (wide pulse pressure) may be exacerbated by treatment. From the full publication of the HOT study database it is now reasonable to conclude that for nonischemic hypertensive subjects the therapeutic lowering of diastolic blood pressure (DBP) to the low 80s mm Hg is beneficial, but it is safe (though unproductive) to go lower. However, in the presence of coronary artery disease (limited coronary flow reserve) there is a J-curve relationship between treated DBP and myocardial infarction, but not for stroke. In such high-risk (for myocardial infarction) cases it would be prudent to avoid lowering DBP to below the low 80s mm Hg.
 may be exacerbated by treatment. From the full publication of the HOT study database it is now reasonable to conclude that for nonischemic hypertensive subjects the therapeutic lowering of diastolic blood pressure (DBP) to the low 80s mm Hg is beneficial, but it is safe (though unproductive) to go lower. However, in the presence of coronary artery disease (limited coronary flow reserve) there is a J-curve relationship between treated DBP and myocardial infarction, but not for stroke. In such high-risk (for myocardial infarction) cases it would be prudent to avoid lowering DBP to below the low 80s mm Hg..")
37
Ann Intern Med. 2006 Jun 20;144(12):884-93 Dogma disputed: can aggressively lowering blood pressure in hypertensive patients with coronary artery disease be dangerous? Messerli FH, Mancia G, Conti CR, Hewkin AC, Kupfer S, Champion A, Kolloch R, Benetos A, Pepine CJ.
: Dogma disputed: can aggressively lowering blood pressure in hypertensive patients with coronary artery disease be dangerous. Messerli FH, Mancia G, Conti CR, Hewkin AC, Kupfer S, Champion A, Kolloch R, Benetos A, Pepine CJ..")
38
The Incidence of the myocardial infarction and stroke as stratified by diastolic blood pressure in the International Verapamil SR-Trandolapril study Messerli FH, Mancia G, Conti CR, et al. Dogma disputed: can aggressively lowering blood pressure in hypertensive patients with coronary artery disease be dangerous? Ann Intern Med. 2006;144:884–893

39
Interaction of the J-Curve with coronary revascularization. The patients who were revascularized better tolerated a lower diastolic blood pressure (DBP) than those who were not Messerli FH, Mancia G, Conti CR, et al. Dogma disputed: can aggressively lowering blood pressure in hypertensive patients with coronary artery disease be dangerous? Ann Intern Med. 2006;144:884–893
 than those who were not Messerli FH, Mancia G, Conti CR, et al. Dogma disputed: can aggressively lowering blood pressure in hypertensive patients with coronary artery disease be dangerous. Ann Intern Med. 2006;144:884–893.")
50
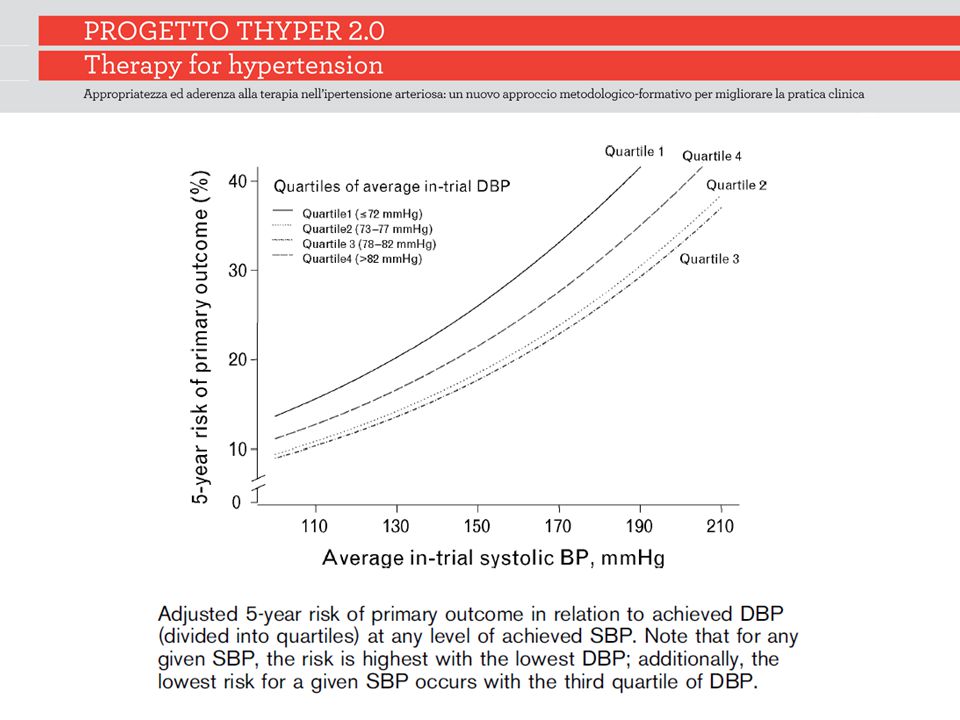
Results of the proportion of events in Action to Control Cardiovascular Risk in Diabetes-blood pressure (effects of intensive blood-pressure control in type 2 diabetes mellitus) (A) and the Adjusted risk of all-cause mortality in International Verapamil SR-Trandolapril (B) Cushman WC, Evans GW, Byington RP, et al. Effects of intensive blood-pressure control in type 2 diabetes mellitus. N Engl J Med. 2010;362:1575–1585

53
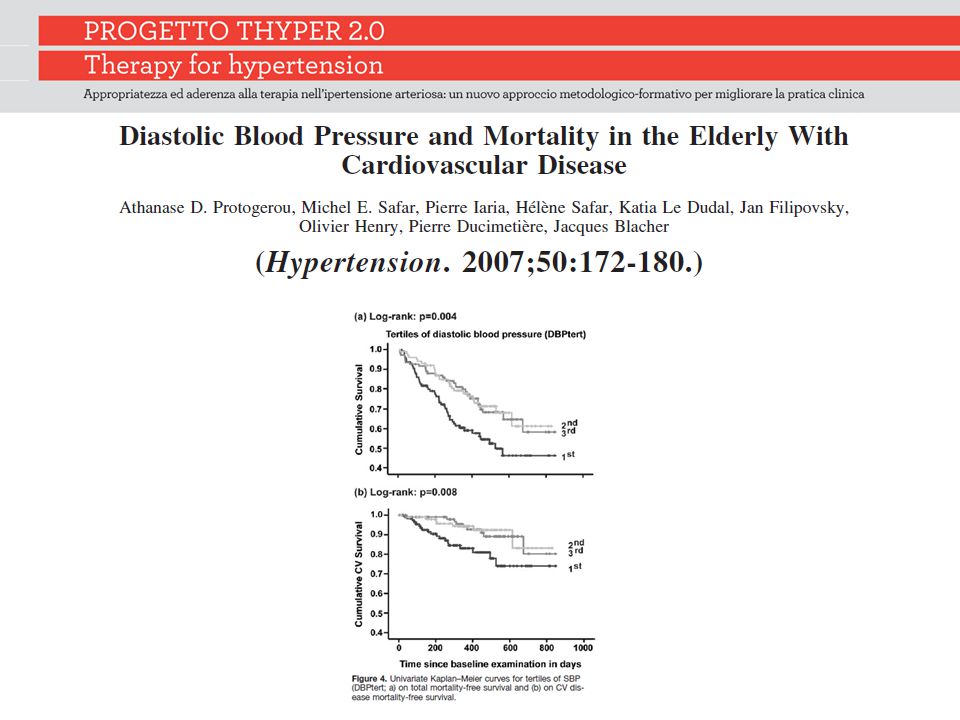
Considerations on the pathophysiology of the J Curve First, the J curve may be an epiphenomenon of more severe underlying chronic illness, which thereby increases mortality Second, low DBP could also be a marker of cardiac function. Indeed, the DBP–mortality relation could be considered as a direct main result of cardiac failure, and there was an age dependence regarding the effect of low DBP on mortality

54
Considerations on the pathophysiology of the J Curve Third, the J curve may represent an epiphenomenon of increased arterial stiffness, a well-known independent marker of advance vascular disease and of increased mortality, leading to high PP and low DBP Fourth, low DBP compromise coronary perfusion during the diastolic phase of the cardiac cycle, especially in subjects with coronary heart disease

55
The J-shaped curve: fact or fiction? In a 1987 study, Cruickshank argued that the J-shaped curve was more apparent in ischaemic heart disease In the INVEST study, Messerli found that a diastolic blood pressure lower than 70 mmHg was associated with an increased risk of myocardial infarction, an interesting but far-from-definitive finding.

56
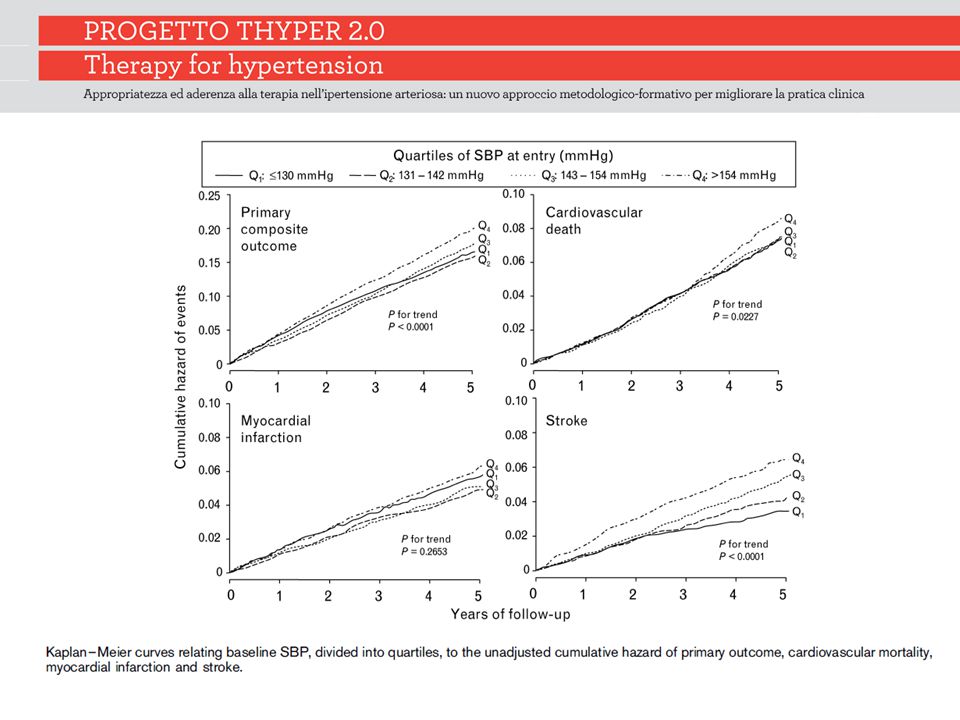
The J-shaped curve: fact or fiction? Sleight’s analysis of the ONTARGET trial showed that while higher blood pressure was associated with a linearly higher stroke risk, when it came to composite outcomes (including myocardial infarction and cardiovascular mortality), there was virtual equivalence between those with the highest and lowest blood pressures, seemingly supporting the idea of the J-shaped curve
, there was virtual equivalence between those with the highest and lowest blood pressures, seemingly supporting the idea of the J-shaped curve.")
59
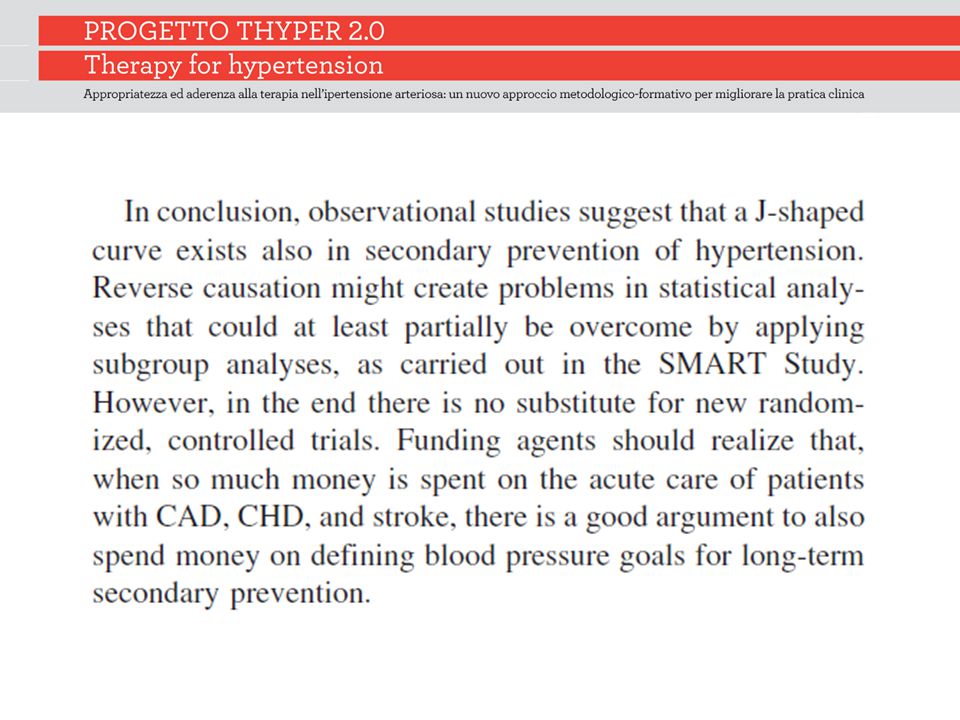
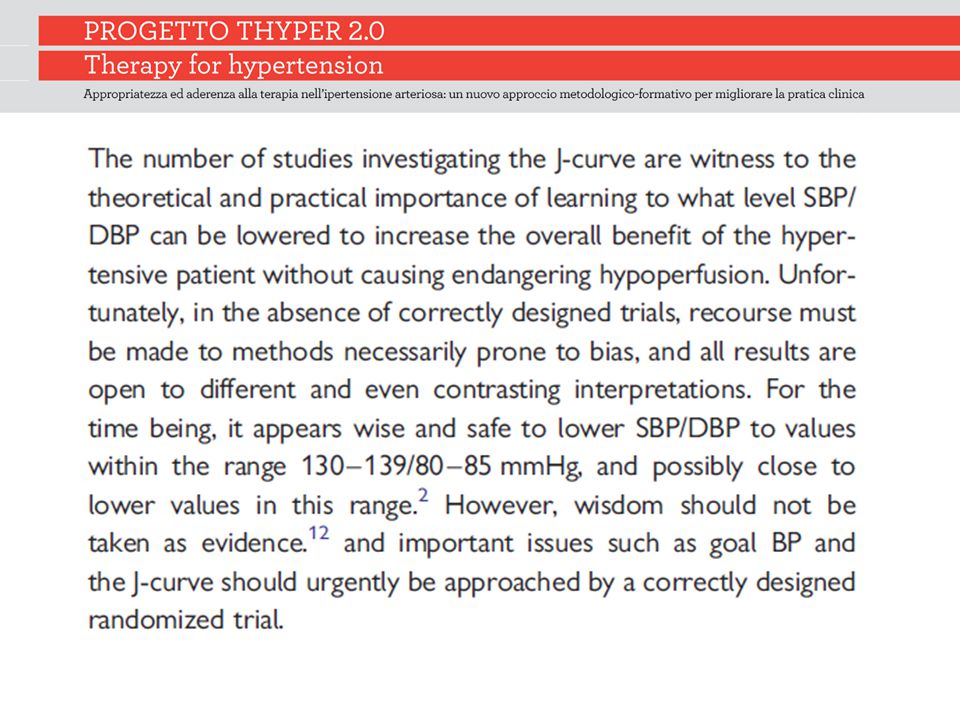
The J-shaped curve: fact or fiction? However, failure to control blood pressure remains a major problem and, instead of getting side-tracked and enmeshed in debates about the J-shaped curve, we need rather to focus our energies on achieving good control

Presentazioni simili


>")


 Consigliere Onorario della FADOI Emilia Romagna.>")


, 29-30 maggio 2013 PERCEZIONE DEI CAMPI.>")


