Scaricare la presentazione
La presentazione è in caricamento. Aspetta per favore

1
TCD: Digital Power M-Mode
Ing. Marco Rossi

2
Nel 1843 Christian Doppler descrisse i presupposti fisici del principio che poi avrebbe preso il suo nome. Secondo il Principio Doppler, la frequenza di un’onda sonora è aumentata nell’avvicinamento e diminuita nell’allontanamento dalla sorgente acustica.

3
Per questo il suono di una ambulanza che si avvicina a noi è percepita come un suono sempre più acuto, e quando si allontana il suono si fa sempre più grave.

4
A- Mode: Rappresentazione dell’Ampiezza in funzione della profondità
B- Mode: Rappresentazione costruita mediante la variazione delle della Brillanza, cioè della scala dei grigi M-Mode: Rappresentazione Motion Mode, funzione di rappresentazione degli echi nel tempo D-Mode: Rappresentazione Doppler Mode, distribuzione spettrale della velocità, cioè la rappresentazione nel tempo di tutte le velocità rilevate

5
M-Mode e D-Mode Doppler Mode M-Mode

6
Doppler Transcranico:
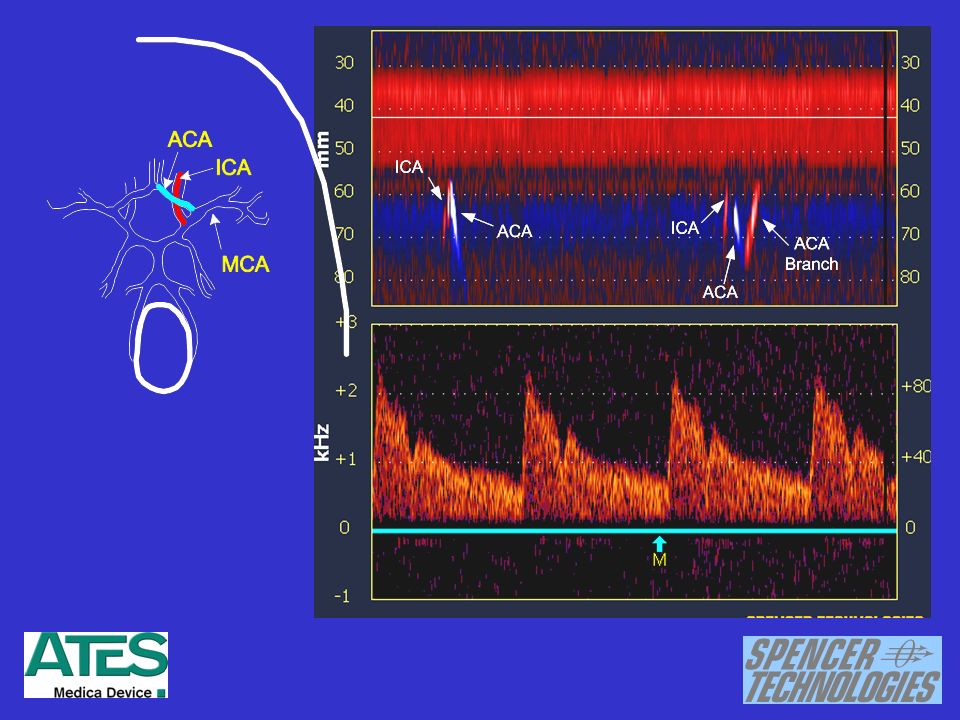
M-Mode e D-Mode Spectral Gate LMCA LACA RACA MCA: Arteria Cerebrale Media ACA: Arteria Cerebrale Anteriore

7
Discriminazione Power M-Mode
Discriminazione in Potenza Discriminazione in Velocità

8
Power m-mode Doppler Single gate Doppler Color velocity m-mode
Questa immagine mostra come il formato Power M-Mode, mostrato in alto, differisce dal formato standard Color Velocity, rappresentato in basso. Entambe le immagini rappr,esentate in alto e basso dello schemo, sono state processate patendo dagli stessi dati. L’immagine in alto mostra le informazioni sulla Potenza, mentre in basso sono mostrate le informazioni sulla velocità. Nella parte cemtrale, si può osservare un embolo, rilevato in un singolo gate 50mm di profondità. Questa situazione embolica è chiaramente visibile nell’immagine superiore nel M-Power, ma questa è estremamente ridotta nell’immagine inferiore nel modo Velocità, in quanto è mascherata dal flusso ACA che si muove verso la distale ICA. Nel MCA, dell’immagine inferiore, l’embolo diventa invisibile, perchè la sua velocità è identica alla velocità di fondo del flusso ematico, e nessuna impostazione del doppler, è in grado di distinguere questa alterazione. Power m-mode Doppler Single gate Doppler This image illustrates how the power m-mode imaging format, shown in the top image, differs from the standard color velocity imaging format shown in the bottom image. Both the top and the bottom images are processed from the same data. The top image shows power information while the bottom image shows velocity information. An embolus ca be see in the single gate spectrogram acquired from a gate depth of 50mm and shown in the middle image. This embolic signature appears dramatically in the upper image where power is displayed but there’s only a small indicator of it in the bottom image and that is it’s masking the ACA signature as it moves through the distal ICA. IN the MCA, it is invisible in the bottom image because its velocity is identical to that of the background blood flow and there is nothing to set it apart in this image format. Color velocity m-mode 8

9
Nuova Tecnologia Digital Power M-Mode
Nuova modalità Power M-Mode brevettata Tecnologia digitale a 64 gates per canale Facile acquisizione ed identificazione dei vasi Flow towards probe Depth Flow away from probe

10
PMD: Morfologia degli emboli
Emboli as viewed with power m-mode Doppler are shown on this slide, side by side with these emboli as viewed in the old style using single gate spectral Doppler clues. In PMD you can see emboli in a fashion very consistent with the medical dictionary definition of an embolus: a particle foreign to blood flow that moves from one part of the vasculature to another. Here we have emboli showing up for example, at the origin of the middle cerebral artery, transiting the length of that vessel, and then falling out of view. The steeper the embolic signature in PMD, the faster the embolus is moving.

13
Vertebral Basilar Embolus

14
Bubble Showers Gradients
5+ 5 4 3 2 1 Bubble Showers Gradients

15
Bubble Shower

16
Bubble Shower

17
Artefatti o Emboli?

18
TCD Digital Power M-mode
TCD Analogico Nessuna indicazione spaziale sul display Sensibilità Analogica limitata Uso limitato e difficile Ambiguità sul riconoscimento degli Emboli Rappresentazione dettagliata di tutti i flussi ematici con informazione della loro profondità, direzione ed ampiezza. Processo completo di Analisi digitale avanzata ad alta sensibilità Facile riconoscimento dei flussi ematici e loro interpretazione Inequivocabile riconoscimento degli Emboli

19
Digital Power M-Mode Simple, easy technique Easy Artefact detection
High degree of specificity High degree of sensitivity Reproducible technique Pre & post closure verification

20
Thank You! Per ogni informazione rivolgersi a

Presentazioni simili