Scaricare la presentazione
La presentazione è in caricamento. Aspetta per favore

1
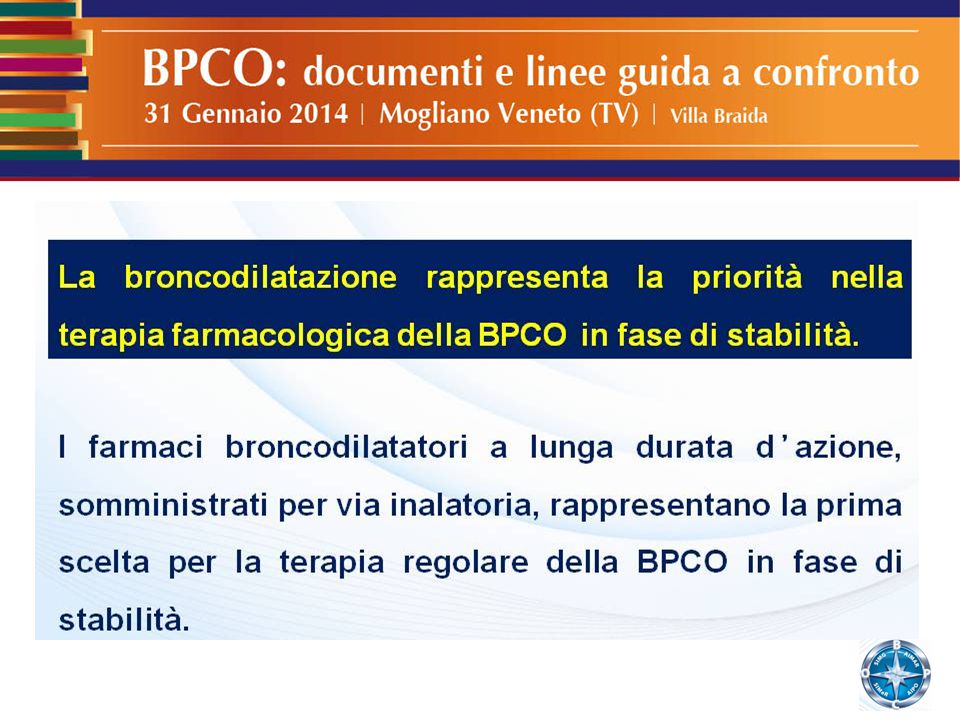
Terapia della fase stabile della BPCO: farmacoterapia
Dr. Claudio Micheletto – Legnago (VR)
")
5
…..

7
GOALS FOR TREATMENT OF STABLE COPD
Reduce symptoms Relieve symptoms Improve exercise tolerance Improve health status Reduce risk Prevent disease progression Prevent exacerbations Reduce mortality Am J Resp Crit Care 2013

9
CLASSE FARMACO CARATTERISTICA Anticolinergici a lunga durata d’azione (LAMA) Tiotropio bromuro Glicopirronio Aclidinium Durata di azione 24 ore Durata di azione 12 ore Β2 agonisti a lunga durata d’azione (LABA) Salmeterolo Formoterolo Indacaterolo Combinazioni precostituite LABA + CSI Salmeterolo-fluticasone Formoterolo-budesonide Inibitore delle fosfodiesterasi-4 Roflumilast Per os
 Salmeterolo. Formoterolo. Indacaterolo. Combinazioni precostituite LABA + CSI. Salmeterolo-fluticasone. Formoterolo-budesonide. Inibitore delle fosfodiesterasi-4. Roflumilast. Per os.")
10
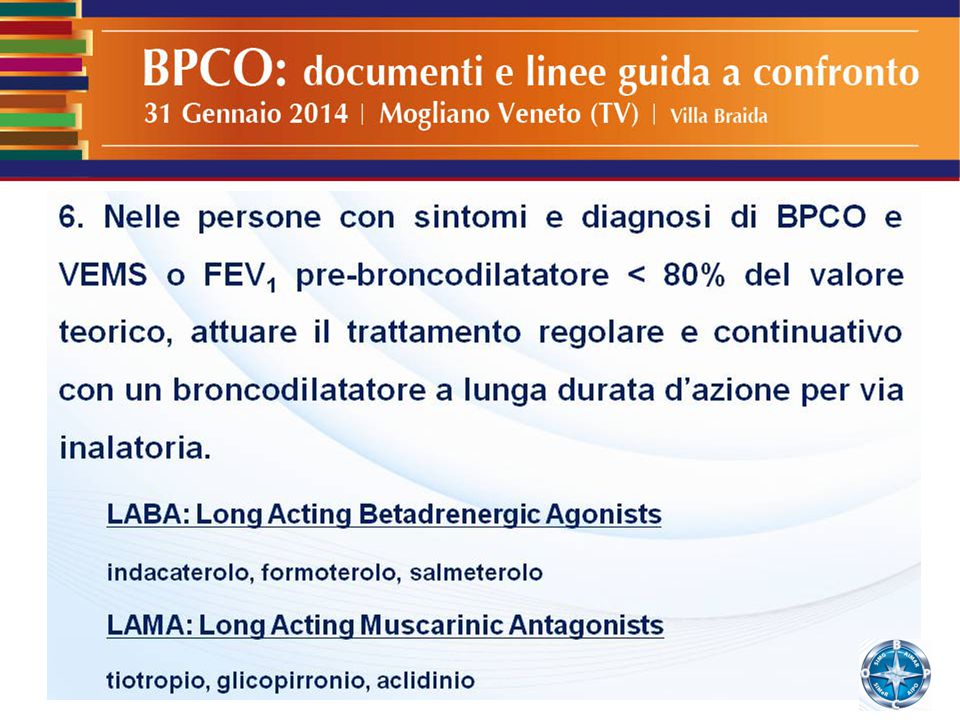
Β2 agonisti a breve durata d’azione (SABA) Salbutamolo Terbutalina
CLASSE FARMACO CARATTERISTICA Β2 agonisti a breve durata d’azione (SABA) Salbutamolo Terbutalina Fenoterolo Rapido esordio della broncodilatazione, durata di azione 4-6 ore Anticolinergici a breve durata d’azione (SAMA) Ipratropio bromuro* Ossitropio bromuro* Esordio meno rapido, ma durata un po’ più lunga dei SABA (4-6 ore) Metilxantine Teofilline orali a lento rilascio Finestra terapeutica ristretta. Farmaci aggiuntivi nei pazienti più gravi LABA: long acting beta2 agonist LAMA: long acting muscarinic antagonist SABA: short acting beta2 agonist SAMA: short acting muscarinic antagonist CSI: corticosteroidi inalatori * Disponibili solo per aerosol
 Salbutamolo. Terbutalina. Fenoterolo. Rapido esordio della broncodilatazione, durata di azione 4-6 ore. Anticolinergici a breve durata d’azione (SAMA) Ipratropio bromuro* Ossitropio bromuro* Esordio meno rapido, ma durata un po’ più lunga dei SABA (4-6 ore) Metilxantine. Teofilline orali a lento rilascio. Finestra terapeutica ristretta. Farmaci aggiuntivi nei pazienti più gravi. LABA: long acting beta2 agonist. LAMA: long acting muscarinic antagonist. SABA: short acting beta2 agonist. SAMA: short acting muscarinic antagonist. CSI: corticosteroidi inalatori. * Disponibili solo per aerosol.")
11
La scelta terapeutica deve essere adeguata per la singola persona e guidata dalle caratteristiche e dalla gravità del quadro clinico considerato nel suo insieme di sintomi, funzione respiratoria, complicanze, comorbilità e delle peculiarità individuali (fenotipo) della persona che ne è affetta.
 della persona che ne è affetta.")
12
Am J Resp Crit Care Med 1995

13
Postbrochodilator FEV1/FVC
The COPD dilemma COPD is defined by the presence of airflow limitation that is not fully reversible, and its treatment is mostly guided by the severity of this limitation. Severity Postbrochodilator FEV1/FVC FEV1 % pred At risk >0.7 80 Mild COPD 0.7 Moderate COPD 50–80 Severe COPD 30–50 Very severe COPD <30 Han AJRCC 2010

14
The COPD dilemma it is now widely recognized that COPD is a complex syndrome with pulmonary and extrapulmonary components. Importantly, significant heterogeneity exists with respect to clinical presentation, physiology, imaging, response to therapy, decline in lung function, and survival. Han AJRCC 2010

15
GOLD classification of Airflow Limitation
The COPD dilemma There is consensus that FEV1 by itself does not adequately describe the complexity of the disease and that FEV1 cannot be used in isolation for the optimal diagnosis, assessment, and management of the disease. 4 3 2 1 (C) (D) (A) (B) ≥2 GOLD classification of Airflow Limitation RISK Exacerbation history RISK 1 mMRC mMRC ≥ 2 CAT < CAT ≥ 10 Symptoms Vestbo J, et al. AJRCCM 2013
 (D) (A) (B) ≥2. GOLD classification of Airflow Limitation. RISK. Exacerbation history. RISK. 1. mMRC 0-1 mMRC ≥ 2. CAT < 10 CAT ≥ 10. Symptoms. Vestbo J, et al. AJRCCM")
16
Vestbo J, et al. AJRCCM 2013

17
GOLD 2013 Manage Stable COPD: Pharmacologic Therapy
Patient Recommended First choice Alternative choice Other Possible Treatments A SAMA prn or SABA prn LAMA LABA SABA and SAMA Theophylline B LAMA and LABA SABA and/or SAMA C ICS + LABA LAMA and LABA or LAMA and PDE4-inh. or LABA and PDE4-inh. D and/or ICS + LABA and LAMA or ICS+LABA and PDE4-inh. or LAMA and PDE4-inh. Carbocysteine SAMA: antimuscarinici a breve durata d’azione; SABA: β2-agonisti a breve durata d’azione; p.r.n.: all’occorrenza (pro re nata); LAMA: antimuscarinici a lunga durata d’azione; LABA: β2-agonisti a lunga durata d’azione; ICS: corticosteroidi per via inalatoria; PDE-4: fosfodiesterasi-4 Summary handout, Revised GOLD
; LAMA: antimuscarinici a lunga durata d’azione; LABA: β2-agonisti a lunga durata d’azione; ICS: corticosteroidi per via inalatoria; PDE-4: fosfodiesterasi-4. Summary handout, Revised GOLD")
18
The identification and subsequent grouping of key elements of the COPD syndrome into clinically meaningful and useful subgroups (phenotypes) that can guide therapy more effectively is a potential solution of the dilemma Han KM, et al. Am J Respir Crit Care Med 2010; 182,

19
Phenotypes – an operational definition
‘‘a single or combination of disease attributes that describe differences between individuals with COPD as they relate to clinically meaningful outcomes (symptoms, exacerbations, response to therapy, rate of disease progression, or death).’’ Han KM, et al. Am J Respir Crit Care Med 2010; 182,
.’’ Han KM, et al. Am J Respir Crit Care Med 2010; 182,")
21
GOLD 2013

23
Efficacy of Tiotropium in COPD Patients with FEV1 ≥ 60% participating in the UPLIFT® Trial - SGRQ~40
Tashkin DP, et al J COPD 2012

24
Efficacy of Tiotropium in COPD Patients with
FEV1 ≥ 60% participating in the UPLIFT® Trial Tashkin DP, et al J COPD 2012

25
GOLD Stage II: Exacerbations
Tiotropium (n=1384) Control (n=1355) Ratio (95% CI) P-value Time to first exacerbation (month) 23.1 (21.0, 26.3) 17.5 (15.9, 19.7) 0.82 (0.75, 0.90)* <0.0001* Mean number of exacerbations/pt yr (95% CI) 0.56 (0.52, 0.60) 0.70 (0.65, 0.75) 0.80 (0.72, 0.88)† <0.0001† Mean number of hospitalizations for exacerbations/ pt yr (95% CI) 0.08 (0.07, 0.09) 0.10 (0.08, 0.12) (0.63, 1.03)† 0.082† *Hazard ratio (control vs. tiotropium) and P-value were estimated using Cox regression. †Rate ratio (tiotropium/control) and P-value were estimated using the Poisson with Pearson overdispersion model adjusting for treatment exposure. Decramer et al. Lancet 2009; 374: 25
 Control. (n=1355) Ratio. (95% CI) P-value. Time to first exacerbation (month) (21.0, 26.3) (15.9, 19.7) (0.75, 0.90)* <0.0001* Mean number of exacerbations/pt yr (95% CI) (0.52, 0.60) (0.65, 0.75) (0.72, 0.88)† <0.0001† Mean number of hospitalizations for exacerbations/ pt yr (95% CI) (0.07, 0.09) (0.08, 0.12) (0.63, 1.03)† 0.082† *Hazard ratio (control vs. tiotropium) and P-value were estimated using Cox regression. †Rate ratio (tiotropium/control) and P-value were estimated using the Poisson with Pearson overdispersion model adjusting for treatment exposure. Decramer et al. Lancet 2009; 374:")
26
Tempo dopo la dose (min)
Indacaterolo 300 µg Indacaterolo µg 150 Tiotropio ††† *** ††† *** 220 190 ††† *** 180 200 ††† *** *** 180 ††† *** 160 160 *** ††† *** 150 140 160 *** 130 *** 120 120 140 110 *** 120 MCID FEV1 (ml) 90 100 ** 80 50 60 N° pazienti 169 Obiettivo efficacia vs. placebo e tiotropio Disegno crossover, randomizzato in doppio cieco Durata 14 giorni Farmaci indacaterolo 150 µg, tiotropio 18 µg, placebo 40 20 5 15 30 60 Tempo dopo la dose (min) **p<0,01; ***p<0,001 vs placebo. †††p<0,05 vs tiotropio Aumenti rispetto al basale a 5 min post-dose: 60 ml (4,4%) con tiotropio, 130 ml (9,7%) con indacaterolo 150 µg e 140 ml (10,2%) con indacaterolo 300 µg. Vogelmeier et al. Respiratory Research 2010 26
 ** N° pazienti 169. Obiettivo efficacia vs. placebo e tiotropio. Disegno crossover, randomizzato in doppio cieco. Durata 14 giorni. Farmaci indacaterolo 150 µg, tiotropio 18 µg, placebo Tempo dopo la dose (min) **p<0,01; ***p<0,001 vs placebo. †††p<0,05 vs tiotropio. Aumenti rispetto al basale a 5 min post-dose: 60 ml (4,4%) con tiotropio, 130 ml (9,7%) con indacaterolo 150 µg e 140 ml (10,2%) con indacaterolo 300 µg. Vogelmeier et al. Respiratory Research")
27
*** *** *** *** *** *** TDI focal score Settimana 12 Settimana 26
3.0 2.0 1.0 † *** *** *** *** *** *** 1 punto 1 punto TDI focal score B2335S CSR Table 11–14 Reference Mahler DA, Palange P, Iqbal A, Owen R, Higgins M, Kramer B. Indacaterol once-daily improves dyspnoea in COPD patients: a 26-week placebo-controlled study with open-label tiotropium comparison. Abstract to be presented at ERS 2009. Settimana 12 Settimana 26 Media dei minimi quadrati (LSM).. ***p<0.001 vs placebo; +p<0.05 vs tiotropio BRACCIO IN APERTO Differenza ≥1 = miglioramento clinicamente significativo del TDI score Donohue et al. Am J Respir Crit Care Med 2010 27 27
.. ***p<0.001 vs placebo; +p<0.05 vs tiotropio BRACCIO IN APERTO. Differenza ≥1 = miglioramento clinicamente significativo del TDI score. Donohue et al. Am J Respir Crit Care Med")
28
Punteggio totale SGRQ Pazienti (%) con variazione clinicamente importante del punteggio totale SGRQ Differenza -2,1 (p<0,001) 51,0 47,0 43,0 39,0 35,0 Odds ratio 1,43 (p<0,001) MIGLIORAMENTO SGRQ = St. George’s Respiratory Questionnaire (questionario respiratorio St. George) L.J Dunn , R Buhl et al. Studio Intensity
 51,0. 47,0. 43,0. 39,0. 35,0. Odds ratio 1,43. (p<0,001) MIGLIORAMENTO. SGRQ = St. George’s Respiratory Questionnaire (questionario respiratorio St. George) L.J Dunn , R Buhl et al. Studio Intensity.")
29
Aclidinium improves trough FEV1:
150 Placebo BID Aclidinium 400 µg BID 100 *** *** *** *** *** *** 50 128 mL Change from baseline in trough FEV1 (mL) -50 -100 4 8 12 16 20 24 Treatment week ***p0.001 vs placebo Jones et al, Eur Respir J 2012
 Treatment week. ***p0.001 vs placebo. Jones et al, Eur Respir J")
30
Aclidinium reduces COPD exacerbation (any severity) rates (24 weeks)
1.6 Placebo BID 1.39 Aclidinium 400 µg BID 29% 1.2 0.98* COPD exacerbations (/pt/year) 0.8 0.60 33% 0.40* 0.4 0.0 Healthcare Resource Utilization criteria EXACT criteria *p<0.05 vs placebo Jones et al, CHEST 2012
 % 0.40* Healthcare Resource Utilization criteria. EXACT criteria. *p<0.05 vs placebo. Jones et al, CHEST")
31
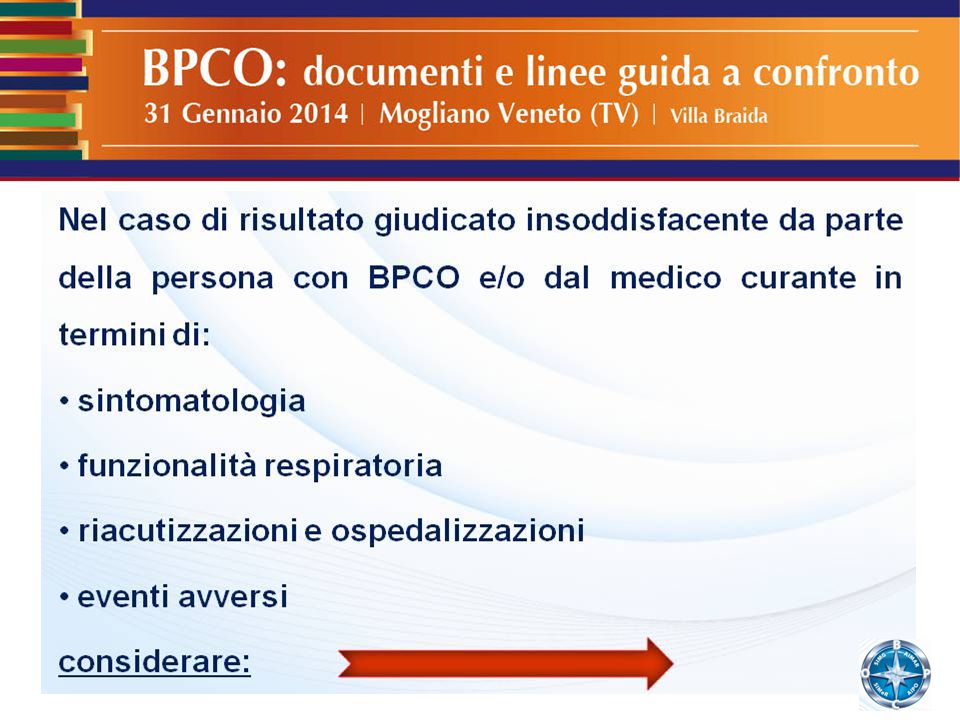
Nelle persone in regolare trattamento farmacologico, valutare ad ogni visita programmata:
la corretta e regolare assunzione della terapia la valutazione dei sintomi ed in particolare, la tolleranza all’esercizio fisico e la dispnea da sforzo

32
le modificazioni della funzione polmonare non solo in termini di FEV1 ma anche di altri parametri come i volumi polmonari e la DLCO la frequenza con la quale la persona ricorre a broncodilatatori a breve durata d’azione come supporto occasionale

33
la frequenza e gravità degli episodi di riacutizzazione
la frequenza e la durata degli episodi di ospedalizzazione la frequenza e la gravità di eventuali eventi collaterali e/o avversi

36
GOLD 2013

37
Kaplan–Meier Curves for the Primary and Selected Secondary Outcomes.
These results show that, in patients with moderate-to-very-severe COPD, tiotropium is more effective than salmeterol in preventing exacerbations. Figure 2 Kaplan–Meier Curves for the Primary and Selected Secondary Outcomes. Kaplan–Meier curves are shown for the probability of premature discontinuation of the study medication (Panel A), the probability of a first exacerbation of chronic obstructive pulmonary disease (COPD) (Panel B), and the probability of a first severe exacerbation of COPD leading to hospitalization (Panel C) in the tiotropium and salmeterol groups. The hazard ratios are based on a Cox proportional-hazards regression model including terms for (pooled) center and treatment. CI denotes confidence interval. Vogelmeier C et al. N Engl J Med 2011;364:
, the probability of a first exacerbation of chronic obstructive pulmonary disease (COPD) (Panel B), and the probability of a first severe exacerbation of COPD leading to hospitalization (Panel C) in the tiotropium and salmeterol groups. The hazard ratios are based on a Cox proportional-hazards regression model including terms for (pooled) center and treatment. CI denotes confidence interval. Vogelmeier C et al. N Engl J Med 2011;364:")
39
GOLD 2013

40
JA van Noord, et al . Eur Resp J 2005; 26: 214-22.

41
Dual bronchodilation with QVA149: the SHINE study 2/3 moderati; quasi 80% no riac. Sintomatici per entry. SGRQ >40 Bateman et al Eur Respir J. 2013

42
Pre-dose trough FEV1 was significantly higher with QVA149 vs glycopyrronium and tiotropium at all assessments Differences between QVA149 and glycopyrronium and tiotropium were statistically significant (p<0.0001) at each assessment during the treatment period. Data are least squares means ±SE Wedzicha JA, et al. Lancet Resp Med (3):
 at each assessment during the treatment period. Data are least squares means ±SE. Wedzicha JA, et al. Lancet Resp Med (3):")
43
Rate reduction of COPD exacerbations
0.84* (0.75, 0.95) 0.85† (0.75, 0.96) 0.88§ (0.77, 0.99) 0.90‡ (0.79, 1.02 1.16¶ (0.84, 1.61) 0.81|| (0.60, 1.10) 0.85†† (0.77, 0.94) 0.86** (0.78, 0.94) Values are rate reduction (95% CI); n numbers per treatment group: QVA149 n=729; glycopyrronium n=739; tiotropium n=737. *p=0.0052,†p=0.0072,‡p=0.096,§p=0.038,¶p=0.36,||p=0.18,**p=0.0017,††p= Wedzicha JA, et al. Lancet Resp Med (3):
 0.85† (0.75, 0.96) 0.88§ (0.77, 0.99) 0.90‡ (0.79, ¶ (0.84, 1.61) 0.81|| (0.60, 1.10) 0.85†† (0.77, 0.94) 0.86** (0.78, 0.94) Values are rate reduction (95% CI); n numbers per treatment group: QVA149 n=729; glycopyrronium n=739; tiotropium n=737. *p=0.0052,†p=0.0072,‡p=0.096,§p=0.038,¶p=0.36,||p=0.18,**p=0.0017,††p= Wedzicha JA, et al. Lancet Resp Med (3):")
44
FEV1 AUC0–12h at Week 26 No riac per inclusione ; >80% moderati..
∆=138 mL, p<0.0001 FEV1 AUC 0–12h ( L) Fluticasone/salmeterol 500/50 μg QVA /50 μg Values are least-squares mean ± standard error Vogelmeier CF, et al. Lancet Resp Med. 2012
 Fluticasone/salmeterol 500/50 μg. QVA /50 μg. Values are least-squares mean ± standard error. Vogelmeier CF, et al. Lancet Resp Med")
45
Mean SGRQ-C total score
Improvement Data are LSM (SE); Mean difference in SGRQ-C total score for QVA149 versus SFC at Week 26 was –1·24 (p=0·245); SGRQ=St George’s Respiratory Questionnaire; LSM=least squares mean; SE=standard error; SFC=salmeterol/fluticasone Vogelmeier CF, et al. Lancet Resp Med. 2012
; Mean difference in SGRQ-C total score for QVA149 versus SFC at Week 26 was –1·24 (p=0·245); SGRQ=St George’s Respiratory Questionnaire; LSM=least squares mean; SE=standard error; SFC=salmeterol/fluticasone. Vogelmeier CF, et al. Lancet Resp Med")
46
GOLD 2013

49
* p< 0.001 vs PLA ** p = 0.003 vs PLA
In the TRISTAN study, FP/Salm combination reduced the number of severe exacerbations 0.5 1 1.5 PLA SAL50 FP500 SFC50/500 * ** 0.97 1.05 1.04 1.30 number/patient/year * p< vs PLA ** p = vs PLA Calverly et al, Lancet 2003

50
TORCH Study: additional effect of salmeterol/fluticasone vs both monotherapies
FEV1≤60% Calverley MD, et al. New Eng J Med 2007, Vol.356 (8):
:")
51
TORCH. SGRQ Total Score Corrected mean change in SGRQ total score 3
Placebo 2 1 SALM * FP † SALM/FP †† –1 –2 –3 –4 The St George’s Respiratory Questionnaire (SGRQ) was used to record patient health status. The Health Outcomes population comprised 4,951 patients from 28 countries in which a validated SGRQ exists. A transformed score was calculated for each of the SGRQ’s three domains (symptoms, impacts and activity) as well as the overall total score. SGRQ was analysed as change from baseline using repeated measures analysis of covariance (ANCOVA). This model included treatment, smoking status, age, gender, baseline FEV1, BMI, region, visit (as a categorical variable) and treatment by visit. Baseline SGRQ and visit by baseline SGRQ were included in the model. Estimated treatment differences at each visit were averaged with equal weights to obtain the overall treatment effect over the study period. Total SGRQ score improved initially from baseline in all groups, the greatest changes occurring with SALM/FP treatment (a decrease in SGRQ score indicates improvement). The improvement in SGRQ total score at 6 months in patients taking SALM/FP was already statistically significant compared with placebo (p = 0.001). The adjusted mean change in SGRQ total score at 3 years was –1.2 for patients taking SALM/FP, –0.2 for patients taking FP, 1.0 for patients taking SALM and 2.1 for patients taking placebo. At 3 years, patients taking SALM/FP had still not returned to baseline SGRQ and these patients were more likely to maintain health status or achieve a 4 unit improvement than those patients taking placebo, SALM or FP. From these results, patients taking steroid-containing medications had the greatest improvement in total SGRQ score at 3 years. Although a clinically relevant 4 unit difference from baseline SGRQ total score was not achieved over 3 years, at 1 year, a 4 unit improvement (raw change) in SGRQ total score was observed in patients taking SALM/FP (the only group to show this). It is important to remember that the fitter patients on placebo remain in the study for longer, which biases against the treatment effect of SALM/FP (see backup slides) COPD is a progressive disease in which health status declines over time, so these results for patients taking SALM/FP (in whom SGRQ score had still not returned to baseline at 3 years and in which SGRQ score was significantly greater than placebo and components) is very important. –5 24 48 72 96 120 156 Time (weeks) Number of subjects 1149 1148 1155 1133 854 906 942 941 781 844 848 873 726 807 814 675 723 751 773 635 701 686 731 569 634 629 681 *p = vs placebo; †p < vs placebo; ††p < vs placebo, SALM and FP; vertical bars are standard errors Calverley et al, NEJM 2007
 was used to record patient health status. The Health Outcomes population comprised 4,951 patients from 28 countries in which a validated SGRQ exists. A transformed score was calculated for each of the SGRQ’s three domains (symptoms, impacts and activity) as well as the overall total score. SGRQ was analysed as change from baseline using repeated measures analysis of covariance (ANCOVA). This model included treatment, smoking status, age, gender, baseline FEV1, BMI, region, visit (as a categorical variable) and treatment by visit. Baseline SGRQ and visit by baseline SGRQ were included in the model. Estimated treatment differences at each visit were averaged with equal weights to obtain the overall treatment effect over the study period. Total SGRQ score improved initially from baseline in all groups, the greatest changes occurring with SALM/FP treatment (a decrease in SGRQ score indicates improvement). The improvement in SGRQ total score at 6 months in patients taking SALM/FP was already statistically significant compared with placebo (p = 0.001). The adjusted mean change in SGRQ total score at 3 years was –1.2 for patients taking SALM/FP, –0.2 for patients taking FP, 1.0 for patients taking SALM and 2.1 for patients taking placebo. At 3 years, patients taking SALM/FP had still not returned to baseline SGRQ and these patients were more likely to maintain health status or achieve a 4 unit improvement than those patients taking placebo, SALM or FP. From these results, patients taking steroid-containing medications had the greatest improvement in total SGRQ score at 3 years. Although a clinically relevant 4 unit difference from baseline SGRQ total score was not achieved over 3 years, at 1 year, a 4 unit improvement (raw change) in SGRQ total score was observed in patients taking SALM/FP (the only group to show this). It is important to remember that the fitter patients on placebo remain in the study for longer, which biases against the treatment effect of SALM/FP (see backup slides) COPD is a progressive disease in which health status declines over time, so these results for patients taking SALM/FP (in whom SGRQ score had still not returned to baseline at 3 years and in which SGRQ score was significantly greater than placebo and components) is very important. – Time (weeks) Number of. subjects *p = vs placebo; †p < vs placebo; ††p < vs placebo, SALM and FP; vertical bars are standard errors. Calverley et al, NEJM")
52
Bud/Form: reduction of exacerbations
* * * * 2.0 1.9 2.0 1.9 1.8 1.8 1.8 1.4 1.8 1.6 1.4 1.6 1.6 1.6 1.4 1.4 1.2 1.2 N. medio riacutizzazioni/paziente/anno 1.0 1.0 0.8 0.8 0.6 0.6 0.4 0.4 0.2 0.2 BUD/FORM BUD FORM PL BUD/FORM BUD FORM PL Numero medio di riacutizzazioni/paziente/anno1 Trattamento Szafranski Calverley BUD/FORM 1,4* 1,4(*) BUD 1,6 FORM 1,8 1,9 PL *p<0,05 vs BUD/FORM (*)p<0,05 vs BUD/FORM 1. Szafranski W et al. Eur Respir J 2003; 21: 74-81; 2. Calverley PM et al. Eur Respir J 2003; 22:
 BUD. 1,6. FORM. 1,8. 1,9. PL. *p<0,05 vs BUD/FORM. (*)p<0,05 vs BUD/FORM. 1. Szafranski W et al. Eur Respir J 2003; 21: 74-81; 2. Calverley PM et al. Eur Respir J 2003; 22:")
53
Rate ratio (RR) = 0.74 (CI: 0.69, 0.79) p < 0.0001
Larsson et al. J Intern Med 2013; 273(6): 584–94.
: 584–94.")
54
62% reduction in rate of exacerbation*
0.4 0.3 0.2 0.1 0.0 15 30 45 60 75 90 Days since randomisation Exacerbations/patient Bud/form + TIO PBO + TIO 62% reduction in rate of exacerbation* Ratio: 0.38 (95% CI: 0.25–0.57) P < 0.001 Welte T, et al. Am J Respir Crit Care Med 2009;
 P < Welte T, et al. Am J Respir Crit Care Med 2009;")
56
COPD Exacerbations (Moderate or Severe) M2-124 & M2-125 pooled analysis
= - 17% (CI -25;-8) p = 1.5 Mean rate of exacerbations per patient per year 1 The 2nd co-primary endpoint was the mean reduction in rate of moderate and severe exacerbations over the 52 weeks. Key Message Treatment with roflumilast significantly reduced the rate of moderate and severe exacerbations over 12 months compared to placebo In both pivotal studies, roflumilast significantly reduced the rate of moderate and severe exacerbations by 17% versus placebo in this population of COPD patients. The results on this slide combined with the lung function data meet the regulatory requirements for demonstrating efficacy of roflumilast 0.5 1.374 1.142 placebo roflumilast 500µg Calverley PMA, Rabe, KF ,et al. Lancet 2009;374:685–94 56
 p = Mean rate of exacerbations per patient per year. 1. The 2nd co-primary endpoint was the mean reduction in rate of moderate and. severe exacerbations over the 52 weeks. Key Message. Treatment with roflumilast significantly reduced the rate of. moderate and severe exacerbations over 12 months compared to. placebo. In both pivotal studies, roflumilast significantly reduced the rate of moderate and. severe exacerbations by 17% versus placebo in this population of COPD patients. The results on this slide combined with the lung function data meet the regulatory. requirements for demonstrating efficacy of roflumilast placebo. roflumilast 500µg. Calverley PMA, Rabe, KF ,et al. Lancet 2009;374:685–")
57
Roflumilast as Add-On Therapy in COPD
Pre-bronchodilator FEV1 1.6 Salmeterol+ Roflumilast 1.5 Pre bd FEV1 [L] 1.4 Salmeterol + Placebo Key Message The additional significant improvements in lung function (pre-bronchodilator FEV1) were sustained over 6 months of treatment when roflumilast was used concomitantly with salmeterol, compared with salmeterol plus placebo M2-127 This graph illustrates that the improvement in pre-bronchodilator FEV1 was seen at 4 weeks and sustained throughout treatment. By week 24, pre-bronchodilator FEV1 in the Roflumilast + Salmeterol arm remained significantly greater when compared to the salmeterol + placebo arm Study medication was to be withheld in the morning of study visit days, as was salmeterol for 10 hours and reliever medication for at least 4 hours prior to pulmonary function tests. The pre-bronchodilator measurement thus represents the ‘worst-case’ in terms of lung function improvement, as it is the smallest degree of improvement that would be observed over the dose interval. The fact that the onset of effect of roflumilast on FEV1 is not immediate shows that the effect is not due to bronchodilation by smooth muscle relaxation, and can likely be explained by the anti-inflammatory effects of roflumilast. 466 467 455 463 410 437 389 419 374 403 359 384 Roflumilast Placebo 1.3 4 8 12 18 24 Weeks Fabbri LM, Calverley PMA et al. Lancet 2009;374:695–703 57 57
 were sustained over 6 months of treatment when roflumilast was used concomitantly with salmeterol, compared with salmeterol plus placebo. M This graph illustrates that the improvement in pre-bronchodilator FEV1 was seen at 4 weeks and sustained throughout treatment. By week 24, pre-bronchodilator FEV1 in the Roflumilast + Salmeterol arm remained significantly greater when compared to the salmeterol + placebo arm. Study medication was to be withheld in the morning of study visit days, as was salmeterol for 10 hours and reliever medication for at least 4 hours prior to pulmonary function tests. The pre-bronchodilator measurement thus represents the ‘worst-case’ in terms of lung function improvement, as it is the smallest degree of improvement that would be observed over the dose interval. The fact that the onset of effect of roflumilast on FEV1 is not immediate shows that the effect is not due to bronchodilation by smooth muscle relaxation, and can likely be explained by the anti-inflammatory effects of roflumilast Roflumilast. Placebo Weeks. Fabbri LM, Calverley PMA et al. Lancet 2009;374:695–")
58
Roflumilast as Add-On Therapy in COPD
Pre-bronchodilator FEV1 1.7 Tiotropium+ Roflumilast 1.6 Pre bd FEV1 [L] 1.5 Key Message The improvements in lung function (pre bronchodilator FEV1) were sustained over 6 months of treatment when roflumilast was used concomitantly with tiotropium compared with tiotropium plus placebo M2-128 This graph illustrates that the improvement in pre-bronchodilator FEV1 was seen at 4 weeks and sustained throughout treatment. By week 24, pre-bronchodilator FEV1 in the roflumilast + tiotropium arm remained significantly greater when compared to the tiotropium + placebo arm Study medication was to be withheld in the morning of study visit days, as was tiotropium for 20 hours and reliever medication for at least 4 hours prior to pulmonary function tests. The pre-bronchodilator measurement thus represents the ‘worst-case’ in terms of lung function improvement, as it is the smallest degree of improvement that would be observed over the dose interval. Tiotropium + Placebo 371 372 364 363 343 352 325 350 318 347 310 333 Roflumilast Placebo 1.4 4 8 12 18 24 Weeks Fabbri LM, Calverley PMA et al. Lancet 2009;374:695–703 58 58
 were sustained over 6 months of treatment when roflumilast was used concomitantly with tiotropium compared with tiotropium plus placebo. M This graph illustrates that the improvement in pre-bronchodilator FEV1 was seen at 4 weeks and sustained throughout treatment. By week 24, pre-bronchodilator FEV1 in the roflumilast + tiotropium arm remained significantly greater when compared to the tiotropium + placebo arm. Study medication was to be withheld in the morning of study visit days, as was tiotropium for 20 hours and reliever medication for at least 4 hours prior to pulmonary function tests. The pre-bronchodilator measurement thus represents the ‘worst-case’ in terms of lung function improvement, as it is the smallest degree of improvement that would be observed over the dose interval. Tiotropium + Placebo Roflumilast. Placebo Weeks. Fabbri LM, Calverley PMA et al. Lancet 2009;374:695–")
59
Phenotypes – an operational definition
‘‘a single or combination of disease attributes that describe differences between individuals with COPD as they relate to clinically meaningful outcomes (symptoms, exacerbations, response to therapy, rate of disease progression, or death).’’ Han KM, et al. Am J Respir Crit Care Med 2010; 182,
.’’ Han KM, et al. Am J Respir Crit Care Med 2010; 182,")
60
Exacerbator with emphysema
No exacerbator Overlap COPD-asthma Exacerbator with emphysema Exacerbator with chronic bronchitis Long acting bronchodilators Inhaled corticosteroids Mucolytics PDE4 inhibitors Macrolides M Miravitlles, et al. Eur Resp J 2013

62
Cessazione dal fumo : riduzione del declino funzionale
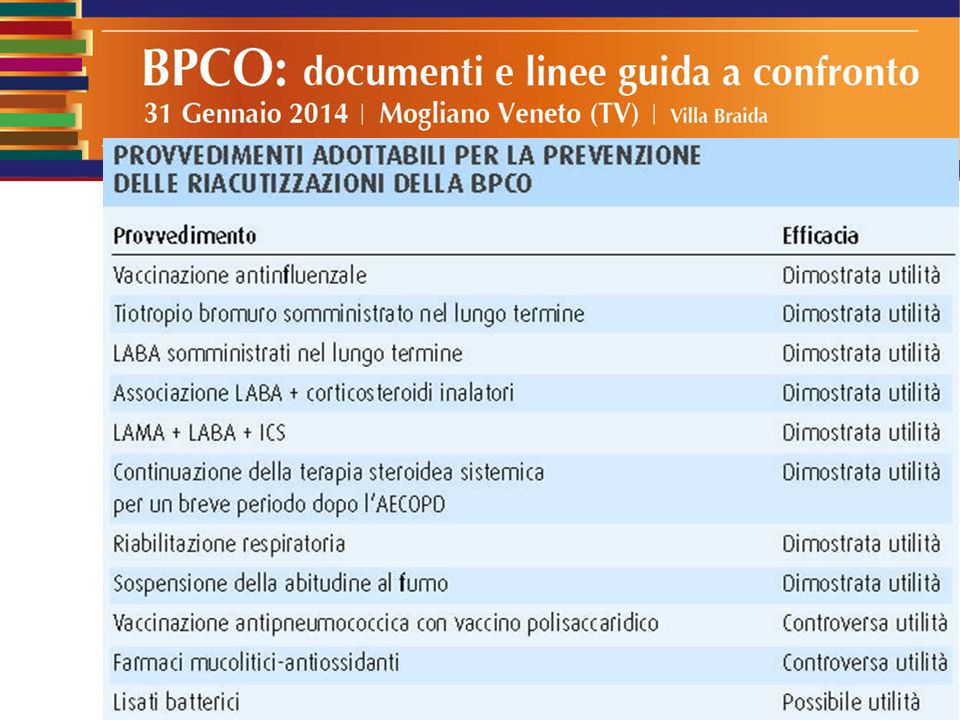
Vaccinazione antiinfluenzale : riduzione del 39% delle ospedalizzazioni e 50% della mortalità Vaccinazione antipneumococcica: non chiara diminuzione delle riacutizzazioni; diminuzione delle polmoniti Educazione all’autogestione con piano scritto Terapia farmacologica Non vi sono evidenze sull’utilizzo profilattico degli antibiotici La riabilitazione respiratoria è associata ad un minor numero di riacutizzazioni

Presentazioni simili


 is a disease state characterized by airflow limitation that is not fully reversible. The.>")

>")
>")


>")


