Scaricare la presentazione
La presentazione è in caricamento. Aspetta per favore

1
Il controllo esagerato della glicemia e della pressione arteriosa Patrizio Tatti Inverclyde Hospital UK Marcus Tullius Cicero (106–43 BCE) «Ipse dixit») Aristotile (384–322 BCE) «α ὐ τ ὸ ς ἔ φα»
 «Ipse dixit») Aristotile (384–322 BCE) «α ὐ τ ὸ ς ἔ φα»")
2
disclosure Negli ultimi due anni patrizio tatti ha avuto rapporti di lavoro / consulenza con i seguenti produttori di farmaci: Eli Lilly Novo Abbott Bayer Novartis Roche Merk Medtronic Non possiede azioni e non è in alcun modo shareholder di alcun produttore di farmaci

3
I due studi che seguono: A-riguardano soggetti all’ esordio di malattia B-sono stati studi di intervento seguiti da studi osservazionali Ia storia ed il mito

4
0.5 1 10 15 0567891011 37% decrease per 1% decrement in HbA1c p<0.0001 Updated mean HbA 1c Hazard ratio UKPDS 35. BMJ 2000; 321: 405-12 WOLKVAGEN Jetta 1983 DCCT: Rapporto tra HbA1c e rischio di complicanze microvascolari – DMT1 1983-1993 WOLKVAGEN Jetta 2010

5
DCCT – Macrovascular complications I dati del DCCT sono stati impropriamente «esportati» al DMT2

6
UKPDS Type 2 DM– microvascular complications p=0.0099 0% 10% 20% 30% 03691215 % of patients with an event Years from randomisation Intensive Conventional Risk reduction 25% (95% CI: 7% to 40%) 1977-97
")
7
Ukpds Study- CHD Relative Risk & HbA 1c 0.5 1 5 0567891011 Updated mean HbA 1c Hazard ratio 14% decrease per 1% HbA 1c decrement, p<0.0001 UKPDS 35. BMJ 2000; 321: 405-12 UKPDS Glucose Study showed: 16% decrease for a 0.9% HbA 1c difference p=0.052 Observational analysis

8
After median 8.5 years post-trial follow-up Aggregate Endpoint 19972007 Any diabetes related endpoint RRR: 12%9% P: 0.029 0.040 Microvascular disease RRR: 25%24% P: 0.00990.001 Myocardial infarction RRR: 16%15% P: 0.0520.014 All-cause mortality RRR: 6%13% P: 0.440.007 RRR = Relative Risk Reduction, P = Log Rank UKPDS: legacy effect of earlier glucose control T intensiva: 2729 soggetti T convenzionale: 1138 soggetti Legacy effect Nel periodo 1997 – 2007 sono state usate altre medicine che potevano avere un loro intrinseco effetto cadiovascolare Riduzione Rischio assoluto 3-4 eventi / 1000 pazienti anno (NNT/anno = 285)
")
9
14% decrease per 10 mmHg SBP decrement, p<0.0001 0.5 1 5 110120130140150160170 Relative Risk for CHD & Blood Pressure Updated mean systolic blood pressure Hazard ratio UKPDS 36. BMJ 2000; 321: 412-19 UKPDS Blood Pressure Study showed: 21% decrease for a 10 mmHg SBP difference Observational analysis

10
UKPDS “This paper reports that patients with hypertension and type 2 diabetes assigned to tight control of blood pressure achieved a significant reduction in risk …(omissis)…………..The mean blood pressure over nine years was 144/82mm Hg on tight control compared with a less tight control mean of 154/87mm Hg” BMJ 1998;317(7160):703-713 UKPDS observational study showed that “risk of diabetic complications was strongly associated with raised blood pressure. Any reduction in blood pressure is likely to reduce the risk of complications, with the lowest risk being in those with systolic blood pressure less than 120 mm Hg.” BMJ 2000;321(7258):412-419
:")
11
European Heart Journal (2010) 31, 2897–2908 doi:10.1093/eurheartj/ehq328 J-curve revisited: an analysis of blood pressure and cardiovascular events in the Treating to New Targets (TNT) Trial
 31, 2897–2908 doi: /eurheartj/ehq328 J-curve revisited: an analysis of blood pressure and cardiovascular events in the Treating to New Targets (TNT) Trial")
12
ACCORD ADVANCE VADT No. of participants10,25111,1401791 Participant age,years626660 Participants – male, %625897 Duration of DM at entry, years 10811.5 A1C at Baseline, %8.17.29.4 Participants with prior CV event, % 353240 Duration of follow-up, years 3.45.06 Statistical difference between groups (P ≤ 0.05)
.")
13
Outcomes, intensive vs. standard intensive vs. standard ACCORD ADVANCE ADVANCE VADT VADT A1C, % A1C, % 6.4 vs. 7.5* 6.4 vs. 7.0* 6.9 vs. 8.4* Death from any cause, % Death from any cause, % 5.0 vs. 4.0* 8.9 vs. 9.6 NA Death from CV event, % Death from CV event, % 2.6 vs. 1.8* 4.5 vs. 5.2 2.1 vs. 1.7 Nonfatal MI, % Nonfatal MI, % 3.6 vs. 4.6* 2.7 vs. 2.8 6.1 vs. 6.3 Major/severe hypoglycemia, % Major/severe hypoglycemia, % 10.5 vs. 3.5* 2.7 vs. 1.5* 21.1 vs. 9.7* Weight gain, kg Weight gain, kg 3.5 vs. 0.4* 0.0 vs. -1.0* NA Statistical difference between groups (P ≤ 0.05) i
 i.")
14
34533 soggetti, 18315 t. intensiva; 16281 t standard Mortalità per tutte le cause Mortalità CV

15
Metanalysis: intensive glucose control in T2DM Turnbull FM et Al Diabetologia (2009)52:2288-98
52:")
16
Figure 1 Diabetes Care, Diabetologia. 19 April 2012 [Epub ahead of print] (Adapted with permission from: Ismail-Beigi F, et al. Ann Intern Med 2011;154:554)
.")
17
Accord Blood Pressure Primary & Secondary Outcomes Intensive Events (%/yr) Standard Events (%/yr)HR (95% CI)P Primary 208 (1.87)237 (2.09)0.88 (0.73-1.06)0.20 Total Mortality 150 (1.28)144 (1.19)1.07 (0.85-1.35)0.55 Cardiovascular Deaths 60 (0.52)58 (0.49)1.06 (0.74-1.52)0.74 Nonfatal MI 126 (1.13)146 (1.28)0.87 (0.68-1.10)0.25 Nonfatal Stroke 34 (0.30)55 (0.47)0.63 (0.41-0.96)0.03 Total Stroke 36 (0.32)62 (0.53)0.59 (0.39-0.89)0.01 Also examined Fatal/Nonfatal HF (HR=0.94, p=0.67), a composite of fatal coronary events, nonfatal MI and unstable angina (HR=0.94, p=0.50) and a composite of the primary outcome, revascularization and unstable angina (HR=0.95, p=0.40)
 Standard Events (%/yr)HR (95% CI)P Primary 208 (1.87)237 (2.09)0.88 ( )0.20 Total Mortality 150 (1.28)144 (1.19)1.07 ( )0.55 Cardiovascular Deaths 60 (0.52)58 (0.49)1.06 ( )0.74 Nonfatal MI 126 (1.13)146 (1.28)0.87 ( )0.25 Nonfatal Stroke 34 (0.30)55 (0.47)0.63 ( )0.03 Total Stroke 36 (0.32)62 (0.53)0.59 ( )0.01 Also examined Fatal/Nonfatal HF (HR=0.94, p=0.67), a composite of fatal coronary events, nonfatal MI and unstable angina (HR=0.94, p=0.50) and a composite of the primary outcome, revascularization and unstable angina (HR=0.95, p=0.40)")
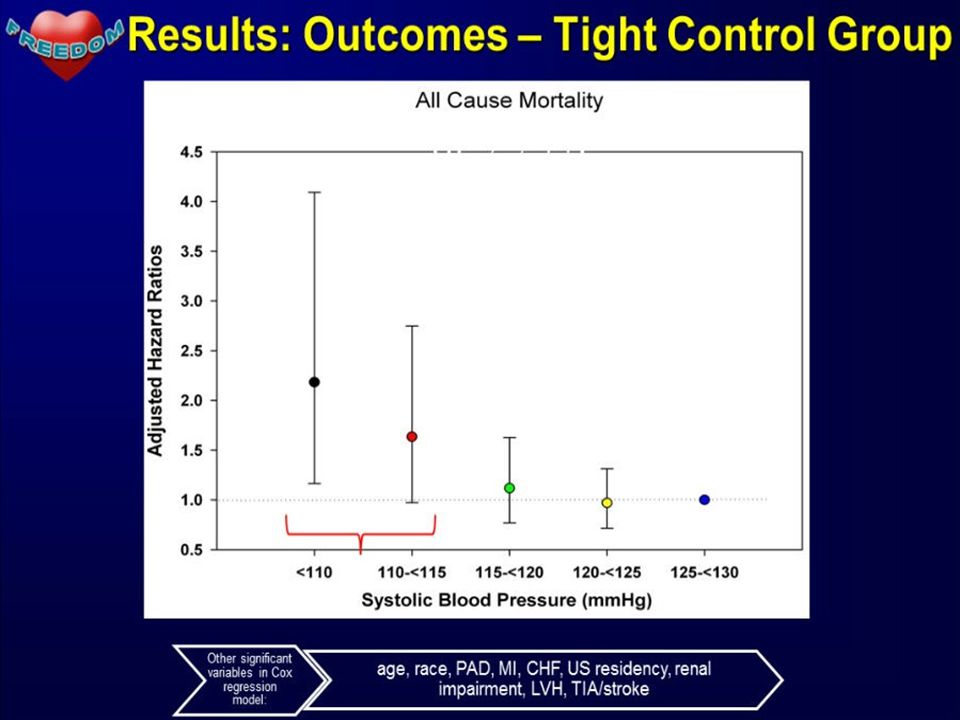
18
Average after 1 st year: 133.5 Standard vs. 119.3 Intensive, Delta = 14.2 Mean # Meds Intensive: 3.2 3.4 3.5 3.4 Standard: 1.9 2.1 2.2 2.3

19
* * * *

21
VariabileIMA fatale+ nonfatale +morte improvvisa Ictus (tutti)Malattia CV Colesterolo (1mmol/l) Dati Epidemiologici (%) -30-10 Studi intervento (%) -23-17 NNT per 5 aa 59.2177.744.4 Pressione arteriosa (10/5 mmHg) Dati Epidemiologici (%) -25-36 Studi intervento (%) -22-41 NNT per 5 aa 61.873.733.6 Glicemia (HbA1c 0.9%; 10 mmol) Dati Epidemiologici (%) -12-15 Studi intervento (%) -9.7-4.0 NNT per 5 aa 140.3767.7118.5 J. S. Yudkin & B. Richter & E. A. M. Gale. Intensified glucose lowering in type 2 diabetes: time for a reappraisal. Diabetologia (2010) 53:2079–2085 Rapporti epidemiologici ed interventistici tra Colesterolo, Pressione arteriosa, HbA1c e malattia CV
 53:2079–2085 Rapporti epidemiologici ed interventistici tra Colesterolo, Pressione arteriosa, HbA1c e malattia CV.")
22
Cu' tanta galle a canta', nun fa' maje juorno. Non esiste prova definitiva che riducendo indiscriminatamente la glicemia e la HbA1c si stia riducendo il danno CV. Anzi si potrebbe aumentare la mortalità Non esiste prova che riducendo la PA al di sotto di 140/80 mmHg si stia riducendo il danno CV. Anzi si potrebbe aumentare la mortalità La miglior dote del medico rimane il buon senso, non le linee guida

Presentazioni simili


 Base: 1.000.>")


 che si colloca tra le prime.>")

 19/12/2012>")

, 21-27 Agosto 2011 D. Bollati, 21/09/2011.>")


 Definizione e proprietà>")


