Scaricare la presentazione
La presentazione è in caricamento. Aspetta per favore

1
LE CARDIOPATIE AL FEMMINILE
Paola Gottardello Roberto Verlato U.O.C. Cardiologia Cittadella, 14 novembre 2013

3
PRINCIPALI PATOLOGIE CARDIOVASCOLARI
MALATTIA CORONARICA FIBRILLAZIONE ATRIALE - rischio embolico cerebrale -scompenso cardiaco SCOMPENSO CARDIACO I fattori di rischio per queste patologie sono gli stessi, e la cardiopatia ischemica è causa del 50% dei casi di scompenso cardiaco. Il 50% dei casi di scompenso cardiaco si complicano con fibrillazione atriale. Tutti e tre costituiscono FR di rischio maggiori per stroke Le TRE principali patologie CV sono…. Sono tra loro strettamente correlate ed intersecate in numerosi pazienti. Ad esempio la malattia coronarica è causa del 50% dei casi di scompenso,, che si compolicheranno a loro volta con una fibrillazione atriale…Tutte e tre queste patologie costituiscono FATTORI DI RISCHIO INDIPENDENTI per ICTUS.

4
FIBRILLAZIONE ATRIALE
E’ L’ARITMIA PIU’ FREQUENTE E TRA LE PIU’ PERICOLOSE PERCHE’ PUO’ DECORRERE POCO O PER NULLA AVVERTITA DAL PZ E MANIFESTARSI CON COMPLICANZE GRAVI COME SCOMPENSO CARDIACO E SOPRATTUTTO EMBOLIE SISTEMICHE E POLMONARI (spesso diagnosticate come broncopolmoniti)
")
5
FIBRILLAZIONE ATRIALE : EPIDEMIOLOGIA
Prevalenza nella popolazione genrale La prevalenza assoluta, cioè il numero totale di soggetti che presentano il problema ogni anno anno è intorno all’1% della popolazione, MA RECENTI STIME IN EUROPA RIPORTANO UNA PREVALENZA ADDIRITTURA IN AVVICINAMENTO AL 2% DELLA POPOLAZIONE TOTALE . QUINDI PATOLOGIA IN GRANDE AUMENTO

6
Prevalenza stratificata per età e sesso
Raddoppia ad ogni decade, < nella donna LA PREVALENZA RADDOPPIA AD OGNI DECADE COME E’ BEN ILLUSTRATO IN QUESTA DIA; 1% < 60 ANNI, 3% 60-70, 7% 7-80 ANNI ETC . QUINDI L’ETA’ E’ IL PIU’ IMPORTANTE FATTORE DI RISCHIO. DATO CHE LA VITA MEDIA DELLE DONNE è MAGGIORE..PIU’ DONNE DI Età AVANZATA SI PRESENTANO CON FIBRILLAZIONE ATRIALE.

7
RISCHIO DI SVILUPPARE FIBRILLAZIONE ATRIALE
Il rischio di sviluppare FA è lievemente superiore negli uomini che non nelle donne..

8
La fibrillazione atriale e’ associata a:
Aumentata mortalità totale e cardiovascolare ad ogni età, in maschi e femmine Embolie sistemiche e cerebrali Scompenso cardiaco Ridotta QoL

9
IMPATTO DELLA FIBRILLAZIONE ATRIALE SULLA MORTALITA’: FRAMINGHAM STUDY
Già nel 1998 venivano pubblicate le curve di sopravvivenza della popolazione di framingham con e senza FA. Le curve sono clamorosamente divergenti; la FA rappresenta un importante fattore negativo sulla sopravvivenza ( le cause sono scompenso e stroke); questo sia negli uomini che nelle donne.
; questo sia negli uomini che nelle donne.")
10
GENERE FEMMINILE E RISCHIO DI MORTE NELLA FIBRILLAZIONE ATRIALE IN SVEZIA
In anni piu’ recenti, 2012, in EUROPA e non in USA SONO STAT EPUBBLICATE QUESTE CURVE DI SOPRAVVIVENZA. LA FA ha un forte impatto negativo sulla sopravvivenza in tutte le fascie di età, l’effetto maggiormente negativo si osserva nelle donne ANZIANE, < 75 anni. Per questo l’età > 75 anni è stata inserita tra i criteri di rischio MAGGIORI per stroke, assieme al SESSO FEMMINILE.

11
FA e stroke Fibrillazione atriale: rischio embolico
Incidenza media di stroke in pz con FA: 4.5%/anno Rischio 4-5 più alto dei pz senza FA 10-15% di tutti gli stroke ischemici Evento disabilitante e con maggior rischio di morte

12
Fibrillazione atriale: rischio embolico
Il rischio tromboembolico non è uniforme ma cresce esponenzialmente con la presenza di fattori clinici aggiuntivi a prescindere dal tipo di FA (parox, pers o perm) CHADS2 score Risk factor Individual score None C (recent CHF) 1 H (hypertension) A (age) D (diabetes mellitus) S2 (hystory of stroke or TIA) 2
 CHADS2 score. Risk factor. Individual score. None. C (recent CHF) 1. H (hypertension) A (age) D (diabetes mellitus) S2 (hystory of stroke or TIA) 2.")
13
Fattori di rischio embolico
Fibrillazione atriale: rischio embolico Fattori di rischio embolico Fattori di rischio maggiori Pregresso ictus Pregresso TIA o episodio embolico periferico Età ≥75 a Fattori di rischio clinicamente rilevanti (non maggiori) Insufficienza cardiaca o disfunzione ventricolare sn (FE ≤40%) Ipertensione arteriosa Diabete mellito Età a Sesso femminile Malattie vascolari (inclusa c. ischemica) Eur Heart J 2010;31:
 Insufficienza cardiaca o disfunzione ventricolare sn (FE ≤40%) Ipertensione arteriosa. Diabete mellito. Età a. Sesso femminile. Malattie vascolari (inclusa c. ischemica) Eur Heart J 2010;31:")
14
Fibrillazione atriale: rischio embolico
CHA2DS2-VASc score Eur Heart J 2010;31:

15
FIBRILLAZIONE ATRIALE: TROMBI IN AURICOLA SX E IN ATRIO SX

16
diffusione pesata (DW)
MRI diffusione pesata (DW) Aree ischemiche “silenti”, come conseguenza di microembolie asintomatiche o pauci-sintomatiche sono molto frequenti nei soggetti con FA non in TAO
 Aree ischemiche silenti , come conseguenza di microembolie asintomatiche o pauci-sintomatiche sono molto frequenti nei soggetti con FA non in TAO.")
17
FIBRILLAZIONE ATRIALE E RISCHIO CARDIOEMBOLICO CEREBRALE

18
IN QUESTO RECENTE STUDIO IL 18-31% DEI CASI DI ICTUS SONO STATI CAUSATI FIBRILLAZIONE ATRIALE ASINTOMATICA O DI BREVE DURATA (2600 pts)
")
19
Prevalence of stroke by age and sex (National Health and Nutrition Examination Survey: 2007–2010).
Prevalence of stroke by age and sex (National Health and Nutrition Examination Survey: 2007–2010). Source: National Center for Health Statistics and National Heart, Lung, and Blood Institute. Go A et al. Circulation 2013;127:e6-e245 Copyright © American Heart Association
. Source: National Center for Health Statistics and National Heart, Lung, and Blood Institute. Go A et al. Circulation 2013;127:e6-e245. Copyright © American Heart Association.")
20
Annual rate of first cerebral infarction by age, sex, and race (Greater Cincinnati/Northern Kentucky Stroke Study: 1999). Annual rate of first cerebral infarction by age, sex, and race (Greater Cincinnati/Northern Kentucky Stroke Study: 1999). Rates for black men and women 45 to 54 years of age and for black men ≥75 years of age are considered unreliable. Source: Unpublished data from the Greater Cincinnati/Northern Kentucky Stroke Study. Go A et al. Circulation 2013;127:e6-e245 Copyright © American Heart Association
. Rates for black men and women 45 to 54 years of age and for black men ≥75 years of age are considered unreliable. Source: Unpublished data from the Greater Cincinnati/Northern Kentucky Stroke Study. Go A et al. Circulation 2013;127:e6-e245. Copyright © American Heart Association.")
21
Estimated 10-year stroke risk in adults 55 to 84 years of age according to levels of various risk factors (Framingham Heart Study). Estimated 10-year stroke risk in adults 55 to 84 years of age according to levels of various risk factors (Framingham Heart Study). AF indicates atrial fibrillation; CVD, cardiovascular disease. Data derived from Wolf et al176 with permission of the publisher. Copyright © 1991, American Heart Association. Go A et al. Circulation 2013;127:e6-e245 Copyright © American Heart Association
. AF indicates atrial fibrillation; CVD, cardiovascular disease. Data derived from Wolf et al176 with permission of the publisher. Copyright © 1991, American Heart Association. Go A et al. Circulation 2013;127:e6-e245. Copyright © American Heart Association.")
22
Proportion of patients dead within 5 years after first stroke.
Proportion of patients dead within 5 years after first stroke. Source: Pooled data from the Framingham Heart Study, Atherosclerosis Risk in Communities study, and Cardiovascular Health Study of the National Heart, Lung, and Blood Institute. Go A et al. Circulation 2013;127:e6-e245 Copyright © American Heart Association

23
SCOMPENSO CARDIACO Patologia in grande aumento. A livello epidemico
Prevalenza 2% della popolazione Principale causa di ricovero per DRG medico in Europa ed USA negli ultimi anni

24
Prevalence of heart failure by sex and age (National Health and Nutrition Examination Survey: 2007–2010). Prevalence of heart failure by sex and age (National Health and Nutrition Examination Survey: 2007–2010). Source: National Center for Health Statistics and National Heart, Lung, and Blood Institute. Go A et al. Circulation 2013;127:e6-e245 Copyright © American Heart Association
. Source: National Center for Health Statistics and National Heart, Lung, and Blood Institute. Go A et al. Circulation 2013;127:e6-e245. Copyright © American Heart Association.")
25
Incidence of heart failure (heart failure based on physician review of medical records and strict diagnostic criteria) by age and sex (Framingham Heart Study: 1980–2003). Incidence of heart failure (heart failure based on physician review of medical records and strict diagnostic criteria) by age and sex (Framingham Heart Study: 1980–2003). Source: National Heart, Lung, and Blood Institute. Go A et al. Circulation 2013;127:e6-e245 Copyright © American Heart Association
 by age and sex (Framingham Heart Study: 1980–2003). Source: National Heart, Lung, and Blood Institute. Go A et al. Circulation 2013;127:e6-e245. Copyright © American Heart Association.")
26
Hospital discharges for heart failure by sex (United States: 1980–2010).
Hospital discharges for heart failure by sex (United States: 1980–2010). Note: Hospital discharges include people discharged alive, dead, and status unknown. Source: National Hospital Discharge Survey/National Center for Health Statistics and National Heart, Lung, and Blood Institute. Go A et al. Circulation 2013;127:e6-e245 Copyright © American Heart Association
. Note: Hospital discharges include people discharged alive, dead, and status unknown. Source: National Hospital Discharge Survey/National Center for Health Statistics and National Heart, Lung, and Blood Institute. Go A et al. Circulation 2013;127:e6-e245. Copyright © American Heart Association.")
28
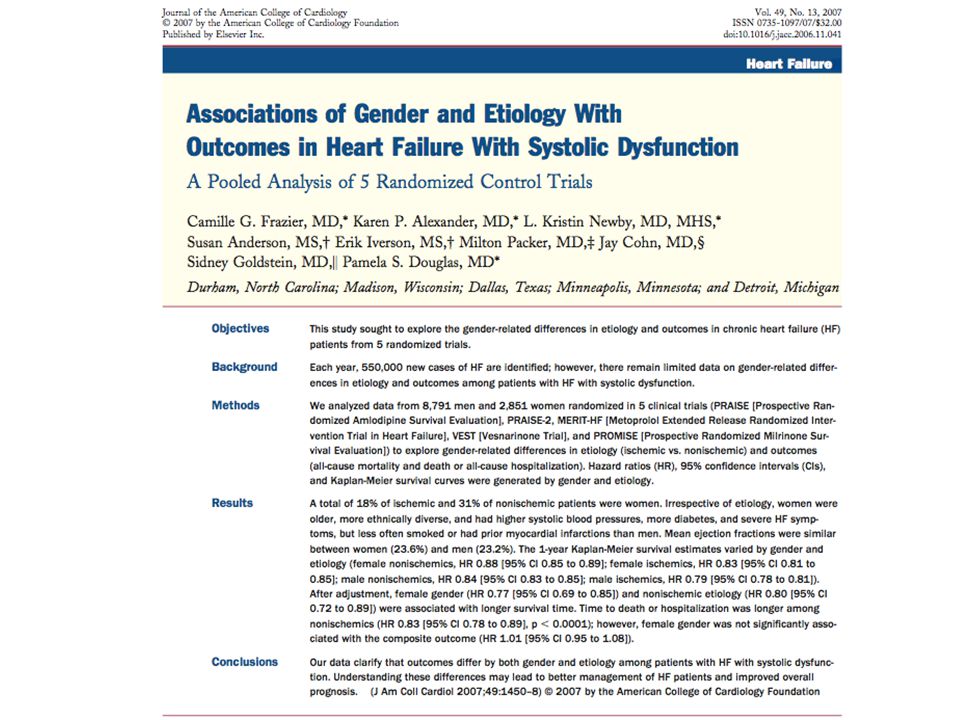
Eziologia dello scompenso cardiaco in 5 trials randomizzati
CARDIOPATIA ISCHEMICA, DONNE: 18% CARDIOPATIA NON ISCHEMICA: % > ETA’ , >DIABETE, > IPERTENSIONE, NYHA AVANZATA NELLE DONNE VS UOMINI MORTALITA’ CORRELATA AL GENERE ED EZIOLOGIA

29
LA SOPRAVVIVENZA E’ MIGLIORE NELLE DONNE, CON EZIOLOGIA NON ISCHEMICA vs GLI UOMINI.
NESSUNA DIFFERENZA DI GENERE, E PROGNOSI PEGGIORE (mortalità > 15% per anno) PER L’EZIOLOGIA ISCHEMICA
 PER L’EZIOLOGIA ISCHEMICA.")
30
MORTALITA’ SIGNIFICATIVAMENTE INFERIORE NELLE DONNE CON NISCM, MA ENDPOINT COMPOSITO IDENTICO

31
TASSO DI OSPEDALIZZAZIONE PER WHS NELLA DONNA IDENTICO A QUELLO DEGLI UOMINI, SIA CON CARDIOPATIA ISCHEMICA CHE NON ISCHEMICA

32
CARDIOPATIA ISCHEMICA
LA MALATTIA CORONARICA E’ LA PIU’ FREQUENTE MALATTIA CARDIOVASCOLARE ANCHE NELLA DONNA. ALCUNE PECULIARITA’ DI QUESTA PATOLOGIA NEL SESSO FEMMINILE SONO: -NETTO AUMENTO DI FREQUENZA DOPO LA MENOPAUSA -SINTOMI ATIPICI PIU’ SPESSO CHE NEGLI UOMINI -MAGGIOR PREVALENZA DI ANGINA VASOSPASTICA - SD DI TSAKO-TSUBO (miocardiopatia acuta da stress)
")
33
Coronaronarie delle donne: piu’ esili, tortuose, con un minor numero di collaterali

34
FATTORI DI RISCHIO CARDIOVASCOLARE
Trends in prevalence (unadjusted) of meeting criteria for Ideal Cardiovascular Health, for each of the 7 metrics of cardiovascular health in the American Heart Association 2020 goals, among US children aged 12 to 19 years, National Health and Nutrition Exam... Trends in prevalence (unadjusted) of meeting criteria for Ideal Cardiovascular Health, for each of the 7 metrics of cardiovascular health in the American Heart Association 2020 goals, among US children aged 12 to 19 years, National Health and Nutrition Examination Survey (NHANES) through *† (available data as of June 1, 2012). *Due to changes in the physical activity questionnaire between different cycles of the NHANES survey, trends over time for this indicator should be interpreted with caution and statistical comparisons should not be attempted. †Data for the Healthy Diet Score, based on a 2-day average intake, was only available for the , , and NHANES cycles at the time of this analysis. FUMO, OBESITA’, COLESTEROLEMIA, IPERTENSIONE, IPERGLICEMIA, ASSENZA DI ATTIVITA’ FISICA SONO I FATTORI DI RISCHIO PRINCIPALI…CON L’UNICA ECCEZIONE DELL’ATTIVITA’ FISICA, CHE SEMBRA IN AUMENTO, GLI ALTRI FR SONO STABILI TRA LE NUOVE GENERAZIONI. Go A et al. Circulation 2013;127:e6-e245 Copyright © American Heart Association
 of meeting criteria for Ideal Cardiovascular Health, for each of the 7 metrics of cardiovascular health in the American Heart Association 2020 goals, among US children aged 12 to 19 years, National Health and Nutrition Exam... Trends in prevalence (unadjusted) of meeting criteria for Ideal Cardiovascular Health, for each of the 7 metrics of cardiovascular health in the American Heart Association 2020 goals, among US children aged 12 to 19 years, National Health and Nutrition Examination Survey (NHANES) through *† (available data as of June 1, 2012). *Due to changes in the physical activity questionnaire between different cycles of the NHANES survey, trends over time for this indicator should be interpreted with caution and statistical comparisons should not be attempted. †Data for the Healthy Diet Score, based on a 2-day average intake, was only available for the , , and NHANES cycles at the time of this analysis. FUMO, OBESITA’, COLESTEROLEMIA, IPERTENSIONE, IPERGLICEMIA, ASSENZA DI ATTIVITA’ FISICA SONO I FATTORI DI RISCHIO PRINCIPALI…CON L’UNICA ECCEZIONE DELL’ATTIVITA’ FISICA, CHE SEMBRA IN AUMENTO, GLI ALTRI FR SONO STABILI TRA LE NUOVE GENERAZIONI. Go A et al. Circulation 2013;127:e6-e245. Copyright © American Heart Association.")
35
Diabetes mellitus awareness, treatment, and control (National Health and Nutrition Examination Survey: 2007–2010). Diabetes mellitus awareness, treatment, and control (National Health and Nutrition Examination Survey: 2007–2010). Source: National Heart, Lung, and Blood Institute. Go A et al. Circulation 2013;127:e6-e245 Copyright © American Heart Association
. Source: National Heart, Lung, and Blood Institute. Go A et al. Circulation 2013;127:e6-e245. Copyright © American Heart Association.")
36
Oltre a questi FRCV modificabili, ce ne sono altri 2 NON MODIFICABILI
ETA’: correlazione lineare con le patologie CV SESSO: il sesso maschile rappresenta un FRCV aggiuntivo, per un effetto protettivo degli estrogeni nella donna, che viene perso dopo la menopausa. Per questo le patologie CV , in particolare la C.I., si presentano con una decade di ritardo circa nel sesso femminile, ma dopo i aa le differenze si riducono

37
Prevalence of coronary heart disease by age and sex (National Health and Nutrition Examination Survey: 2007–2010). Prevalence of coronary heart disease by age and sex (National Health and Nutrition Examination Survey: 2007–2010). Source: National Center for Health Statistics and National Heart, Lung, and Blood Institute. Go A et al. Circulation 2013;127:e6-e245 Copyright © American Heart Association
. Source: National Center for Health Statistics and National Heart, Lung, and Blood Institute. Go A et al. Circulation 2013;127:e6-e245. Copyright © American Heart Association.")
38
Prevalence of myocardial infarction by age and sex (National Health and Nutrition Examination Survey: 2007–2010). Prevalence of myocardial infarction by age and sex (National Health and Nutrition Examination Survey: 2007–2010). Myocardial infarction includes people who answered "yes" to the question of ever having had a heart attack or myocardial infarction. Source: National Center for Health Statistics and National Heart, Lung, and Blood Institute. Go A et al. Circulation 2013;127:e6-e245 Copyright © American Heart Association
. Myocardial infarction includes people who answered yes to the question of ever having had a heart attack or myocardial infarction. Source: National Center for Health Statistics and National Heart, Lung, and Blood Institute. Go A et al. Circulation 2013;127:e6-e245. Copyright © American Heart Association.")
39
Annual number of adults having diagnosed heart attack or fatal coronary heart disease (CHD) by age and sex –(Atherosclerosis Risk in Communities Surveillance: 2004–2009 and Cardiovascular Health Study). Annual number of adults having diagnosed heart attack or fatal coronary heart disease (CHD) by age and sex –(Atherosclerosis Risk in Communities Surveillance: 2004–2009 and Cardiovascular Health Study). These data include myocardial –infarction (MI) and fatal CHD but not silent MI. Source: National Heart, Lung, and Blood Institute. Go A et al. Circulation 2013;127:e6-e245 Copyright © American Heart Association
 by age and sex –(Atherosclerosis Risk in Communities Surveillance: 2004–2009 and Cardiovascular Health Study). These data include myocardial –infarction (MI) and fatal CHD but not silent MI. Source: National Heart, Lung, and Blood Institute. Go A et al. Circulation 2013;127:e6-e245. Copyright © American Heart Association.")
40
Incidence of heart attack or fatal coronary heart disease by age, sex, and race (Atherosclerosis Risk in Communities Surveillance: 2004–2009*). Incidence of heart attack or fatal coronary heart disease by age, sex, and race (Atherosclerosis Risk in Communities Surveillance: 2004–2009*). Source: National Heart, Lung, and Blood Institute. *2005–2009 for ages 75–84 years. Go A et al. Circulation 2013;127:e6-e245 Copyright © American Heart Association
. Source: National Heart, Lung, and Blood Institute. *2005–2009 for ages 75–84 years. Go A et al. Circulation 2013;127:e6-e245. Copyright © American Heart Association.")
41
Estimated 10-year coronary heart disease risk in adults 55 years of age according to levels of various risk factors –(Framingham Heart Study). Estimated 10-year coronary heart disease risk in adults 55 years of age according to levels of various risk factors –(Framingham Heart Study). HDL-C indicates high density lipoprotein-cholesterol. Data derived from Wilson et al.51 Go A et al. Circulation 2013;127:e6-e245 Copyright © American Heart Association
. HDL-C indicates high density lipoprotein-cholesterol. Data derived from Wilson et al.51. Go A et al. Circulation 2013;127:e6-e245. Copyright © American Heart Association.")
42
Hospital discharges for coronary heart disease by sex (United States: 1970–2010).
Hospital discharges for coronary heart disease by sex (United States: 1970–2010). Hospital discharges include people discharged alive, dead, and “status unknown.” Source: National Hospital Discharge Survey/National Center for Health Statistics and National Heart, Lung, and Blood Institute. Go A et al. Circulation 2013;127:e6-e245 Copyright © American Heart Association
. Hospital discharges include people discharged alive, dead, and status unknown. Source: National Hospital Discharge Survey/National Center for Health Statistics and National Heart, Lung, and Blood Institute. Go A et al. Circulation 2013;127:e6-e245. Copyright © American Heart Association.")
45
US age-standardized death rates
US age-standardized death rates* from cardiovascular diseases, *Directly standardized to the age distribution of the 2000 US standard population. †Total CVD (Cardiovascular Disease): ICD-10 I00-I99, Q20-Q28. §Stroke (All cerebrovascular disease):... US age-standardized death rates* from cardiovascular diseases, *Directly standardized to the age distribution of the 2000 US standard population. †Total CVD (Cardiovascular Disease): ICD-10 I00-I99, Q20-Q28. §Stroke (All cerebrovascular disease): ICD-10 I60-I69. ∥CHD (Coronary Heart Disease): ICD-10 I20-I25. **Other CVD: ICD-10 I00 –I15, I26 –I51, I70 –I78, I80 –I89, I95–I99. Source: Centers for Disease Control and Prevention, National Center for Health Statistics. Multiple Cause of Death on CDC WONDER Online Database, released Data for year 2009 are compiled from the Multiple Cause of Death File 2009, Series 20 No. 2O, 2012, data for year 2008 are compiled from the Multiple Cause of Death File 2008, Series 20 No. 2N, 2011, data for year 2007 are compiled from the Multiple Cause of Death File 2007, Series 20 No. 2M, 2010, data for years data are compiled from Multiple Cause of Death File , Series 20, No. 2L, 2009, and data for years are compiled from the Multiple Cause of Death File , Series 20, No. 2J, Accessed October 9, 2012. Go A et al. Circulation 2013;127:e6-e245 Copyright © American Heart Association
: ICD-10 I00-I99, Q20-Q28. §Stroke (All cerebrovascular disease):... US age-standardized death rates* from cardiovascular diseases, *Directly standardized to the age distribution of the 2000 US standard population. †Total CVD (Cardiovascular Disease): ICD-10 I00-I99, Q20-Q28. §Stroke (All cerebrovascular disease): ICD-10 I60-I69. ∥CHD (Coronary Heart Disease): ICD-10 I20-I25. **Other CVD: ICD-10 I00 –I15, I26 –I51, I70 –I78, I80 –I89, I95–I99. Source: Centers for Disease Control and Prevention, National Center for Health Statistics. Multiple Cause of Death on CDC WONDER Online Database, released Data for year 2009 are compiled from the Multiple Cause of Death File 2009, Series 20 No. 2O, 2012, data for year 2008 are compiled from the Multiple Cause of Death File 2008, Series 20 No. 2N, 2011, data for year 2007 are compiled from the Multiple Cause of Death File 2007, Series 20 No. 2M, 2010, data for years data are compiled from Multiple Cause of Death File , Series 20, No. 2L, 2009, and data for years are compiled from the Multiple Cause of Death File , Series 20, No. 2J, Accessed October 9, Go A et al. Circulation 2013;127:e6-e245. Copyright © American Heart Association.")
46
Prevalence (%) of students in grades 9 to 12 reporting current cigarette use by sex and race/ethnicity (Youth Risk Behavior Surveillance System, 2011). Prevalence (%) of students in grades 9 to 12 reporting current cigarette use by sex and race/ethnicity (Youth Risk Behavior Surveillance System, 2011). NH indicates non-Hispanic. Data derived from MMWR: Morbidity and Mortality Weekly Report.1 Go A et al. Circulation 2013;127:e6-e245 Copyright © American Heart Association
 of students in grades 9 to 12 reporting current cigarette use by sex and race/ethnicity (Youth Risk Behavior Surveillance System, 2011). NH indicates non-Hispanic. Data derived from MMWR: Morbidity and Mortality Weekly Report.1. Go A et al. Circulation 2013;127:e6-e245. Copyright © American Heart Association.")
47
Prevalence (%) of current smoking for adults >18 years of age by race/ethnicity and sex (National Health Interview Survey: 2008–2010). Prevalence (%) of current smoking for adults >18 years of age by race/ethnicity and sex (National Health Interview Survey: 2008–2010). All percentages are age-adjusted. NH indicates non-Hispanic. *Includes both Hispanics and non-Hispanics. Data derived from Centers for Disease Control and Prevention/National Center for Health Statistics, Health Data Interactive.9 Go A et al. Circulation 2013;127:e6-e245 Copyright © American Heart Association
 of current smoking for adults >18 years of age by race/ethnicity and sex (National Health Interview Survey: 2008–2010). All percentages are age-adjusted. NH indicates non-Hispanic. *Includes both Hispanics and non-Hispanics. Data derived from Centers for Disease Control and Prevention/National Center for Health Statistics, Health Data Interactive.9. Go A et al. Circulation 2013;127:e6-e245. Copyright © American Heart Association.")
48
Prevalence of students in grades 9 to 12 who did not participate in at least 60 minutes of physical activity on any day by race/ethnicity and sex (Youth Risk Behavior Surveillance: 2011). Prevalence of students in grades 9 to 12 who did not participate in at least 60 minutes of physical activity on any day by race/ethnicity and sex (Youth Risk Behavior Surveillance: 2011). NH indicates non-Hispanic. Data derived from MMWR Surveillance Summaries.1 Go A et al. Circulation 2013;127:e6-e245 Copyright © American Heart Association
. NH indicates non-Hispanic. Data derived from MMWR Surveillance Summaries.1. Go A et al. Circulation 2013;127:e6-e245. Copyright © American Heart Association.")
49
Prevalence of overweight and obesity among students in grades 9 through 12 by sex and race/ethnicity. Prevalence of overweight and obesity among students in grades 9 through 12 by sex and race/ethnicity. NH indicates non-Hispanic. Data derived from Youth Risk Behavior Surveillance—United States, 2011, Table Go A et al. Circulation 2013;127:e6-e245 Copyright © American Heart Association

50
Age-adjusted prevalence of obesity in adults 20 to 74 years of age by sex and survey year (National Health Examination Survey: 1960–1962; National Health and Nutrition Examination Survey: 1971–1974, 1976–1980, 1988–1994, 1999–2002, and 2007–2010). Age-adjusted prevalence of obesity in adults 20 to 74 years of age by sex and survey year (National Health Examination Survey: 1960–1962; National Health and Nutrition Examination Survey: 1971–1974, 1976–1980, 1988–1994, 1999–2002, and 2007–2010). Obesity is defined as body mass index of 30.0 kg/m2. Data derived from Health, United States, 2011 (National Center for Health Statistics).67 Go A et al. Circulation 2013;127:e6-e245 Copyright © American Heart Association
. Obesity is defined as body mass index of 30.0 kg/m2. Data derived from Health, United States, 2011 (National Center for Health Statistics).67. Go A et al. Circulation 2013;127:e6-e245. Copyright © American Heart Association.")
51
Age-adjusted trends in the prevalence of total serum cholesterol ≥200 mg/dL in adults ≥20 years of age by sex, race/ethnicity, and survey year (National Health and Nutrition Examination Survey 2005–2006, 2007–2008, and 2009–2010). Age-adjusted trends in the prevalence of total serum cholesterol ≥200 mg/dL in adults ≥20 years of age by sex, race/ethnicity, and survey year (National Health and Nutrition Examination Survey 2005–2006, 2007–2008, and 2009–2010). NH indicates non-Hispanic; Mex. Am., Mexican American. Go A et al. Circulation 2013;127:e6-e245 Copyright © American Heart Association
. NH indicates non-Hispanic; Mex. Am., Mexican American. Go A et al. Circulation 2013;127:e6-e245. Copyright © American Heart Association.")
52
Prevalence of high blood pressure in adults ≥20 years of age by age and sex (National Health and Nutrition Examination Survey: 2007–2010). Prevalence of high blood pressure in adults ≥20 years of age by age and sex (National Health and Nutrition Examination Survey: 2007–2010). Hypertension is defined as systolic blood pressure ≥140 mm Hg or diastolic blood pressure ≥90 mm Hg, if the subject said “yes” to taking antihypertensive medication, or if the subject was told on 2 occasions that he or she had hypertension. Source: National Center for Health Statistics and National Heart, Lung, and Blood Institute. Go A et al. Circulation 2013;127:e6-e245 Copyright © American Heart Association
. Hypertension is defined as systolic blood pressure ≥140 mm Hg or diastolic blood pressure ≥90 mm Hg, if the subject said yes to taking antihypertensive medication, or if the subject was told on 2 occasions that he or she had hypertension. Source: National Center for Health Statistics and National Heart, Lung, and Blood Institute. Go A et al. Circulation 2013;127:e6-e245. Copyright © American Heart Association.")
53
Extent of awareness, treatment, and control of high blood pressure by race/ethnicity and sex (National Health and Nutrition Examination Survey: 2007–2010). Extent of awareness, treatment, and control of high blood pressure by race/ethnicity and sex (National Health and Nutrition Examination Survey: 2007–2010). NH indicates non-Hispanic. Source: National Center for Health Statistics and National Heart, Lung, and Blood Institute. Go A et al. Circulation 2013;127:e6-e245 Copyright © American Heart Association
. NH indicates non-Hispanic. Source: National Center for Health Statistics and National Heart, Lung, and Blood Institute. Go A et al. Circulation 2013;127:e6-e245. Copyright © American Heart Association.")
54
Age-adjusted prevalence of physician-diagnosed diabetes mellitus in adults ≥20 years of age by race/ethnicity and sex (National Health and Nutrition Examination Survey: 2007–2010). Age-adjusted prevalence of physician-diagnosed diabetes mellitus in adults ≥20 years of age by race/ethnicity and sex (National Health and Nutrition Examination Survey: 2007–2010). NH indicates non-Hispanic. Source: National Center for Health Statistics and National Heart, Lung, and Blood Institute. Go A et al. Circulation 2013;127:e6-e245 Copyright © American Heart Association
. NH indicates non-Hispanic. Source: National Center for Health Statistics and National Heart, Lung, and Blood Institute. Go A et al. Circulation 2013;127:e6-e245. Copyright © American Heart Association.")
55
Age-adjusted prevalence of physician-diagnosed type 2 diabetes mellitus in adults ≥20 years of age by race/ethnicity and years of education (National Health and Nutrition Examination Survey: 2007–2010). Age-adjusted prevalence of physician-diagnosed type 2 diabetes mellitus in adults ≥20 years of age by race/ethnicity and years of education (National Health and Nutrition Examination Survey: 2007–2010). NH indicates non-Hispanic. Source: National Center for Health Statistics and National Heart, Lung, and Blood Institute. Go A et al. Circulation 2013;127:e6-e245 Copyright © American Heart Association
. NH indicates non-Hispanic. Source: National Center for Health Statistics and National Heart, Lung, and Blood Institute. Go A et al. Circulation 2013;127:e6-e245. Copyright © American Heart Association.")
56
Trends in diabetes mellitus prevalence in adults ≥20 years of age by sex (National Health and Nutrition Examination Survey: 1988–1994 and 2007–2010). Trends in diabetes mellitus prevalence in adults ≥20 years of age by sex (National Health and Nutrition Examination Survey: 1988–1994 and 2007–2010). Source: National Center for Health Statistics, National Heart, Lung, and Blood Institute. Go A et al. Circulation 2013;127:e6-e245 Copyright © American Heart Association
. Source: National Center for Health Statistics, National Heart, Lung, and Blood Institute. Go A et al. Circulation 2013;127:e6-e245. Copyright © American Heart Association.")
57
Prevalence of cardiovascular disease in adults ≥20 years of age by age and sex (National Health and Nutrition Examination Survey: 2007–2010). Prevalence of cardiovascular disease in adults ≥20 years of age by age and sex (National Health and Nutrition Examination Survey: 2007–2010). Source: National Center for Health Statistics and National Heart, Lung, and Blood Institute. These data include coronary heart disease, heart failure, stroke, and hypertension. Go A et al. Circulation 2013;127:e6-e245 Copyright © American Heart Association
. Source: National Center for Health Statistics and National Heart, Lung, and Blood Institute. These data include coronary heart disease, heart failure, stroke, and hypertension. Go A et al. Circulation 2013;127:e6-e245. Copyright © American Heart Association.")
58
Incidence of cardiovascular disease
Incidence of cardiovascular disease* by age and sex (Framingham Heart Study, 1980–2003). *Coronary heart disease, heart failure, stroke, or intermittent claudication. Incidence of cardiovascular disease* by age and sex (Framingham Heart Study, 1980–2003). *Coronary heart disease, heart failure, stroke, or intermittent claudication. Does not include hypertension alone. Source: National Heart, Lung, and Blood Institute.4 Go A et al. Circulation 2013;127:e6-e245 Copyright © American Heart Association
. *Coronary heart disease, heart failure, stroke, or intermittent claudication. Incidence of cardiovascular disease* by age and sex (Framingham Heart Study, 1980–2003). *Coronary heart disease, heart failure, stroke, or intermittent claudication. Does not include hypertension alone. Source: National Heart, Lung, and Blood Institute.4. Go A et al. Circulation 2013;127:e6-e245. Copyright © American Heart Association.")
59
Deaths attributable to cardiovascular disease (United States: 1900–2009).
Deaths attributable to cardiovascular disease (United States: 1900–2009). Cardiovascular disease (International Classification of Diseases, 10th Revision codes I00–I99) does not include congenital. Before 1933, data are for a death registration area and not the entire United States. Source: National Center for Health Statistics. Go A et al. Circulation 2013;127:e6-e245 Copyright © American Heart Association
. Cardiovascular disease (International Classification of Diseases, 10th Revision codes I00–I99) does not include congenital. Before 1933, data are for a death registration area and not the entire United States. Source: National Center for Health Statistics. Go A et al. Circulation 2013;127:e6-e245. Copyright © American Heart Association.")
60
Percentage breakdown of deaths attributable to cardiovascular disease (United States: 2009).
Percentage breakdown of deaths attributable to cardiovascular disease (United States: 2009). Source: National Heart, Lung, and Blood Institute from National Center for Health Statistics reports and data sets. *Not a true underlying cause. With any-mention deaths, heart failure accounts for 35% of cardiovascular disease deaths. Total may not add to 100 because of rounding. Coronary heart disease includes International Classification of Diseases, 10th Revision (ICD-10) codes I20 to I25; stroke, I60 to I69; heart failure, I50; high blood pressure, I10 to I15; diseases of the arteries, I70 to I78; and Other, all remaining ICD-10 I categories. Go A et al. Circulation 2013;127:e6-e245 Copyright © American Heart Association
. Source: National Heart, Lung, and Blood Institute from National Center for Health Statistics reports and data sets. *Not a true underlying cause. With any-mention deaths, heart failure accounts for 35% of cardiovascular disease deaths. Total may not add to 100 because of rounding. Coronary heart disease includes International Classification of Diseases, 10th Revision (ICD-10) codes I20 to I25; stroke, I60 to I69; heart failure, I50; high blood pressure, I10 to I15; diseases of the arteries, I70 to I78; and Other, all remaining ICD-10 I categories. Go A et al. Circulation 2013;127:e6-e245. Copyright © American Heart Association.")
61
Cardiovascular disease (CVD) deaths vs cancer deaths by age (United States: 2009).
Cardiovascular disease (CVD) deaths vs cancer deaths by age (United States: 2009). Source: National Center for Health Statistics. CVD includes International Classification of Diseases, 10th Revision codes I00 to I99 and Q20 to Q28; cancer, C00 to C97. Go A et al. Circulation 2013;127:e6-e245 Copyright © American Heart Association
 deaths vs cancer deaths by age (United States: 2009). Source: National Center for Health Statistics. CVD includes International Classification of Diseases, 10th Revision codes I00 to I99 and Q20 to Q28; cancer, C00 to C97. Go A et al. Circulation 2013;127:e6-e245. Copyright © American Heart Association.")
62
Cardiovascular disease (CVD) and other major causes of death in males: total, <85 years of age, and ≥85 years of age. Cardiovascular disease (CVD) and other major causes of death in males: total, <85 years of age, and ≥85 years of age. Deaths among males, United States, CLRD indicates chronic lower respiratory disease. Heart disease includes International Classification of Diseases, 10th Revision codes I00 to I09, I11, I13, and I20 to I51; stroke, I60 to I69; all other CVD, I10, I12, I15, and I70 to I99; cancer, C00 to C97; CLRD, J40 to J47; and accidents, V01 to X59 and Y85 to Y86. Source: National Center for Health Statistics and National Heart, Lung, and Blood Institute. Go A et al. Circulation 2013;127:e6-e245 Copyright © American Heart Association
 and other major causes of death in males: total, <85 years of age, and ≥85 years of age. Deaths among males, United States, CLRD indicates chronic lower respiratory disease. Heart disease includes International Classification of Diseases, 10th Revision codes I00 to I09, I11, I13, and I20 to I51; stroke, I60 to I69; all other CVD, I10, I12, I15, and I70 to I99; cancer, C00 to C97; CLRD, J40 to J47; and accidents, V01 to X59 and Y85 to Y86. Source: National Center for Health Statistics and National Heart, Lung, and Blood Institute. Go A et al. Circulation 2013;127:e6-e245. Copyright © American Heart Association.")
63
Cardiovascular disease (CVD) and other major causes of death in females: total, <85 years of age, and ≥85 years of age. Cardiovascular disease (CVD) and other major causes of death in females: total, <85 years of age, and ≥85 years of age. Deaths among females, United States, CLRD indicates chronic lower respiratory disease. Heart disease includes International Classification of Diseases, 10th Revision codes I00 to I09, I11, I13, and I20 to I51; stroke, I60 to I69; all other CVD, I10, I12, I15, and I70 to I99; cancer, C00 to C97; CLRD, J40 to J47; and Alzheimer disease, G30. Source: National Center for Health Statistics and National Heart, Lung, and Blood Institute. Go A et al. Circulation 2013;127:e6-e245 Copyright © American Heart Association
 and other major causes of death in females: total, <85 years of age, and ≥85 years of age. Deaths among females, United States, CLRD indicates chronic lower respiratory disease. Heart disease includes International Classification of Diseases, 10th Revision codes I00 to I09, I11, I13, and I20 to I51; stroke, I60 to I69; all other CVD, I10, I12, I15, and I70 to I99; cancer, C00 to C97; CLRD, J40 to J47; and Alzheimer disease, G30. Source: National Center for Health Statistics and National Heart, Lung, and Blood Institute. Go A et al. Circulation 2013;127:e6-e245. Copyright © American Heart Association.")
64
Cardiovascular disease and other major causes of death for all males and females (United States: 2009). Cardiovascular disease and other major causes of death for all males and females (United States: 2009). A indicates cardiovascular disease plus congenital cardiovascular disease (International Classification of Diseases, 10th Revision codes I00–I99, Q20–Q28); B, cancer (C00–C97 ); C, accidents (V01–X59, Y85–Y86); D, chronic lower respiratory disease (J40–J47); E, diabetes mellitus (E10–E14); and F, Alzheimer disease (G30). Source: National Center for Health Statistics and National Heart, Lung, and Blood Institute. Go A et al. Circulation 2013;127:e6-e245 Copyright © American Heart Association
. A indicates cardiovascular disease plus congenital cardiovascular disease (International Classification of Diseases, 10th Revision codes I00–I99, Q20–Q28); B, cancer (C00–C97 ); C, accidents (V01–X59, Y85–Y86); D, chronic lower respiratory disease (J40–J47); E, diabetes mellitus (E10–E14); and F, Alzheimer disease (G30). Source: National Center for Health Statistics and National Heart, Lung, and Blood Institute. Go A et al. Circulation 2013;127:e6-e245. Copyright © American Heart Association.")
65
Cardiovascular disease and other major causes of death for white males and females (United States: 2009). Cardiovascular disease and other major causes of death for white males and females (United States: 2009). A indicates cardiovascular disease plus congenital cardiovascular disease (International Classification of Diseases, 10th Revision codes I00–I99, Q20–Q28); B, cancer (C00–C97 ); C, accidents (V01–X59, Y85–Y86); D, chronic lower respiratory disease (J40–J47); E, diabetes mellitus (E10–E14); and F, Alzheimer disease (G30). Source: National Center for Health Statistics and National Heart, Lung, and Blood Institute. Go A et al. Circulation 2013;127:e6-e245 Copyright © American Heart Association
. A indicates cardiovascular disease plus congenital cardiovascular disease (International Classification of Diseases, 10th Revision codes I00–I99, Q20–Q28); B, cancer (C00–C97 ); C, accidents (V01–X59, Y85–Y86); D, chronic lower respiratory disease (J40–J47); E, diabetes mellitus (E10–E14); and F, Alzheimer disease (G30). Source: National Center for Health Statistics and National Heart, Lung, and Blood Institute. Go A et al. Circulation 2013;127:e6-e245. Copyright © American Heart Association.")
66
Age-adjusted death rates for coronary heart disease (CHD), stroke, and lung and breast cancer for white and black females (United States: 2009). Age-adjusted death rates for coronary heart disease (CHD), stroke, and lung and breast cancer for white and black females (United States: 2009). CHD includes International Classification of Diseases, 10th Revision codes I20 to I25; stroke, I60 to I69; lung cancer, C33 to C34; and breast cancer, C50. Source: National Center for Health Statistics. Go A et al. Circulation 2013;127:e6-e245 Copyright © American Heart Association
, stroke, and lung and breast cancer for white and black females (United States: 2009). CHD includes International Classification of Diseases, 10th Revision codes I20 to I25; stroke, I60 to I69; lung cancer, C33 to C34; and breast cancer, C50. Source: National Center for Health Statistics. Go A et al. Circulation 2013;127:e6-e245. Copyright © American Heart Association.")
67
Cardiovascular disease mortality trends for males and females (United States: 1979–2009).
Cardiovascular disease mortality trends for males and females (United States: 1979–2009). CVD excludes congenital cardiovascular defects (International Classification of Diseases, 10th Revision codes I00–I99). The overall comparability for cardiovascular disease between the International Classification of Diseases, 9th Revision (1979–1998) and International Classification of Diseases, 10th Revision (1999–2009) is No comparability ratios were applied. Source: National Center for Health Statistics. Go A et al. Circulation 2013;127:e6-e245 Copyright © American Heart Association
. CVD excludes congenital cardiovascular defects (International Classification of Diseases, 10th Revision codes I00–I99). The overall comparability for cardiovascular disease between the International Classification of Diseases, 9th Revision (1979–1998) and International Classification of Diseases, 10th Revision (1999–2009) is No comparability ratios were applied. Source: National Center for Health Statistics. Go A et al. Circulation 2013;127:e6-e245. Copyright © American Heart Association.")
Presentazioni simili


e mostra un ritmo irregolare che varia continuamente nella forma. La frequenza ventricolare media.>")


