Scaricare la presentazione
La presentazione è in caricamento. Aspetta per favore

1
IFR: stato e prospettive Roberto Calabrese Universita’ e INFN, Ferrara Commissione I, 3/2/2003

2
Outline Stato attuale Storia del barrel Motivazioni scientifiche per l’upgrade Scelta della tecnologia Problemi trovati nella produzione RPC 2000 IFR-LST design Prestazioni primi prototipi Costruzione modulare del rivelatore Readout, Elettronica, HV Costi Schedule, responsabilita’.

5
Luminosita’ raccolta nel run 3 (fb -1 )
")
8
Remediation barrel La remediation non ha prodotto i risultati sperati

9
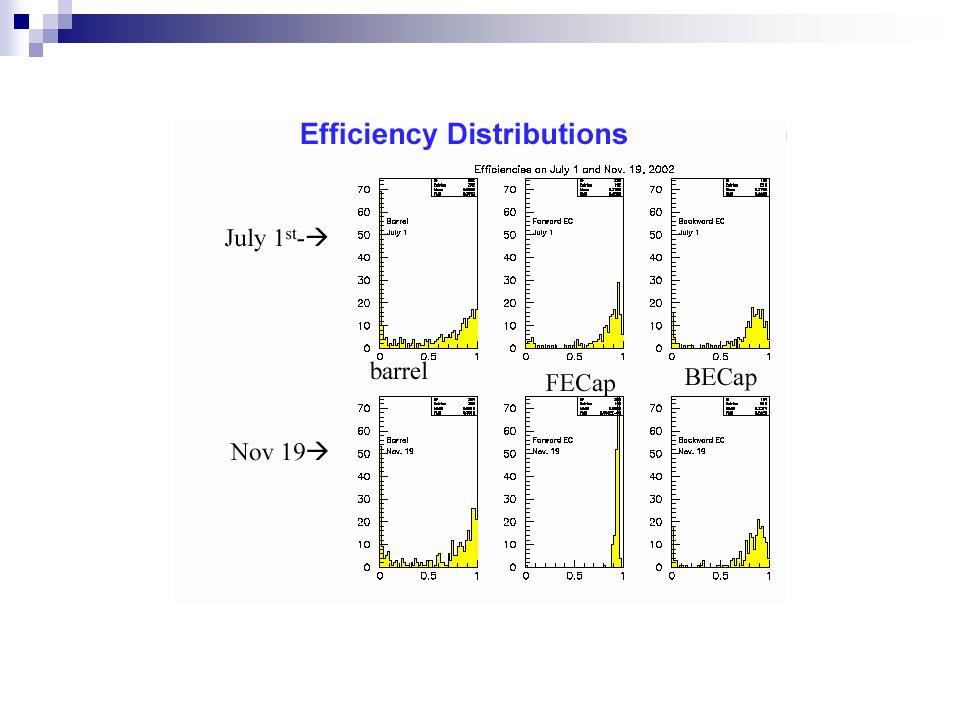
Efficienze

11
Barrel front end electronic damage Repairs done during the Christmas shutdown

12
Storia del barrel Verso la fine del '99 venne costituito un gruppo di studio per esplorare possibili scenari di upgrade per BaBar fino ad una luminosità di 3x10 34 cm -2 s -1. I risultati del lavoro del comitato vennero rivisti dal Gilchriese committee (0ttobre 2000) che a sua volta riportò all' IFC (Dicembre 2000). In sostanza, a parte upgrades di elettonica, trigger e computing per far fronte all' incremento di luminosità, l' unico intervento che venne giudicato necessario e urgente per BaBar fu quello sull' IFR che mostrava un calo di efficienza di circa 1.5 % al mese. Si decise quindi di intervenire prima sulla parte Forward che si presentava molto più semplice di quella del Barrel.
 che a sua volta riportò all IFC (Dicembre 2000). In sostanza, a parte upgrades di elettonica, trigger e computing per far fronte all incremento di luminosità, l unico intervento che venne giudicato necessario e urgente per BaBar fu quello sull IFR che mostrava un calo di efficienza di circa 1.5 % al mese. Si decise quindi di intervenire prima sulla parte Forward che si presentava molto più semplice di quella del Barrel..")
13
Storia del barrel IFC maggio 2002 "The IFC members request that BaBar management develop a decision process for Barrel IFR problem resolution which meets the end of the year requirement and report at the next IFC meeting in January 2003" All’inizio di Ottobre 2002 la collaborazione Babar ha nominato due commissioni per esaminare le possibilità di upgrade del barrel IFR (review committee e working committee) La commissione di review ha esaminato le motivazioni di fisica del barrel IFR, i possibili layout di rivelatore (numero di piani, quantità di assorbitore) e le tre tecnologie proposte (RPC streamer mode, LST, scintillatore). Le conclusioni sono state presentate alla collaborazione a Dicembre 2002 e alla riunione IFC di gennaio 2003

14
La situazione del barrel Prima dell’intervento estivo la situazione si puo’ riassumere cosi’: Camere del barrel: 342 (18) Camere ad efficienza nulla: 117 (5) Camere ad alta efficienza (>80%): 86 (4) Camere a media efficienza (50-80%): 123 (7) Camere a bassa efficienza (<50%): 16 (2) Camere con efficienza costante: 131 (7) Camere a efficienza decrescente:94 (6) (in rosso le camere del solo layer 18, il piu’ importante)
 Camere ad efficienza nulla: 117 (5) Camere ad alta efficienza (>80%): 86 (4) Camere a media efficienza (50-80%): 123 (7) Camere a bassa efficienza (<50%): 16 (2) Camere con efficienza costante: 131 (7) Camere a efficienza decrescente:94 (6) (in rosso le camere del solo layer 18, il piu’ importante)")
15
Le cause di morte L’analisi delle 117 camere morte porta a questa conclusione: Camere ad efficienza nulla: 117 Camere decedute per disconnessione della HV: 29 Camere avvelenate dal gas: 28 Camere decedute per l’evoluzione della cottura:29 Camere morte prima dell’avvento del monitoring: 31 A controprova, durante l’estate 24 camere sono state effettivamente trovate sconnesse dalla HV e riconnesse al nuovo sistema. 10 camere ‘ad alta efficienza’ a inizio 2001 sono successivamente decadute per presunto ‘avvelenamento’

16
Le categorie: 1)Camere ad efficienza alta e costante 2)Camere ad efficienza decrescente 3)Camere morte per HV 4)Camere morte per Gas 5)Camere dolcemente morte 6)Camere morte per cause ignote
Camere ad efficienza alta e costante 2)Camere ad efficienza decrescente 3)Camere morte per HV 4)Camere morte per Gas 5)Camere dolcemente morte 6)Camere morte per cause ignote")
17
Camere ad efficienza alta e costante Blue: collision data Red: cosmics

18
Camere ad efficienza decrescente: Blue: collision data Red: cosmics

19
Camere morte per HV Blue: collision data Red: cosmics

20
Camere morte per Gas Blue: collision data Red: cosmics Due moduli connessi in serie

21
Camere morte dolcemente Blue: collision data Red: cosmics

22
Camere morte prima (di voler sapere perche’) Blue: collision data Red: cosmics
 Blue: collision data Red: cosmics")
23
Selezione Basato sulla penetrazione della traccia e sul confronto con quella prevista al dato impulso Piu’ basso fake rate tagliando sul 2 (residuals sulla traccia fittata)
")
24
Muon efficiency

25
K L Detection with the IFR IFR 1 st layer hit inner layers important! Hits in two layers are required

26
IFR acceptance in the CM frame RegionLab frame polar angle (radians) Fraction of CM coverage (with acceptance) Fract. of IFR coverage Pure barrel 1< lab < 2 0.413 (0.380)0.51 Barrel/endcap overlap 0.7< lab < 1 0.185 (0.170)0.23 Pure endcap 0.3< lab <0.7 0.215 (0.197)0.26 Sum 0.3< lab <2 0.814 (0.748)1.0 Motivazioni scientifiche per l’upgrade
0.51 Barrel/endcap overlap 0.7< lab < (0.170)0.23 Pure endcap 0.3< lab < (0.197)0.26 Sum 0.3< lab < (0.748)1.0 Motivazioni scientifiche per l’upgrade.")
27
Scenario with total loss of the barrel Loss of the barrel: Total loss of 51% of our muon acceptance. Degradation of barrel/endcap overlap (?) Assume that together, these represent a 55% loss of events. Consider a semileptonic analysis with Relative yields: e=2/3 or /e+ =0.4 [B X u l with B reco ] Loss of the barrel lose 0.4*0.55=0.22 of the lepton sample. That is, get about 78% of the sample we would have obtained if the barrel had been working.
 Assume that together, these represent a 55% loss of events. Consider a semileptonic analysis with Relative yields: e=2/3 or /e+ =0.4 [B X u l with B reco ] Loss of the barrel lose 0.4*0.55=0.22 of the lepton sample. That is, get about 78% of the sample we would have obtained if the barrel had been working..")
28
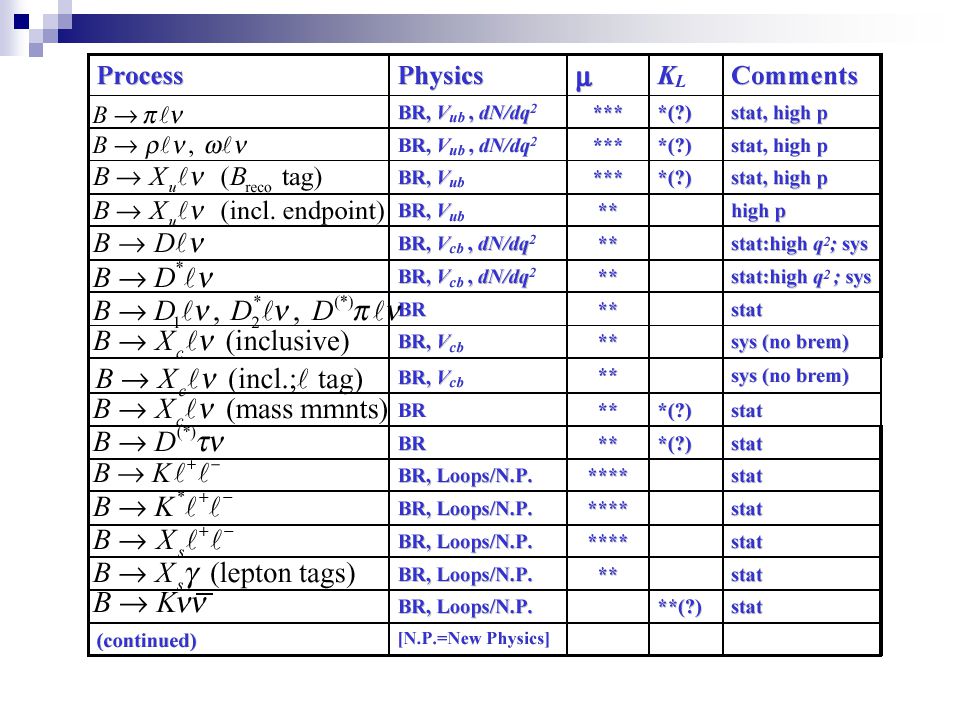
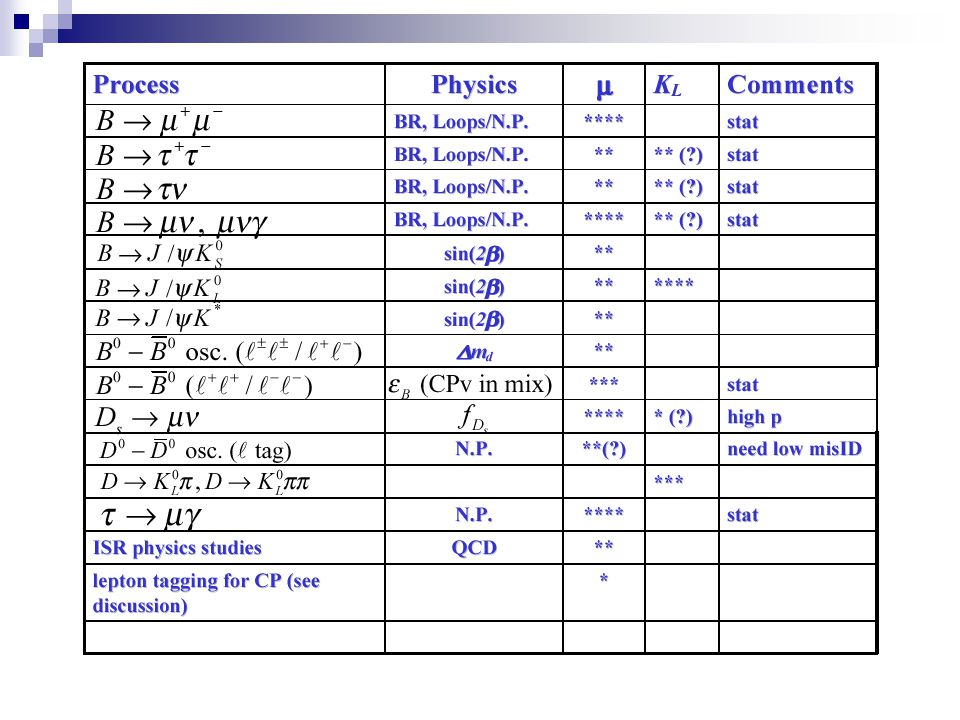
Physics Program for the IFR The IFR plays an important role both in the current BaBar physics program, and in the long term program that we foresee for the future. Survey the BaBar physics program; rate importance of /K L capability for specific measurements relevant to the IFR. In many modes, muons provide crosscheck in a channel with different systematics from the electron channel. In some modes, final states with muons are the only relevant ones. * The benefit to the measurement from the IFR is small. ** The benefit is significant. *** The benefit is large. **** The IFR is extremely important or essential.

31
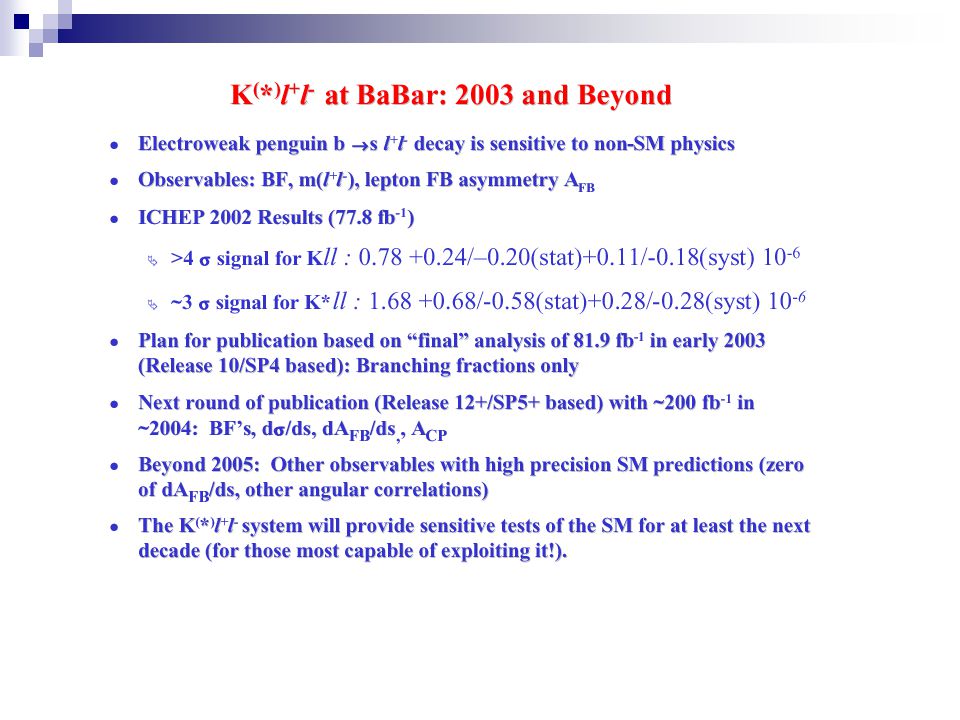
Comments on Measurements Examples of key measurements with heavy dependence on muons. These measurements can be performed with 5-6 interaction lengths of absorber. B l exclusive with neutrino reconstruction B X u l inclusive with B reco tag B K(*)l + l - B X s l + l - agreement important for V ub
l + l - B X s l + l - agreement important for V ub.")
36
Conclusioni sulle motivazioni scientifiche (I) Il barrel IFR rappresenta il 51% della copertura di angolo solido dell’intero sistema IFR, mentre la zona di overlap barrel/endcap rappresenta il 23%. Il degrado di performance delle camere RPC attualmente impiegate nel barrel riguarda, a livelli diversi, l’84% della copertura angolare del muon-id di Babar. Nel vasto programma di fisica di Babar l’identificazione dei µ gioca un ruolo molto importante, soprattutto nei decadimenti rari, e il deterioramento di performance colpisce in modi diversi la significatività della misura: riduzione della statistica di segnale; aumento della contaminazione da fondo dovuto alla mis- identification; aumento dell’errore sistematico a causa della riduzione dei campioni di controllo. Inoltre la variazione temporale dell’efficienza di muon-id e della pion fake rate introduce complicazioni addizionali in qualunque analisi, per la necessità di tracciarla in funzione del tempo. Tali complicazioni possono essere tali da ritardare significativamente la conclusione dell’analisi stessa, riducendo la competitività dell’esperimento.

37
Conclusioni sulle motivazioni scientifiche (II) Per quanto riguarda la statistica: Nella fisica semileptonica si perde il 22 % degli eventi Nella fisica in cui servono i due leptoni questa perdita può essere più elevata(vedi Kl + l - ) Nella fisica dei canali rari in cui c’e’ soltanto il canale muonico la perdita può essere pari al 55 % o superiore L’identificazione dei K L ha una priorità minore rispetto alla -id. Tuttavia, i K L giocano un ruolo importante nella misura di sin 2ß e nei test di CPT, nonchè come veto nei decadimenti rari come B . L’identificazioni dei K L dipende criticamente dalla segmentazione dei primi layer di IFR. Nel complesso la collaborazione considera la riparazione o il rimpiazzo del barrel IFR una altissima priorità per l’esperimento e considera che mantenere un numero relativamente elevato di piani (9-12) rappresenti un investimento moderato a fronte della capacità di ricostruzione dei K L e del miglioramento della -id. nella regione a basso impulso.
 rappresenti un investimento moderato a fronte della capacità di ricostruzione dei K L e del miglioramento della -id. nella regione a basso impulso..")
38
Scelta della tecnologia Review Committee C. Hearty and B. Ratcliff (co-chairs), F. Forti, Y. Karyotakis, J. Nash, J. Richman, N. Roe, B. Spaan, J. Va’vra Working committee H. Band, R. Calabrese, F. Ferroni, D. Hitlin, C. Lu, R. Schindler Consultants: G. Cavoto, J. Krebs, D. Lange, F. O’Neill
, F. Forti, Y. Karyotakis, J. Nash, J. Richman, N. Roe, B. Spaan, J. Va’vra Working committee H. Band, R. Calabrese, F. Ferroni, D. Hitlin, C. Lu, R. Schindler Consultants: G. Cavoto, J. Krebs, D. Lange, F. O’Neill.")
47
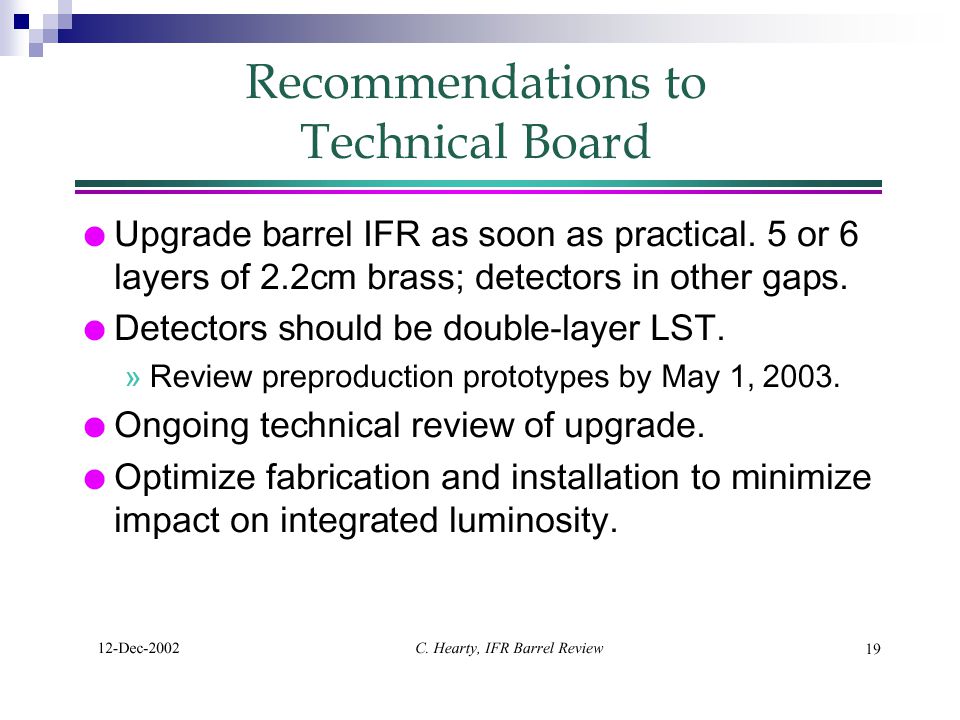
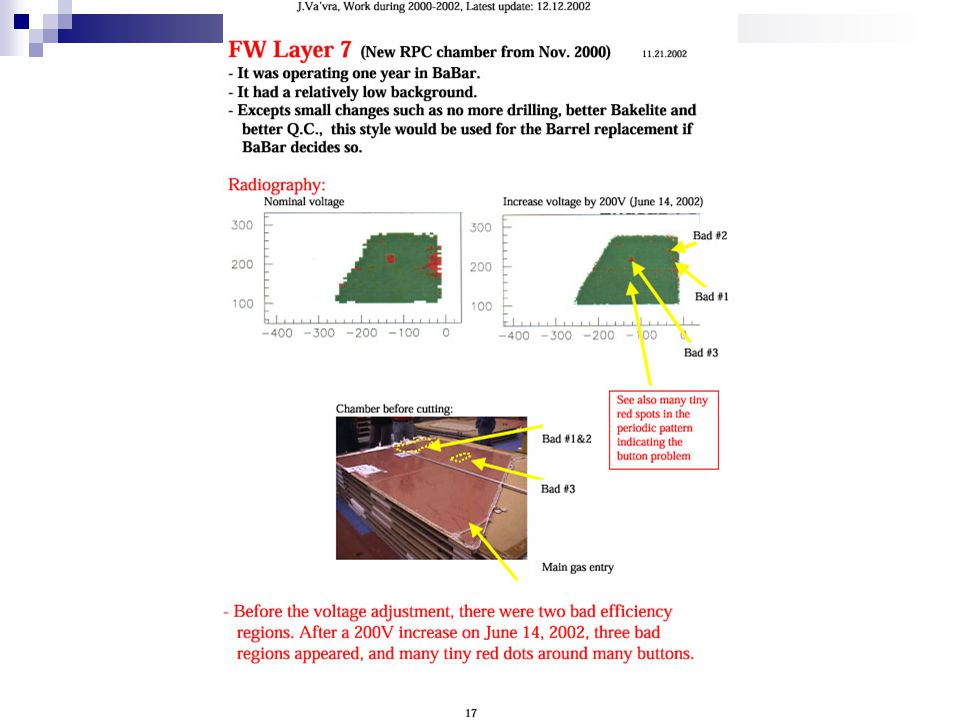
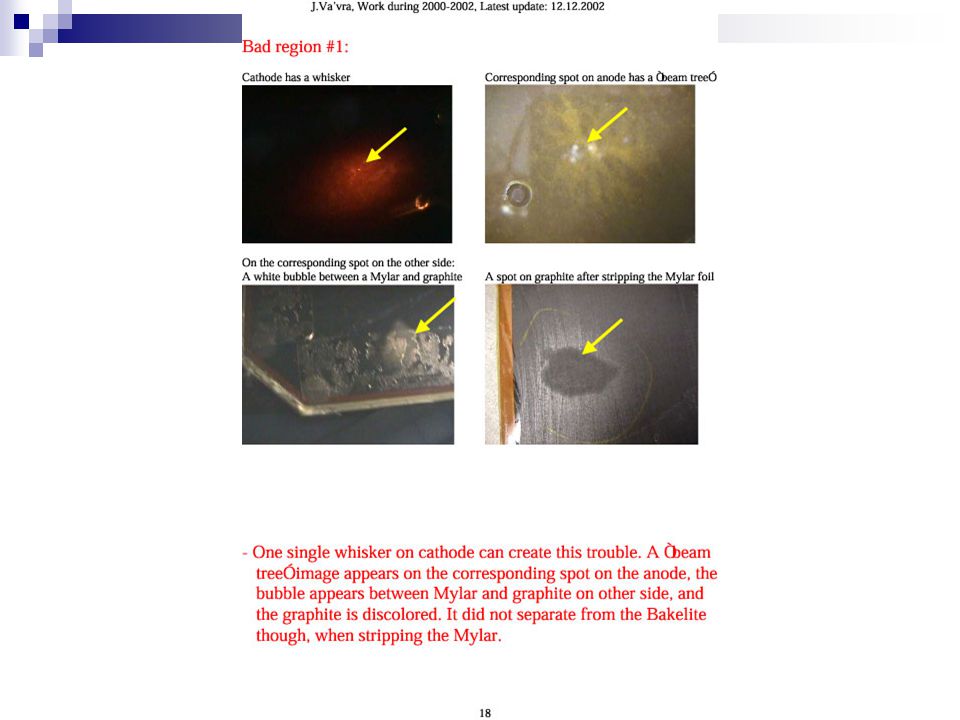
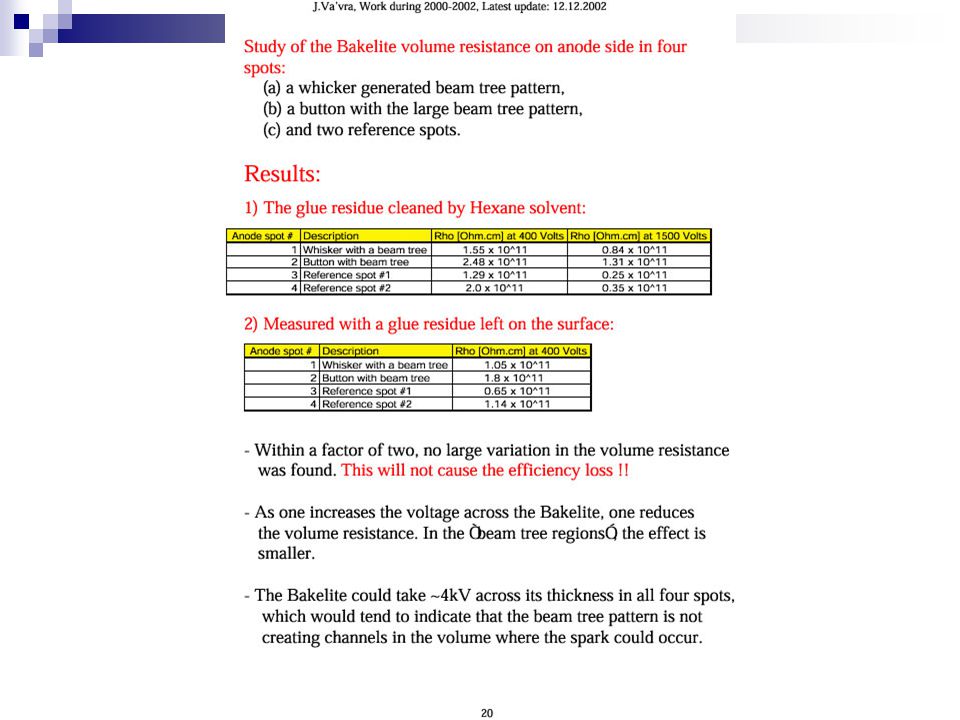
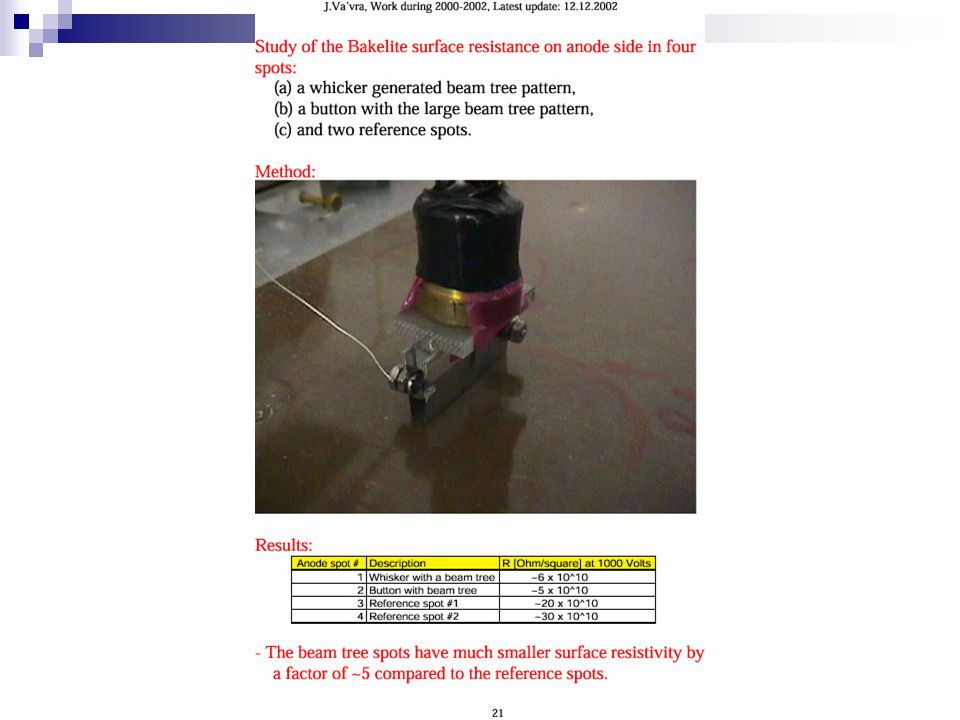
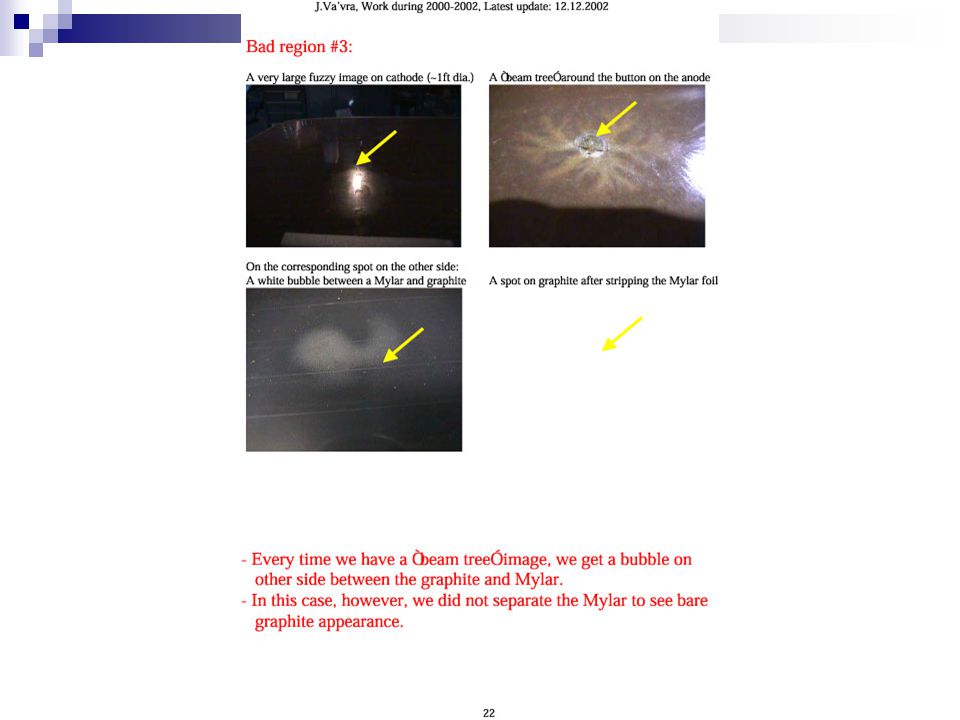
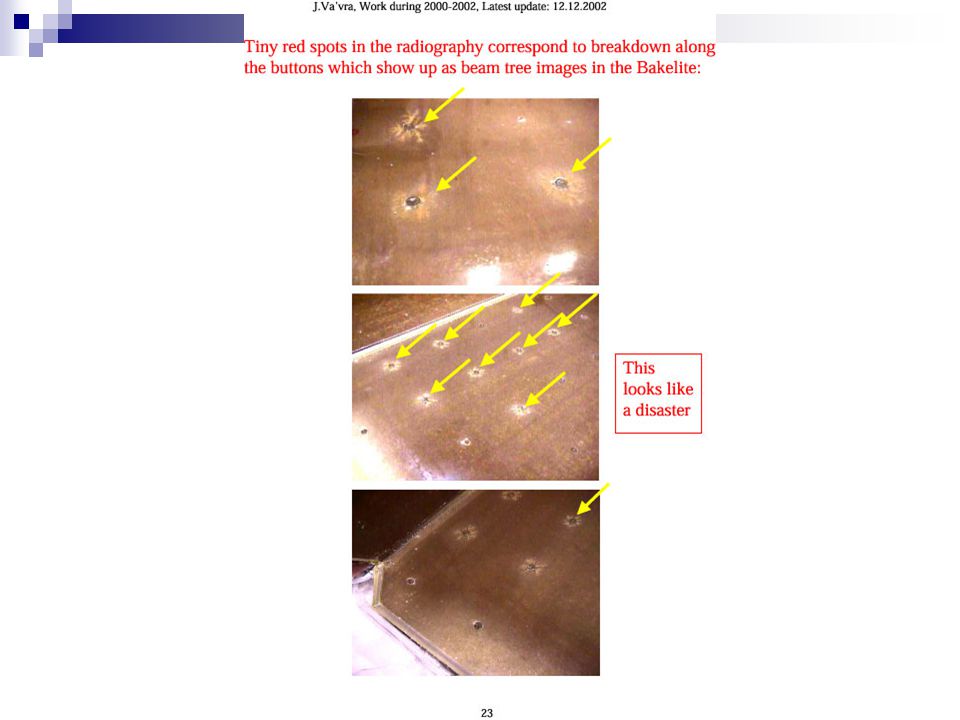
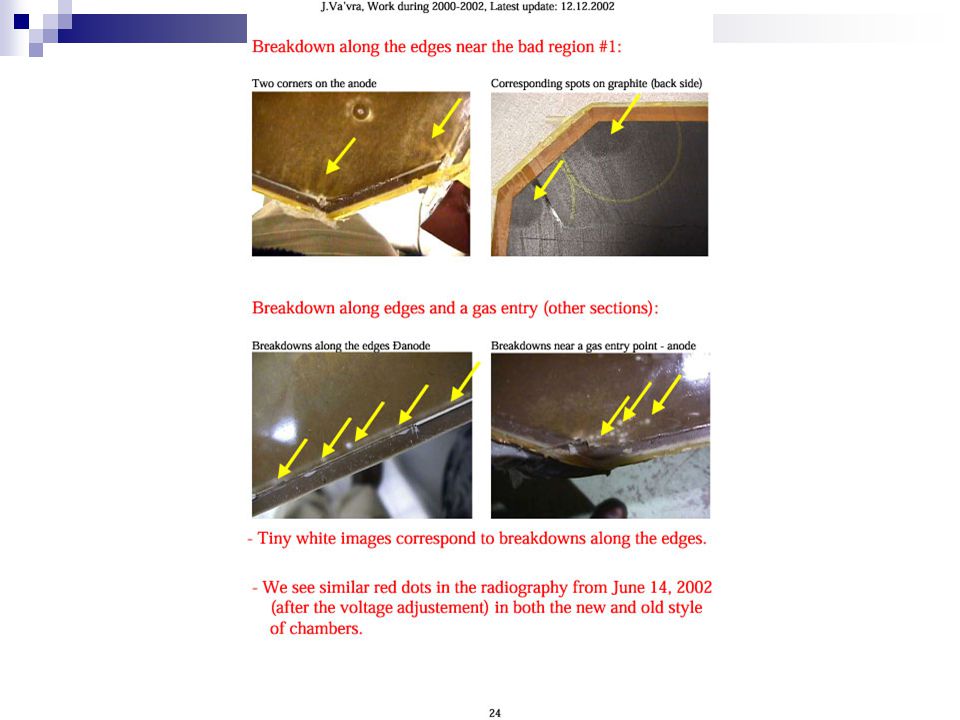
Problemi trovati nella produzione RPC 2000 Si riportano alcune pagine di un documento preparato da J.Va’vra Questi problemi riguardano il funzionamento di RPC in streamer mode Ancora nulla sappiamo delle camere installate nel 2002 che sono state prodotte con più cura e soggette a criteri di QC più stringenti

56
Conclusioni su RPC streamer mode Nonostante si siano fatti grossi passi in avanti nella comprensione del rivelatore RPC, sorgono continuamente nuove questioni non capite Le camere della produzione 2000, che hanno in generale buona performance, soffrono tuttavia di alcune perdite di efficienza. Le alterazioni fisiche riscontrate nelle camere aperte indicano che anche le camere efficienti stanno subendo delle modifiche significative, che potrebbero essere i precursori del deterioramento di performance. In tutte le camere (anche quelle efficienti) della produzione 2000 la corrente di buio è aumentata la rate di singola e’ aumentata, anche in presenza di un fascio modesto (ad es. da 1 KHz/m 2 a 20 KHz/m 2 ) ancora una volta indicando delle alterazioni di cui non capiamo l’origine. Non sappiamo ancora nulla delle camere installate nel 2002 Non ci sono gli elementi per affermare che RPC streamer mode sono una tecnologia sicura
 della produzione 2000 la corrente di buio è aumentata la rate di singola e’ aumentata, anche in presenza di un fascio modesto (ad es. da 1 KHz/m 2 a 20 KHz/m 2 ) ancora una volta indicando delle alterazioni di cui non capiamo l’origine. Non sappiamo ancora nulla delle camere installate nel 2002 Non ci sono gli elementi per affermare che RPC streamer mode sono una tecnologia sicura.")
57
General overview of the LST-based upgrade The entire project is driven by the allowed space The intrinsic efficiency of a standard LST tube is about 90%. This is due to dead spaces in the LST tubes. Efficiency is too low for our purposes. Not enough space to put 2 standard layers.

58
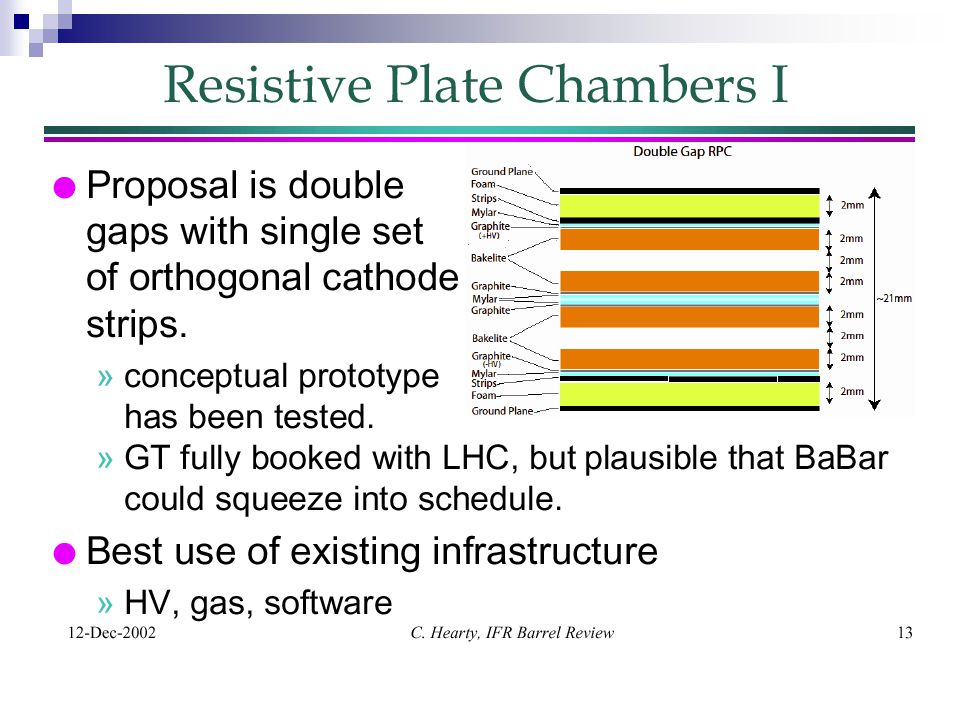
IFR-LST design Option 1: modified double-layer with a small cell (9x8mm) Readout of x and y coordinates from outside strips
 Readout of x and y coordinates from outside strips")
59
Option 2: single-layer with a large cell (19x17 mm) Readout of x and y coordinates from outside strips IFR-LST design
 Readout of x and y coordinates from outside strips IFR-LST design")
60
Performance Expected efficiency about 96% Position resolutionbetter than 3 mm (z) for standard LSTbetter than 9 mm ( ) We do not need such a resolution and we can increase the strip width, thus decreasing the number of channels ( MC simulation)
 for standard LSTbetter than 9 mm ( ) We do not need such a resolution and we can increase the strip width, thus decreasing the number of channels ( MC simulation)")
61
Position resolution

62
… Position resolution

63
ConfigurationEfficiency Both side ON96.5% 1 side ON – same side92.8% 1 side ON – opposite side91.2% Efficiency measurement Efficiency measurement setup efficiency of the high resistivity prototype using strips signals in 3 different conditions. The results are very similar to the Princeton’s ones. ANDTRIGGER scintillator Double layer prototype

64
Charge distribution Sum of the charge (in pC) of 8 1cm strips. Top with both profile HV ON. Middle: 1 profile ON, same side strips. Bottom: 1 profile ON and opposite side strips. Charge distribution (in pC) for a single wire.
 for a single wire..")
65
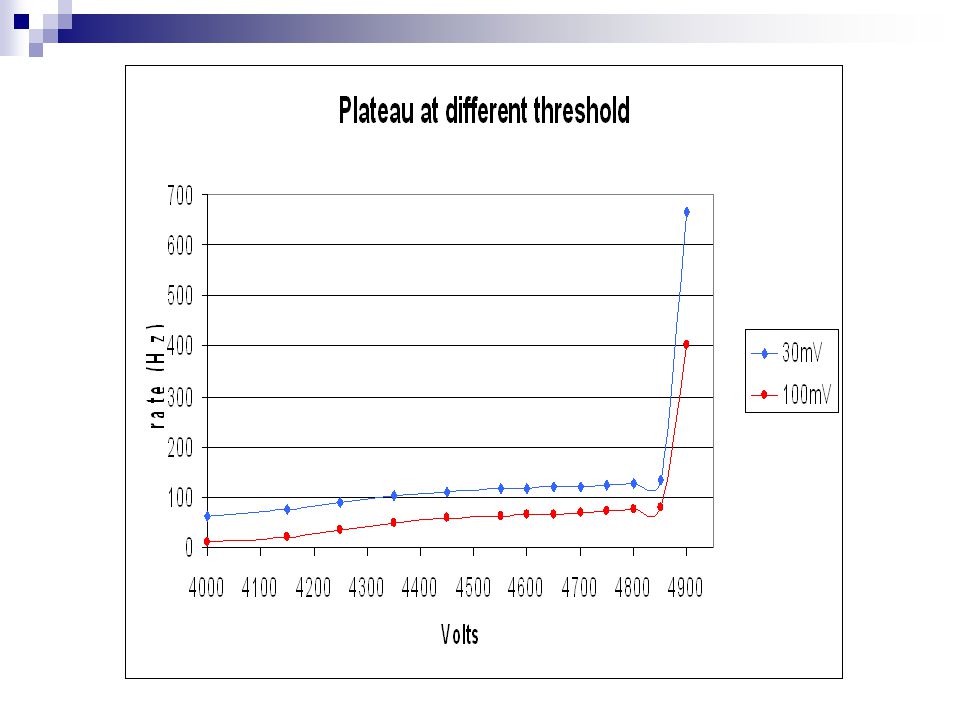
Plateau curves

67
E field Prototype cell Normal cell Small cell, anode at center At upper corner E field is high!! Roughest part in the cell IS at these corners!!

68
Aging test So far more than 325mC/cm charge dose has been accumulated at the aging spot, streamer signal charge is decreasing.

69
… Aging test The total drawing current from an anode wire shows decreasing trend @ a rate of –72%/(C/cm). The ratio of streamer charge Q/Q 0 also shows similar trend. Up to 325mC/cm there is no current spikes and self-sustaining discharge shown up yet. LST chamber still can operate smoothly.

70
Detector layout We are considering 38.5 mm z-strips and 42.5 mm -strips (2 -strips (along the wire)/LST tube) 96 z-strips for each layer, total 6912 z-strips 72 -strips for the outer layer, total 4074 -strips 10986 channels of electronics Z-strips decoupled from the chambers Chambers made with 5-7 tubes
/LST tube) 96 z-strips for each layer, total 6912 z-strips 72 -strips for the outer layer, total 4074 -strips channels of electronics Z-strips decoupled from the chambers Chambers made with 5-7 tubes")
71
DETECTOR LAYOUT: EXPLODED Exploded view of the composite detector chamber. The stack of layers building up the PHI strip plane is also shown exploded. The signal PCB (darker green, horizontal) goes actually on top of a portion of the strip plane with exposed strips. Signal traces on this PCB run across the strips and bring the strip signals to a connector not show in the drawing. The inner ribs are 1mm thick, while the outer ribs are 0.5mm thick. The drawing is available at www.fe.infn.it/~vito/
 goes actually on top of a portion of the strip plane with exposed strips. Signal traces on this PCB run across the strips and bring the strip signals to a connector not show in the drawing. The inner ribs are 1mm thick, while the outer ribs are 0.5mm thick. The drawing is available at")
72
DETECTOR LAYOUT: ASSEMBLED Partial view of a detector chamber made of 5 LSTs. The actual number of LSTs in a chamber, as well as the LST type (8 cells or 7 cells), varies to accommodate to the different widths of the iron gaps. The PHI strips run longitudinally. Their width is half the width of an 8 cell Iarocci tube. Their signals are brought to a PCB-mount connector, not shown here, accessible from the front. The LSTs are glued to the PHI strip plane. Carbon fiber (or steel) strips are also glued in between (some of) the LSTs of the unit, to increase the stiffness of the chamber. //
, varies to accommodate to the different widths of the iron gaps. The PHI strips run longitudinally. Their width is half the width of an 8 cell Iarocci tube. Their signals are brought to a PCB-mount connector, not shown here, accessible from the front. The LSTs are glued to the PHI strip plane. Carbon fiber (or steel) strips are also glued in between (some of) the LSTs of the unit, to increase the stiffness of the chamber. //.")
73
1.b Constructive details of the composite strip plane The composite strip plane is built as a stack of the following materials in foil: PET sheet, 190um thick 50um copper foil (glued to the PET above) machined into Z strips 37mm wide and 1.5mm apart PET sheet, 250um thick (It could have holes to reduce effective ε r ) FR4 sheet, 300um thick for stiffening 18um copper foil (glued to the PET below) PET sheet, 50um thick ALLOW 50um to 70um THICKNESS FOR GLUE AT INTERFACEs 1,2,3 Servizio elettronica INFN-FE http://www.fe.infn.it/electron/babar_ifr712.ppt Modular detector construction ~ 1mm Side facing the LSTs Side facing the iron 2 3 1
 machined into Z strips 37mm wide and 1.5mm apart PET sheet, 250um thick (It could have holes to reduce effective ε r ) FR4 sheet, 300um thick for stiffening 18um copper foil (glued to the PET below) PET sheet, 50um thick ALLOW 50um to 70um THICKNESS FOR GLUE AT INTERFACEs 1,2,3 Servizio elettronica INFN-FE Modular detector construction ~ 1mm Side facing the LSTs Side facing the iron 2 3 1")
74
1.c Fabrication of Z and PHI strip planes The composite strip foils will be assembled in composite strip planes of two types: -the Z type with: - Plane length = detector layer’s length - Plane width= half the detector layer’s width, for easier shipping - Number of Z strips per plane: 96 - Single strip properties: width 36.5mm; interstrip spacing 2mm; impedance ~4 -the PHI type with: - Plane length = detector layer’s length - Plane width = width of LST chamber onto which it will be glued - Number of PHI strip per plane: twice the numer of LST in the module - Single strip properties: width 40.5mm; interstrip spacing 2mm; impedance ~3.5 The full size Z strip plane will have to be assembled at the USA assembly site. The PHI strip planes will be glued on top of their associated chambers at the USA assembly site Modular detector construction

75
LIMITED STREAMER TUBE TUBE MATERIAL : PVC THE TUBE IS NOT SELF SUPPORTING 30

76
DETECTOR’S STIFFNESS: THE HELP OF THE RIBS

77
DETECTOR’S VERTICAL STIFFNESS

78
MOUNTING AND DISMOUNTING THE DETECTOR THE Z-STRIP PLANE GOES IN TO THE GAP; A PROPER TOOLING KEEPS IT IN SHAPE AND PLACE THE CHAMBERS OF THE DETECTOR ARE INSERTED ONE BY ONE FROM THE BOTTOM TO THE TOP, THE NEXT SLIDING ON THE PREVIOUS ONE EACH CHAMBER CAN BE HELD ON BOTH EDGES, WHICH ALLOWS THE LIFTING AND THE ADJUSTMENT. WHEN THE CORNER PIECES ARE MOUNTED THE DETECTOR DISASSEMBLY IS STILL POSSIBLE AFTER THE CENTER PIECES REMOVAL; THE PROCEDURE IS THE FOLLOWING: 1) LIFTING THE UPPER CHAMBERS 2) EXTRACT THE CENTRAL CHAMBERS 3) IN THE MIDDLE OF THE GAP THERE’S THE SPACE TO LOWER OR LIFT THE OTHER CHAMBERS AND REMOVE THEM. THE OPERATION OF ASSEMBLY AND DISASSEMBLY NEED A TOOLING FOR HOLDING AND HANDLING THE CHAMBERS OF THE DETECTOR.
 LIFTING THE UPPER CHAMBERS 2) EXTRACT THE CENTRAL CHAMBERS 3) IN THE MIDDLE OF THE GAP THERE’S THE SPACE TO LOWER OR LIFT THE OTHER CHAMBERS AND REMOVE THEM. THE OPERATION OF ASSEMBLY AND DISASSEMBLY NEED A TOOLING FOR HOLDING AND HANDLING THE CHAMBERS OF THE DETECTOR..")
79
Installation of the Z strip plane unbounded to the LSTs The Z readout plane is installed first, as a whole, while the corner pieces are removed. It leans against the iron; the FR4 makes it rigid, so that it won’t fold. The Z strips are read out through connectors located at the backward end of the Z strip plane: in this way the connectors will not obstacle the insertion of the detector chambers from the forward end of the IFR Z IFR BACKWARD IFR FORWARD signal connectors

80
INSERTING THE Z-STRIP PLANE THE Z-STRIP PLANE SLIDES INTO THE GAP A TOOLING FOR HOLDING AND MOVING THE FOIL IS NEEDED

81
INSERTING THE DETECTOR - 1

82
INSERTING THE DETECTOR - 2

83
EXTRACTING THE DETECTOR

84
Lowering the dead space The chambers will be built with different numbers of LST tubes. They will also use LSTs of different cell numbers to better fill the iron gaps: 8 cells Width: 84mm + 1mm ribs 7 cellsWidth: 74mm + 1mm ribs The drawings of the IFR iron allowed us to estimate the widths of the iron gaps for the layers that are to be equipped with detectors.

85
1.g1details of strip signal collection PCB and cabling Modular detector construction A A E D C B A)strip foil (190um PET foil facing DOWN) B)500um mono-layer PCB (on FR4) with holes, for soldering traces to strips, and signal traces running toward the connector C)200um mono-layer PCB (on FR4) : ground plane for signal traces: solid copper facing up D)composite insulating foil for the detector’s strips readout plane E)solid copper foil (50um PET, copper foil facing DOWN) d drawings by V. Carassiti: www.fe.infn.it/~vito

86
Readout methodology Only digital readout of strips Time measurements could be implemented: OR of 16 discriminated pulses Time resolution about 16 ns ( using BaBar reference clock) Implemented with FPGA
 Implemented with FPGA")
87
Front end electronics design: block diagram of the new 64 channel FEC 64x Amplifier-Discriminator 11us Digital OneShot Shift/Load Ck_Chain Data Out SHIFT REGISTER 64 x Threshold 12us Digital OneShot 11us Digital OneShot 12us Digital OneShot Shift/Load 4 x Implemented in a single high performance FPGA (Field Programmable Gate Array) from backplane to backplane from backplane 4 x input connectors for microribbon cable Estimated board power consumption: 16W A VHDL model of the logic architecture implemented in the FPGA is available ( link: www.fe.infn.it/electron/babar_ifr.htm )
 from backplane to backplane from backplane 4 x input connectors for microribbon cable Estimated board power consumption: 16W A VHDL model of the logic architecture implemented in the FPGA is available ( link: )")
88
Front end electronics design: Schematic of the front end based on Off-The- Shelf components Power dissipation: 250mW

89
Front end electronics design: analog simulations Simulation of the amplifier/discriminator output from a 4pC input signal (0.1mA * 40ns) Comparator threshold = 50mV dielectric thickness 0.75mm a) dielectric FOAM (ε r =1) b) dielectric PTE (ε r =3.3) c) dielectric FR4 (ε r =4.8) a) b) c)
 Comparator threshold = 50mV dielectric thickness 0.75mm a) dielectric FOAM (ε r =1) b) dielectric PTE (ε r =3.3) c) dielectric FR4 (ε r =4.8) a) b) c)")
90
Front end electronics design: structure of the 16-FEC crate The detector geometry outlined above produces a total of 10986 channels, divided over 786 cables (most of the ones in PHI not fully occupied) 786 / 64 = 12,28 crates Since the PHI cables are not fully occupied with signals we could gang together some of them, to better exploit the available resources. In the end 12 FE-CRATES, each hosting 16 FE cards, should be sufficient. Each crate hosts 16 NEW FECs. The 4 data output from each NEW FEC is transmitted, over the CRATE backplane, to the CRATE – IFB interface. This provides to the transmission of the 64 serial data streams toward one IFR FIFO BOARD. The CRATE – IFB also hosts: -one Clock fanout card: it receives and distributes the BaBar clock signal to the FPGAs -one DAC/ADC card with 16 outputs, to provide the threshold voltage to each NEW FE card independently.

91
Gas system Mass flow control system. New mixing station in existing gas shack. Main gas transport pipe system. It should be possible to use existing pipes (spares). Final gas distribution and bubbling system. The current bubbler boxes can be reused. We assume all the tubes in a layer with a single in/out. Safe gas mixture, like Ar/Iso/CO 2 (2.5/9.5/88) (SLD)
. Final gas distribution and bubbling system. The current bubbler boxes can be reused. We assume all the tubes in a layer with a single in/out. Safe gas mixture, like Ar/Iso/CO 2 (2.5/9.5/88) (SLD).")
92
Individual HV connectionsN.4152 HV distributed channelsN.1038 Worste case rate (2 Hz/cm 2 )Hz6400 Max chamber current AA 0.64 Typical rate (0.2 Hz/cm 2 )Hz640 Max chamber current AA 0.06 HV system Each chamber is connected through individual conductors up to the distribution crates. The HV system has to provide: Regulated HV up to 5 kV Current monitoring Overcurrent protection Number of channels and maximum current per channel:

93
These requirements are satisfied by CAEN SY546, a commercial system developed for the LVD experiment at the "Gran Sasso" laboratory. SY546 consists in a crate hosting 8 A548 HV boards. Each board has one HV regulated power supply which feeds 12 output channels. The current flowing in each distributed channel is individually monitored and alarm thresholds can be set for each of them. Electrical characteristics of the distributed channels: max. output voltagemax. output currentmonitoring resolution 6 kV5-10 µA5 nA The system can be interfaced to the Detector Control system via the usual CAENET-VME module already used in BaBar. HV system

94
Cost estimates: assumptions Double layer LST; 8 cells and 7 cells types; each layer with a separate HV 96 strip (36mm strips) in the Z direction; 2 strip per LST in the PHI direction Z strip plane installed and readout as a whole; readout from backward side of IFR Modular detector construction; readout from the forward side of the subdetectors 12 active layers
 in the Z direction; 2 strip per LST in the PHI direction Z strip plane installed and readout as a whole; readout from backward side of IFR Modular detector construction; readout from the forward side of the subdetectors 12 active layers")
95
Cost estimates: assumptions Total number of 8-cell LSTs: 1866 Total number of 7-cell LSTs: 210 Total number of HV channels: 4152 Total number of Z strips : 6912 Total number of PHI strips : 4074 Total number of signals: 10986 Total number of microribbon flat cables: 786 Total number of FE CRATEs (16 NEW FE cards per CRATE): 12 Total number of NEW FE CARDS: 192 (12288 channels) Total area of Z /PHI strip plane [m²]: 1290.3
![Cost estimates: assumptions Total number of 8-cell LSTs: 1866 Total number of 7-cell LSTs: 210 Total number of HV channels: 4152 Total number of Z strips : 6912 Total number of PHI strips : 4074 Total number of signals: Total number of microribbon flat cables: 786 Total number of FE CRATEs (16 NEW FE cards per CRATE): 12 Total number of NEW FE CARDS: 192 (12288 channels) Total area of Z /PHI strip plane [m²]:](http://images.slideplayer.it/12/4077182/slides/slide_95.jpg "Cost estimates: assumptions Total number of 8-cell LSTs: 1866 Total number of 7-cell LSTs: 210 Total number of HV channels: 4152 Total number of Z strips : 6912 Total number of PHI strips : 4074 Total number of signals: Total number of microribbon flat cables: 786 Total number of FE CRATEs (16 NEW FE cards per CRATE): 12 Total number of NEW FE CARDS: 192 (12288 channels) Total area of Z /PHI strip plane [m²]:")
96
Costs Tubes: 60 KE (setup) 405 KE ( 195 E/tube x 2076 double layer tubes) Total cost tubes 465KE Strip readout planes 215 m 2 /sextant x 6 sextant x 70 E/m 2 = 90 KE Signal collection (PCB’s) inside iron 18 KE Total cost readout planes 108 KE Grand total chambers 573KE
 405 KE ( 195 E/tube x 2076 double layer tubes) Total cost tubes 465KE Strip readout planes 215 m 2 /sextant x 6 sextant x 70 E/m 2 = 90 KE Signal collection (PCB’s) inside iron 18 KE Total cost readout planes 108 KE Grand total chambers 573KE")
97
Total cost of signal flat cables + connectors 152 KE Total cost of electronics 122 KE Total cost of HV cables + connectors 38 KE Service panels 4 KE Total cost of LV ground wire and plugs 10 KE TDC system: 20 KE Total electronics + cables 346 KE Costs

98
HV system 11 SY546 systems with 87 A548 12 ch Active boards SY546 Main: 3300 E A548 12 CH Active: 1400 E Tot: 3300 x 11+ 1400 x 87= 158100 E 11 Distribution boxes = 10000 E Total HV system : 168 KE Total cost gas system 50 KE DAQ, cooling no expected cost Grand total detector 1137 KE (no spare, no contingency) Costs
 Costs")
102
Gruppi italiani coinvolti (per ora) in attività di costruzione Ferrara: Coord., Produzione LST, Schede FE, Coord. Elettronica, SW MC Bettoni, Calabrese, Piemontese, Luppi, Negrini, Cibinetto, Andreotti Genova: Crate FE, Schede distrib. clock thres., DAQ LoVetere, Robutti, Passaggio, Capra, Patrignani Padova: Produzione LST, SW MC Posocco, Rotondo, Margoni, Morandin Roma: Sistema di test, QC, Piredda, Voena, Ferroni, Cavoto, Morganti LNF: Produzione LST Patteri, Zallo

103
COSTI PER I PROTOTIPI doppio layer Trafila per profilo13000 Trafila per camicia 9700 Stampo per tappo 9500 Stampo per portabasetta 8000 Stampo per cavalierini8000 Componentistica 62 (PVC, filo, inserti per tappi, cavalierini...) * 30 tubi=1860 Manodopera 118 * 30=3540 Modifica parziale impianto di produzione3500 Costo totale 57100 Euro + IVA
 * 30 tubi=1860 Manodopera 118 * 30=3540 Modifica parziale impianto di produzione3500 Costo totale Euro + IVA")
104
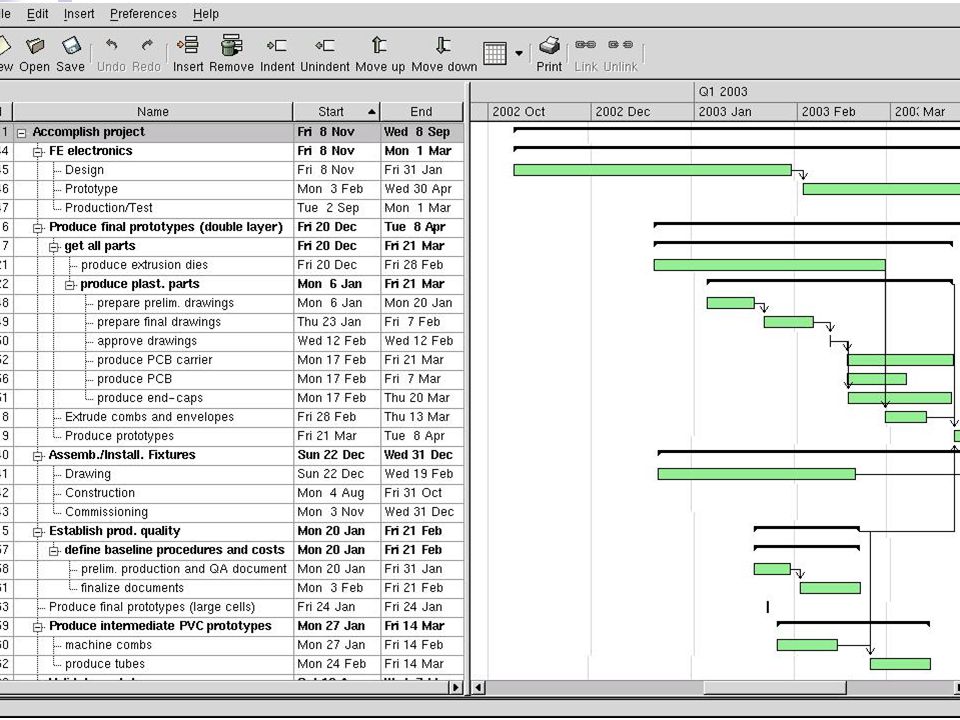
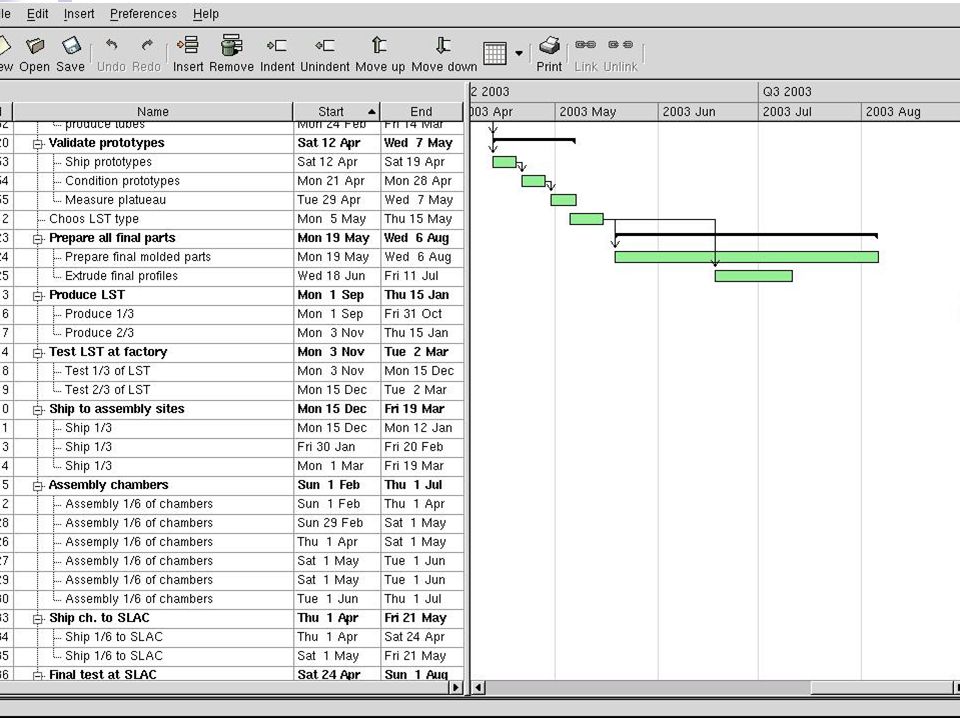
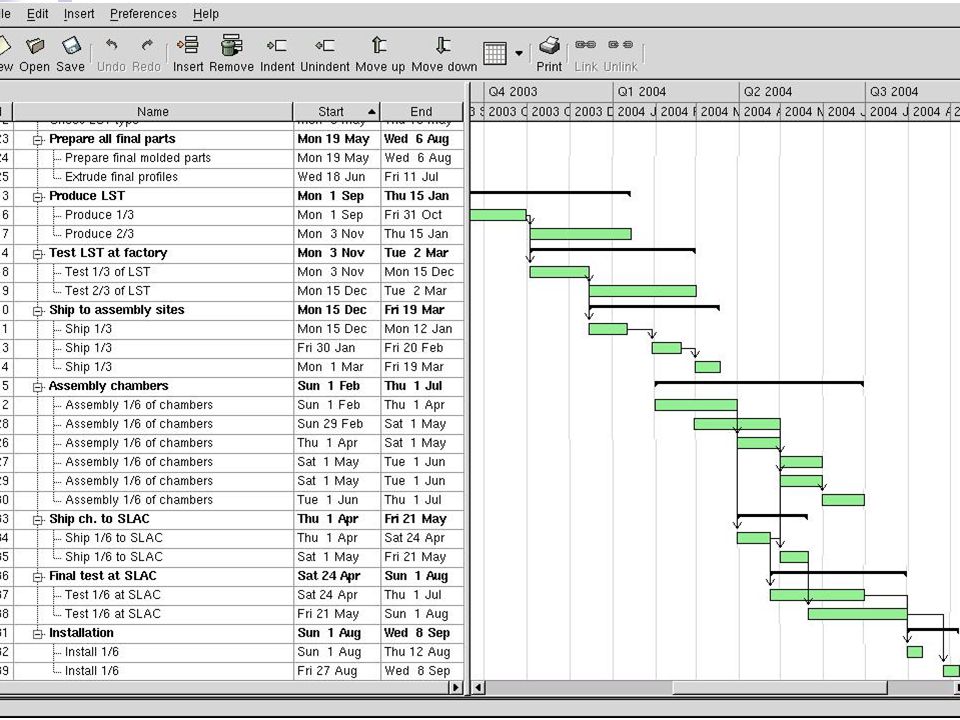
Conclusioni Il forward IFR e’ stato installato con successo La Collaborazione ha affrontato il problema della sostituzione del barrel, con la decisione della tecnologia da adottare Prima presentazione alla riunione IFC di gennaio, discussione finale nella riunione IFC di giugno sulla base di una review in primavera Discussione dettagliata in una prossima riunione di Commissione I Essenziale per mantenere i tempi stretti partire ora con la costruzione del prototipo finale

107
Backup slides

108
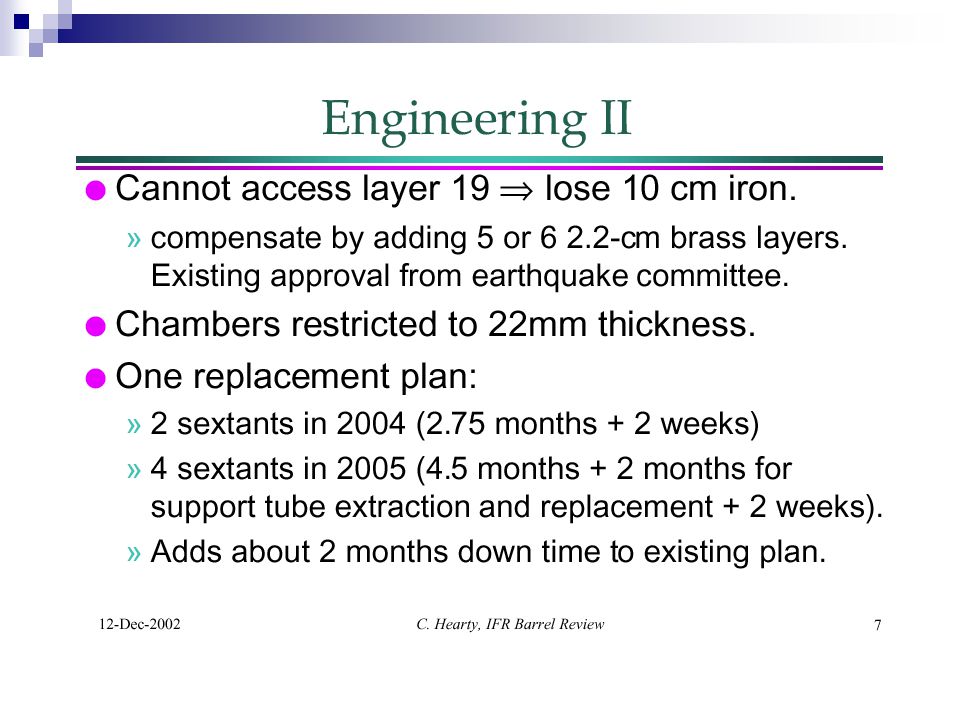
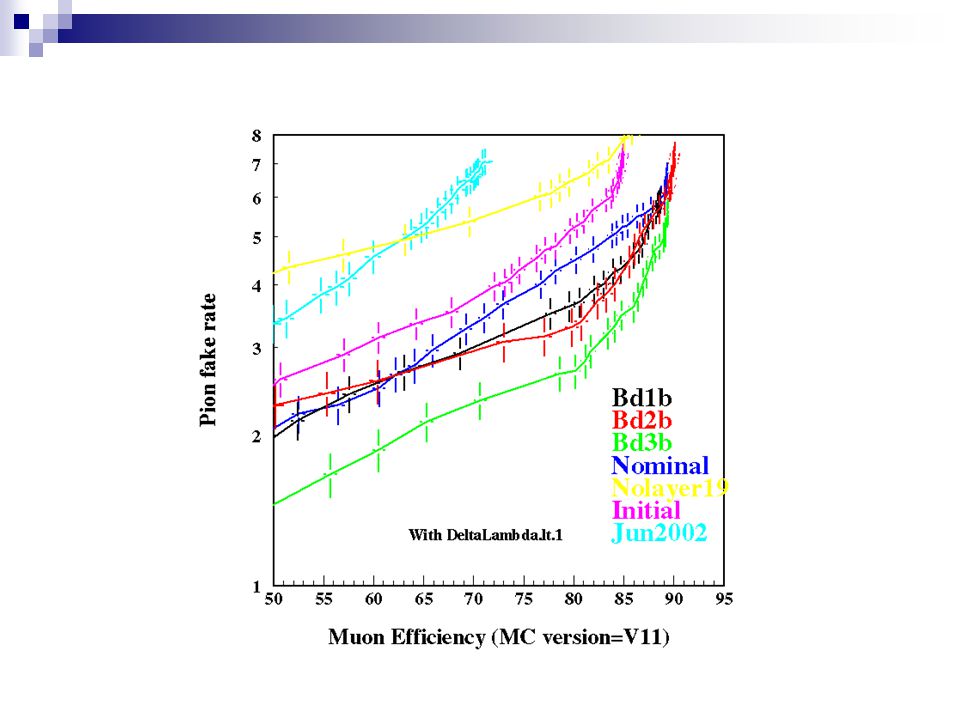
Barrel configurations Add a 2.2cm brass layers Lambda(Brass) = 16.3 cm Add a 2.2cm brass layers Lambda(Brass) = 16.3 cm Configuration nameSlots with absorberLambda exp (90deg) BD18,10,12,14,16 (13 active layers) 5.1 BD25,7,9,11,13,15 (12 active layers) 5.3 BD32,3,4,5,7,9,11,13,15 (9 active layers) 5.7 Configuration name Jun2002Jun2002 efficiencies InitialFeb 2000 efficiency Data/MC comparison Nominal95%efficient RPC NoLayer19As Nominal, but no lay19
 = 16.3 cm Add a 2.2cm brass layers Lambda(Brass) = 16.3 cm Configuration nameSlots with absorberLambda exp (90deg) BD18,10,12,14,16 (13 active layers) 5.1 BD25,7,9,11,13,15 (12 active layers) 5.3 BD32,3,4,5,7,9,11,13,15 (9 active layers) 5.7 Configuration name Jun2002Jun2002 efficiencies InitialFeb 2000 efficiency Data/MC comparison Nominal95%efficient RPC NoLayer19As Nominal, but no lay19")
110
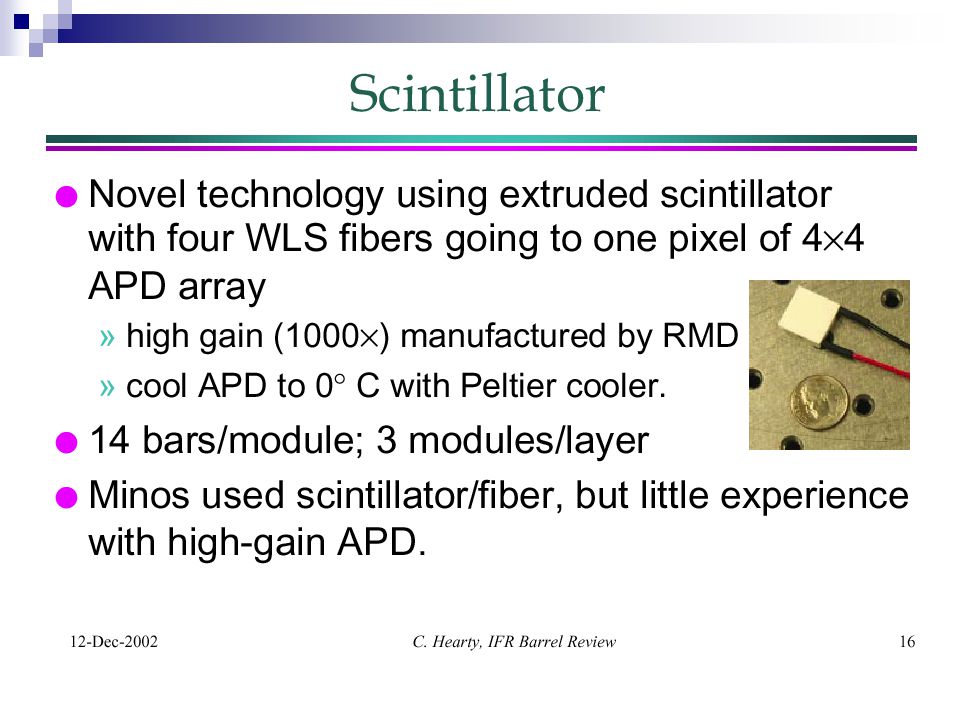
Pion fake rate

Presentazioni simili


 Scopi del test (discussi tra di noi,con i referee ed al GruppoI a giugno)>")


; HLT + DAQ; _________________________ NB :non include.>")


