Scaricare la presentazione
La presentazione è in caricamento. Aspetta per favore

1
Le simulazioni del Progetto MEGAPOLI: confronti con le simulazioni di MINNI A.DAllura, S. Finardi, P. Radice, C. Silibello 1-2 Nov 2010 - 2nd Annual MEGAPOLI Meeting (Hamburg, Germany)
.")
2
Messaggi Le nostre simulazioni producono una quantità di dati che spesso non utilizziamo e che forniscono, invece, informazioni molto utili. Alcuni esempi forniti dalle simulazioni effettuate da ARIANET allinterno del progetto MEGAPOLI; Utilizzo di dati di AOD (dati MODIS/rete AERONET) per una più completa valutazione delle nostre simulazioni. Un esempio dal progetto MEGAPOLI; Data assimilation ? Il confronto delle simulazioni MINNI/Nord-Italia e MEGAPOLI/Po Valley suggerisce lipotesi che simulazioni innestate EUROPA/ITALIA/MACROREGIONI possano fornire stime più corrette relativamente al PM
 per una più completa valutazione delle nostre simulazioni. Un esempio dal progetto MEGAPOLI; Data assimilation . Il confronto delle simulazioni MINNI/Nord-Italia e MEGAPOLI/Po Valley suggerisce lipotesi che simulazioni innestate EUROPA/ITALIA/MACROREGIONI possano fornire stime più corrette relativamente al PM.")
3
Le nostre simulazioni producono una quantità di dati che spesso non utilizziamo e che forniscono, invece, informazioni molto utili. Alcuni esempi forniti dalle simulazioni effettuate da allinterno del progetto MEGAPOLI

4
Po Valley simulations Nested domains G1 G2

5
Po Valley simulations (June, December 2005) Runs over Po Valley considering two nested domains. FARM: SAPRC99 gas phase chemical mechanism / aero3 aerosol module Rosenbrock solver– ROS3 Space resolution: 16 and 4 km (horizontal); 16 levs, up to 10 km (vertical) Emissions: Anthropogenic: TNO data set ( 7 km resolution); Italian data set (ISPRA - Province level); Regional data sets (INEMAR - Municipal level); BIOGENIC: SURFPro Isoprene and Terpenes from vegetation, PM (fine and coarse) from aeolian resuspension and sea salts, wind influence; Meteorology: RAMS; IC/BC: MPI MATCH – Global scale: gaseous species GOCART – Global scale: Climatological aerosols
; 16 levs, up to 10 km (vertical) Emissions: Anthropogenic: TNO data set ( 7 km resolution); Italian data set (ISPRA - Province level); Regional data sets (INEMAR - Municipal level); BIOGENIC: SURFPro Isoprene and Terpenes from vegetation, PM (fine and coarse) from aeolian resuspension and sea salts, wind influence; Meteorology: RAMS; IC/BC: MPI MATCH – Global scale: gaseous species GOCART – Global scale: Climatological aerosols.")
6
Italy - ISPRA (Province level) Regions - INEMAR (Municipal level) TNO data set ( 7 km resolution) Po Valley simulations Emission inventories
 Regions - INEMAR (Municipal level) TNO data set ( 7 km resolution) Po Valley simulations Emission inventories")
7
PROCESS CONTRIBUTIONS Computed from hourly balance terms computed runtime over inner model grid

8
Gain/Inflow Loss/Outflow Po Valley simulations Process contribution to PM 2.5 [g] In/Out flows Net_flow = Hor_inflow + Hor_outflow + Top flow June 2005
![Gain/Inflow Loss/Outflow Po Valley simulations Process contribution to PM 2.5 [g] In/Out flows Net_flow = Hor_inflow + Hor_outflow + Top flow June 2005](http://images.slideplayer.it/1/550124/slides/slide_8.jpg "Gain/Inflow Loss/Outflow Po Valley simulations Process contribution to PM 2.5 [g] In/Out flows Net_flow = Hor_inflow + Hor_outflow + Top flow June 2005")
9
Po Valley simulations Process contribution to PM 2.5 [g] Other processes BIOGENIC SOA June 2005
![Po Valley simulations Process contribution to PM 2.5 [g] Other processes BIOGENIC SOA June 2005](http://images.slideplayer.it/1/550124/slides/slide_9.jpg "Po Valley simulations Process contribution to PM 2.5 [g] Other processes BIOGENIC SOA June 2005")
10
Po Valley simulations Process contribution to PM 2.5 [g] Biogenic emissions (terpenes) -> SOA BIOGENIC SOA TRP1 emissions June 2005
![Po Valley simulations Process contribution to PM 2.5 [g] Biogenic emissions (terpenes) -> SOA BIOGENIC SOA TRP1 emissions June 2005](http://images.slideplayer.it/1/550124/slides/slide_10.jpg "Po Valley simulations Process contribution to PM 2.5 [g] Biogenic emissions (terpenes) -> SOA BIOGENIC SOA TRP1 emissions June 2005")
11
Tavg: ground level average temperature at noon; Isoprene/Terpene emissions (daily integral over all domain) Po Valley simulations Biogenic emissions vs Temperature Temperature dependence; Isoprene emissions: during daylight between April and October; Terpenes emissions: full year June 2005
 Po Valley simulations Biogenic emissions vs Temperature Temperature dependence; Isoprene emissions: during daylight between April and October; Terpenes emissions: full year June 2005")
12
Po Valley simulations Process contribution to O 3 Chemistry vs Temperature Tavg: ground level average temperature at noon, O 3 Chemistry: daily integral June 2005

13
Po Valley simulations Process contribution to CO [g] CO production from Isoprene/terpenes ozonolysis {190} ISOPRENE + O3 = 0.266 OH + 0.066 RO2_R + 0.008 RO2_N + 0.126 R2O2+ 0.192 MA_RCO3 + 0.275 CO + 0.592 HCHO + 0.1 PROD2 + 0.39 METHACRO + 0.16 MVK + 0.204 HCOOH + 0.15 RCO_OH {194} TERP + O3 = 0.567 OH + 0.033 HO2 + 0.031 RO2_R + 0.18 RO2_N +0.729 R2O2+ 0.123 CCO_O2 + 0.201 RCO_O2 + 0.157 CO + 0.235 HCHO + 0.205RCHO + 0.13ACET + 0.276PROD2 + 0.001GLY + 0.031 BACL + 0.103 HCOOH + 0.189 RCO_OH + TRP1AER (->AORB)
![Po Valley simulations Process contribution to CO [g] CO production from Isoprene/terpenes ozonolysis {190} ISOPRENE + O3 = OH RO2_R RO2_N R2O MA_RCO CO HCHO PROD METHACRO MVK HCOOH RCO_OH {194} TERP + O3 = OH HO RO2_R RO2_N R2O CCO_O RCO_O CO HCHO RCHO ACET PROD GLY BACL HCOOH RCO_OH + TRP1AER (->AORB)](http://images.slideplayer.it/1/550124/slides/slide_13.jpg "Po Valley simulations Process contribution to CO [g] CO production from Isoprene/terpenes ozonolysis {190} ISOPRENE + O3 = OH RO2_R RO2_N R2O MA_RCO CO HCHO PROD METHACRO MVK HCOOH RCO_OH {194} TERP + O3 = OH HO RO2_R RO2_N R2O CCO_O RCO_O CO HCHO RCHO ACET PROD GLY BACL HCOOH RCO_OH + TRP1AER (->AORB)")
14
Po Valley simulations Process contribution to CO [g] Other processes Dry deposition is negligible and wet deposition is not considered for CO Chemistry ? June 2005
![Po Valley simulations Process contribution to CO [g] Other processes Dry deposition is negligible and wet deposition is not considered for CO Chemistry .](http://images.slideplayer.it/1/550124/slides/slide_14.jpg "June")
15
Po Valley simulations Process contribution to CO [mol] Chemistry/interpretation June 2005
![Po Valley simulations Process contribution to CO [mol] Chemistry/interpretation June 2005](http://images.slideplayer.it/1/550124/slides/slide_15.jpg "Po Valley simulations Process contribution to CO [mol] Chemistry/interpretation June 2005")
16
Particle dry deposition velocity

17
Po Valley simulations PM: Process contribution/dimensional analysis Negligible outflow from Po Valley region, for Aiken and Coarse mode particles, due to dry deposition process. Accumulation mode particles may be transported outside Po Valley region (because of lower dry deposition). Inflow Outflow June 2005
. Inflow Outflow June")
18
Po Valley simulations Process contribution to HNO 3 [g] Other processes HNO3 nigh time production due to chemistry less dissolution of HNO3 in the particles? June 2005
![Po Valley simulations Process contribution to HNO 3 [g] Other processes HNO3 nigh time production due to chemistry less dissolution of HNO3 in the particles.](http://images.slideplayer.it/1/550124/slides/slide_18.jpg "June")
19
Po Valley simulations Process contribution to HNO 3 [mol] Aerosol processes The decrease in the PM liquid water content leads to less dissolution of HNO 3 in the particles June 2005
![Po Valley simulations Process contribution to HNO 3 [mol] Aerosol processes The decrease in the PM liquid water content leads to less dissolution of HNO 3 in the particles June 2005](http://images.slideplayer.it/1/550124/slides/slide_19.jpg "Po Valley simulations Process contribution to HNO 3 [mol] Aerosol processes The decrease in the PM liquid water content leads to less dissolution of HNO 3 in the particles June 2005")
20
Po Valley simulations Process contribution to HNO 3 [g] Other processes Dec. 2005
![Po Valley simulations Process contribution to HNO 3 [g] Other processes Dec. 2005](http://images.slideplayer.it/1/550124/slides/slide_20.jpg "Po Valley simulations Process contribution to HNO 3 [g] Other processes Dec. 2005")
21
Po Valley simulations Process contribution to HNO 3 [g] Aerosol processes No further HNO3 reacts with ammonia to form volatile salts Dec. 2005
![Po Valley simulations Process contribution to HNO 3 [g] Aerosol processes No further HNO3 reacts with ammonia to form volatile salts Dec.](http://images.slideplayer.it/1/550124/slides/slide_21.jpg)
22
from [Nenes et al., 1998 ] …based on the value of this ratio [in the simulations we do not include sodium and chloride], following types of aerosols are defined: Sulfate rich (free acid): This is when R SO4 < 1. The sulfates are in abundance and part of it is in the form of free sulfuric acid. In this case, there is always a liquid phase, because sulfuric acid is extremely hygroscopic (i.e., DRH is 0%); Sulfate rich (non free acid): This is when 1 R SO4 < 2. There is enough ammonia to partially (but not fully) neutralize the sulfates. The sulfates are a mixture of bisulfates and sulfates, the ratio of which is determined by thermodynamic equilibrium; Sulfate poor: R SO4 2: There is enough ammonia to fully neutralize the sulfates. In this case, excess ammonia can react with the other species (HNO 3, HCl) to form volatile salts. Aerosol types
![from [Nenes et al., 1998 ] …based on the value of this ratio [in the simulations we do not include sodium and chloride], following types of aerosols are defined: Sulfate rich (free acid): This is when R SO4 < 1.](http://images.slideplayer.it/1/550124/slides/slide_22.jpg "The sulfates are in abundance and part of it is in the form of free sulfuric acid. In this case, there is always a liquid phase, because sulfuric acid is extremely hygroscopic (i.e., DRH is 0%); Sulfate rich (non free acid): This is when 1 R SO4 < 2. There is enough ammonia to partially (but not fully) neutralize the sulfates. The sulfates are a mixture of bisulfates and sulfates, the ratio of which is determined by thermodynamic equilibrium; Sulfate poor: R SO4 2: There is enough ammonia to fully neutralize the sulfates. In this case, excess ammonia can react with the other species (HNO 3, HCl) to form volatile salts. Aerosol types.")
23
Scen_50Scen_0 June 2005 Sulfate rich (1 R SO4 < 2)
")
24
Dec. 2005 Scen_50Scen_0 Sulfate poor (R SO4 2)
")
25
NO - 3 Scen_0Scen_50 % differences with the Base case" Absolute differences with the Base case" June 2005 50% reduction of emis. leads to a reduction of conc. greater than 50%

26
NO - 3 Scen_0Scen_50 % differences with the Base case" Absolute differences with the Base case" Dec. 2005 50% reduction of emis. leads to a reduction of conc. lower than 50%

27
Po Valley simulations Po-Valley tracers emissions CO and PM fine tracers are emitted only in the Po Valley region (green); are transported and deposited (dry and wet); chemical and aerosol precesses are not considered (chemically not reactive).
; are transported and deposited (dry and wet); chemical and aerosol precesses are not considered (chemically not reactive).")
28
Po Valley simulations CO tracer CO Base case – Scen_0 CO tracer Base case Absolute differences Base case concentrations June 2005

29
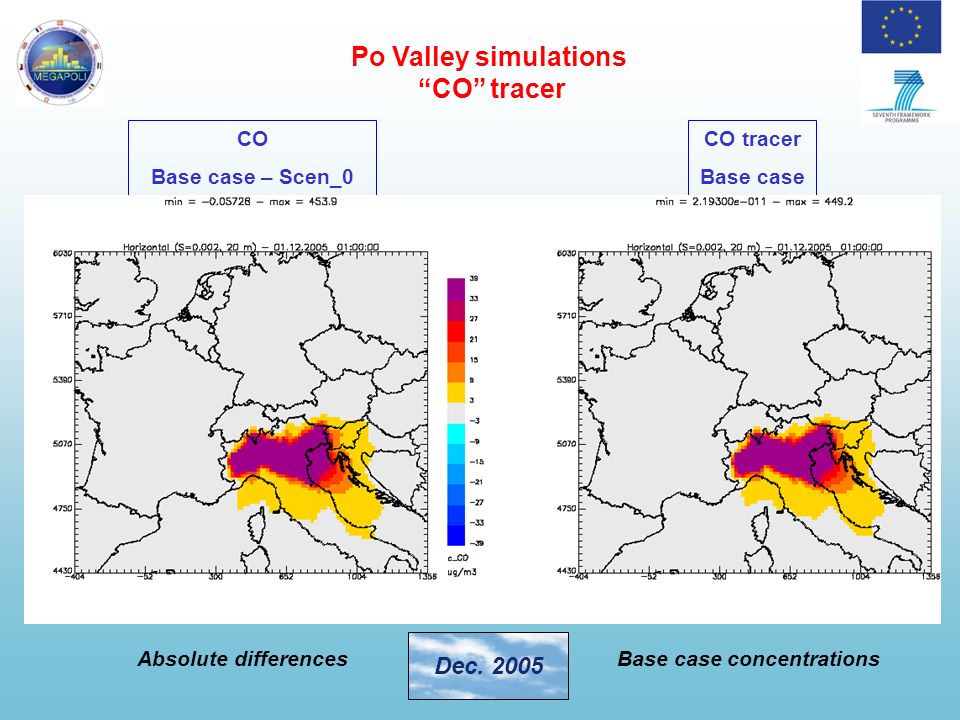
Po Valley simulations CO tracer CO Base case – Scen_0 CO tracer Base case Absolute differences Base case concentrations Dec. 2005
30
Utilizzo di dati di AOD (dati MODIS/rete AERONET) per una più completa valutazione delle nostre simulazioni. Un esempio dal progetto MEGAPOLI

31
AOD, Jan FARMTerra (MODIS) I campi di AOD satellitari vengono confrontati con I campi medi mensili prodotti da FARM relativi alle ore 12 (media mobile esaoraria). I campi medi osservati potrebbero non essere congruenti con quelli stimati a seguito delle possibile mancanza di dati satellitari.

32
AOD, Jun FARMTerra (MODIS)
")
33
AERONET Stations

34
AOD: FARM vs MODIS and Aeronet, data

35
AOD: FARM vs MODIS Aeronet, data

36
AOD: FARM vs MODIS Aeronet, data (ITALY)
")
37
EMEP PM10 Stations

39
O 3 EMEP Network

41
1.7.2009, NO 2 near-surface concentrations from FARM-ARIANET and SILAM-FMI FARMSILAM

42
NO0001 Birkenes NO0039 Kårvatn NO0041R Osen NO0043 Prestebakke NO0048 Voss NO0052 Sandve NO0056 Hurdal O 3 Comparison with some Norvegian observations http://tarantula.nilu.no/projects/ccc/emepdata.html

43
O 3 Comparison with some Norwegian observations

44
Data assimilation

45
Sistema MINNI Run NI1 2005 a 4 km Test assimilazione medie annuali BRACE

46
Sistema MINNI Concentrazioni medie annuali di NO 2

47
Sistema MINNI Medie annuali NO 2 - 2005 Run IT1 a 4 km (inventario ISPRA)
")
48
Sistema MINNI Medie annuali NO 2 - 2005 Run IT1 a 4 km (inventario ISPRA) + assimilazione
 + assimilazione")
49
Sistema MINNI Confronto speditivo con database BRACE In via preliminare sono state prese in considerazione tutte le stazioni BRACE disponibili, senza selezione e controlli di coerenza; anche la tipologia fondo/industriale/traffico e rurale/suburbana/urbana è stata mutuata direttamente da quella presente nella base dati.

50
Sistema MINNI Medie annuali NO 2 - 2005 Run IT1 a 4 km (inventario ISPRA) Confronto su tutte le stazioni di fondo (122)
 Confronto su tutte le stazioni di fondo (122)")
51
Sistema MINNI Medie annuali NO 2 - 2005 Run IT1 a 4 km (inventario ISPRA) + assimilazione Confronto su tutte le stazioni di fondo (122)
 + assimilazione Confronto su tutte le stazioni di fondo (122)")
52
Sistema MINNI Concentrazioni medie annuali di PM 10

53
Sistema MINNI Medie annuali PM 10 - 2005 Run IT1 a 4 km (inventario ISPRA)
")
54
Sistema MINNI Medie annuali PM 10 - 2005 Run IT1 a 4 km (inventario ISPRA) + assimilazione
 + assimilazione")
55
Sistema MINNI Confronto speditivo con database BRACE In via preliminare sono state prese in considerazione tutte le stazioni BRACE disponibili, senza selezione e controlli di coerenza; anche la tipologia fondo/industriale/traffico e rurale/suburbana/urbana è stata mutuata direttamente da quella presente nella base dati.

56
Sistema MINNI Medie annuali PM 10 - 2005 Run IT1 a 4 km (inventario ISPRA) Confronto su tutte le stazioni di fondo (122)
 Confronto su tutte le stazioni di fondo (122)")
57
Sistema MINNI Medie annuali PM 10 - 2005 Run IT1 a 4 km (inventario ISPRA) + assimilazione Confronto su tutte le stazioni di fondo (122)
 + assimilazione Confronto su tutte le stazioni di fondo (122)")
58
Il confronto delle simulazioni MINNI/Nord-Italia e MEGAPOLI/Po Valley suggerisce lipotesi che simulazioni innestate EUROPA/ITALIA/MACROREGIONI possano fornire stime più corrette relativamente al PM

59
MEGAPOLI-Po Valley simulations Nested domains MEGAPOLI 2-way nesting (Central EUROPE-Po Valleey); Meteo: RAMS (venti piu intensi) SAPRC99 KPP Emissions: TNO, INEMAR, ISPRA 2005 BC: MPIMATH (gas), GOCART (aerosol)
; Meteo: RAMS (venti piu intensi) SAPRC99 KPP Emissions: TNO, INEMAR, ISPRA 2005 BC: MPIMATH (gas), GOCART (aerosol)")
60
MODELS: FARM (MEGAPOLI and MINNI) EMEP MPI-MATCH GOCART (aerosol, climatological) Monthly averages (June)
 EMEP MPI-MATCH GOCART (aerosol, climatological) Monthly averages (June)")
61
PM 2.5 MINNIMEGAPOLI EMEPGOCART

62
PM 10 MINNIMEGAPOLI EMEPGOCART

63
PM 2.5-10 MINNIMEGAPOLI EMEPGOCART

64
O3O3 MINNIMEGAPOLI EMEPMPIMATCH

65
MEGAPOLI-Po Valley simulations Influence of BCs: Nested domains vs 1-way nesting 1-5/6/2005: 5 days average RUNS Nested domains: 2-way nesting (Central EUROPE-Po Valley) using MPIMATH (gas), GOCART (aerosol) fields for BCs 1-way nesting: EMEP fields for BCs
 using MPIMATH (gas), GOCART (aerosol) fields for BCs 1-way nesting: EMEP fields for BCs")
66
PM 2.5 (average 1-5/6/2005) Nested domains1-way nesting (EMEP_BCs)
 Nested domains1-way nesting (EMEP_BCs)")
67
PM 10 (average 1-5/6/2005) Nested domains1-way nesting (EMEP_BCs)
 Nested domains1-way nesting (EMEP_BCs)")
68
PM 2.5-10 (average 1-5/6/2005) Nested domains1-way nesting (EMEP_BCs)
 Nested domains1-way nesting (EMEP_BCs)")
69
O 3 (average 1-5/6/2005) Nested domains1-way nesting (EMEP_BCs)
 Nested domains1-way nesting (EMEP_BCs)")
70
Messaggi La versione OpenSource di FARM potrebbe essere applicata alla campagna della TRISAIA per verificarne le potenzialità (es. meccanismo chimico più aggiornato e utilizzo del modulo di trasferimento radiativo). Nelle prossime simulazioni MINNI utilizzare il file di output balance.dat. Contiene informazioni utili alla interpretazione dei risultati!! Lutilizzo dei dati di AOD e più in generale dei campi prodotti dai satelliti fornisce informazioni che possono supportare la fase di valutazione del sistema modellistico (confronto tra campi). il modulo di assimilazione implementato in FARM consente di integrare ancor più compiutamente il sistema MINNI, gli inventari delle emissioni ed il dataset BRACE, al fine di produrre mappe di qualità dellaria sul territorio nazionale e sulle macroregioni sempre più realistici (non appropriato per studi di scenario). Linserimento di un dominio a scala europea potrebbe determinare una migliore stima dei livelli di inquinamento sul territorio nazionale.
. Nelle prossime simulazioni MINNI utilizzare il file di output balance.dat. Contiene informazioni utili alla interpretazione dei risultati!. Lutilizzo dei dati di AOD e più in generale dei campi prodotti dai satelliti fornisce informazioni che possono supportare la fase di valutazione del sistema modellistico (confronto tra campi). il modulo di assimilazione implementato in FARM consente di integrare ancor più compiutamente il sistema MINNI, gli inventari delle emissioni ed il dataset BRACE, al fine di produrre mappe di qualità dellaria sul territorio nazionale e sulle macroregioni sempre più realistici (non appropriato per studi di scenario). Linserimento di un dominio a scala europea potrebbe determinare una migliore stima dei livelli di inquinamento sul territorio nazionale..")
Presentazioni simili


>")


 A.Cristofoli (laureando.>")


