Scaricare la presentazione
La presentazione è in caricamento. Aspetta per favore

1
Metodi Quantitativi per Economia, Finanza e Management Lezione n°12

2
Quante componenti considerare? 1.metodo degli autovalori >1 2.rapporto tra numero di componenti e variabili (circa 1/3) 3.percentuale di varianza spiegata (almeno 60%) 4.lo SCREE PLOT (plot di autovalore vs il numero di fattori) Se il plot mostra un gomito è plausibile ipotizzare lesistenza di una struttura latente, se la forma è quasi rettilinea significa che i fattori sono solo una trasformazione delle variabili manifeste. I fattori rilevanti sono quelli al di sopra del gomito (a discrezione anche quello in corrispondenza del gomito). Se non ci sono fattori predominanti il criterio è inadatto. Analisi fattoriale
 3.percentuale di varianza spiegata (almeno 60%) 4.lo SCREE PLOT (plot di autovalore vs il numero di fattori) Se il plot mostra un gomito è plausibile ipotizzare lesistenza di una struttura latente, se la forma è quasi rettilinea significa che i fattori sono solo una trasformazione delle variabili manifeste. I fattori rilevanti sono quelli al di sopra del gomito (a discrezione anche quello in corrispondenza del gomito). Se non ci sono fattori predominanti il criterio è inadatto. Analisi fattoriale.")
3
Quante componenti considerare? 5.Comunalità: - confronto tra le comunatità di più soluzioni - la quota di varianza spiegata di ciascuna variabile dalla soluzione scelta deve essere soddisfacente Analisi fattoriale

4
Come interpretarle? 1.rotazione delle componenti La rotazione ortogonale nello spazio dei fattori non influenza la validità del modello: sfruttiamo questa caratteristica per ottenere dei fattori più facilmente interpretabili. –The Varimax method of rotation, suggested by Kaiser, has the purpose of minimizing the number of variables with high saturations (correlations) for each factor –The Quartimax method attempts to minimize the number of factors tightly correlated to each variable –The Equimax method is a cross between the Varimax and the Quartimax 2.correlazioni tra componenti principali e variabili originarie Analisi fattoriale
 for each factor –The Quartimax method attempts to minimize the number of factors tightly correlated to each variable –The Equimax method is a cross between the Varimax and the Quartimax 2.correlazioni tra componenti principali e variabili originarie Analisi fattoriale.")
5
Esempi di Analisi Fattoriale di vecchi lavori di gruppo

6
Obiettivo della ricerca è comprendere quali siano i principali mezzi informativi, il relativo indice di gradimento e quali siano gli argomenti di maggior interesse. Analisi fattoriale: Le variabili considerate sono i 14 parametri che influenzano la scelta del canale e quelli che influenzano la scelta relativa al tipo di fonte Esempio Importanza dellInformazione e modalità di acquisizione

7
In funzione di cosa scegli il canale? Su una scala da 1 a 10 (dove 1= per niente e 10= moltissimo) esprimi un giudizio sullimportanza: semplicità 12345678910 costo 12345678910 velocità di acquisizione 12345678910 comodità 12345678910 tempo di aggiornamento 12345678910 In funzione di cosa scegli le fonti? Su una scala da 1 a 10 (dove 1= per niente e 10= moltissimo) esprimi un giudizio sullimportanza: orientamento politico 12345678910 temi trattati 12345678910 area geografica di interesse 12345678910 direttore 12345678910 formato / stile 12345678910 con chi vivi 12345678910 redazione 12345678910 giornalisti/speaker12345678910 qualità servizi12345678910
 esprimi un giudizio sullimportanza: semplicità costo velocità di acquisizione comodità tempo di aggiornamento In funzione di cosa scegli le fonti. Su una scala da 1 a 10 (dove 1= per niente e 10= moltissimo) esprimi un giudizio sullimportanza: orientamento politico temi trattati area geografica di interesse direttore formato / stile con chi vivi redazione giornalisti/speaker qualità servizi")
8
Le variabili considerate sono i parametri che influenzano la scelta del canale e quelli che influenzano la scelta relativa al tipo di fonte Esempio Importanza dellInformazione e modalità di acquisizione

9
9 Esempio: Importanza dellInformazione e modalità di acquisizione

11
CONFRONTO CUMUNALITA FINALI: Esempio: Importanza dellInformazione e modalità di acquisizione

12
Schema fattoriale Factor1Factor2Factor3Factor4Factor5 D_17_ssemplicità0.56626...0.46051 D_17_ccosto0.35685.0.65469.0.3875 D_17_vvelocità0.75292.... D_17_comcomodità0.68764-0.36206... D_17_tdatempo di aggiornamento0.5326-0.43612..-0.38524 D_20_orporientamento politico.0.54298.0.53024. D_20_tttemi trattati0.41299..0.53419. D_20_agarea geografica di interesse..-0.5248.0.38026 D_20_ddirettore.0.74874... D_20_fsformato/stile0.38261..-0.43544. D_20_ccvcon chi vivi.0.50515... D_20_rredazione.0.72899... D_20_gsgiornalisti/speaker0.586040.49902... D_20_qsqualità servizi0.63683.... I valori minori di 0.35 non sono stampati. Lo schema fattoriale a 5 fattori, così come si presenta, è di difficile interpretazione; per questo risulta opportuno ruotare i fattori attraverso un apposito metodo (VARIMAX). Esempio: Importanza dellInformazione e modalità di acquisizione
. Esempio: Importanza dellInformazione e modalità di acquisizione.")
13
SCHEMA FATTORIALE RUOTATOFactor1Factor2Factor3Factor4Factor5 D_17_vvelocità0.8578.... D_17_tda tempo di aggiornamento0.7885.... D_17_comcomodità0.70345..0.39398. D_20_qsqualità servizio0.53133.... D_20_rrapidità.0.74824... D_20_fsformato/stile.0.71171... D_20_ccvcon chi vivi.0.70059... D_20_gsgiornalisti/speaker.0.620980.36737.. D_20_orporientamento politico..0.8923.. D_20_ddirettore..0.77647.. D_17_ccosto...0.83334. D_17_ssemplicità...0.650370.45187 D_20_ag area geografica di interesse....0.7622 D_20_tttemi trattati....0.71198 I valori minori di 0.35 non sono stampati. Rapidità di acquisizione e qualità del servizio offerto. Esposizione dell informazione Affinità politica/ ideologica Accessibilità al sevizio Attrattività argomenti trattati Esempio: Importanza dellInformazione e modalità di acquisizione

14
Coffee Consumption in Italy

15
Factor Analysis We ran a Factor Analysis on two numerical questions from the survey that we felt might have correlated variables: Q15 (What are you general coffee preferences?) and Q16 (If you drink your coffee outside (in a bar/coffee place) which are the main factors that, in general, influence your decision on where you drink your coffee?). We used the Principal Components Method that was supposed to solve the multicollinearity problem among our variables and provide us with summarized number of variables/factors which are not correlated (standardized by definition, with mean 0, standard deviation 1) to better explain and understand the specific situation of coffee consumption. This represents a preliminary phase for cluster analysis and regression analysis.
 to better explain and understand the specific situation of coffee consumption. This represents a preliminary phase for cluster analysis and regression analysis..")
16
Initial Variables used for analysis On the right, there are our initial 21 variables (taken from Q15 and Q16) that we selected for running the factor analysis. Judging by the SPSS Correlation Matrix (that is not present in the slide because of its big size – please see the output for the check), we have many variables which are significantly correlated. Need for FACTOR REDUCTION! Start real Factor Analysis!
, we have many variables which are significantly correlated. Need for FACTOR REDUCTION. Start real Factor Analysis!.")
17
Choosing the right number of factors 1.1/3 criteria: 21/3= 7 factors 2.Variance explained (60%-75%): 7, 8, 9, 10 factors 3.Scree Plot: 6, 8, 10 factors 4.Eigenvalues: 6, 7, 8 factors The optimal values seem to be 7 or 8 factors.
: 7, 8, 9, 10 factors 3.Scree Plot: 6, 8, 10 factors 4.Eigenvalues: 6, 7, 8 factors The optimal values seem to be 7 or 8 factors.")
18
Choosing the right number of factors – continued - The present Scree Plot represents the number 3 criteria of number of factors selection from the previous slide.

19
Factor Analysis with 8 Factors After analyzing the Communalities table, we identified one variable that is not properly explained by our 8 selected factors (0.387 is not satisfying)! This variable is Price which we consider an important variable in our analysis! Decreasing the number of factors to 7, will not improve the explanatory power of the variables for the price! We decided to exclude the Price variable from this factor analysis and consider it as a separate factor (given its very high importance from our qualitative point view) in the future analysis: cluster & regression analysis.
 in the future analysis: cluster & regression analysis..")
20
Factor Analysis with 20 Factors After elimination of the Price variable 1.1/3 criteria: 20/3= 6 factors 2.Variance explained (60%-75%): 7, 8, 9 factors 3.Scree Plot: 6, 7, 9 factors 4.Eigenvalues: 6, 7, 8 factors The optimal choice seems to be 7 factors.
: 7, 8, 9 factors 3.Scree Plot: 6, 7, 9 factors 4.Eigenvalues: 6, 7, 8 factors The optimal choice seems to be 7 factors.")
21
Factor Analysis with 20 Factors After elimination of the Price variable -continued- The present Scree Plot represents the number 3 criteria of number of factors selection from the previous slide.

22
Factor Analysis with 7 Factors After analyzing the Communalities table, we that so far the 7 factors properly explain the initial variables. All communalities are over 0.400, which is a good result. We are ready to take a look at the Rotated Component Matrix to see if the factors make sense/can be explained!

23
Factors - explained The method used for rotation was Varimax. After closely analyzing the Rotated Component Matrix, we tried to give meaning to our 7 factors. The names of the respective factors are the following: 1.Socialization factor 2.Internet/ Trendiness factor 3.Close meeting place factor 4.Intellectual/ non- smoking factor 5.Familiarity factor 6.Variety/To Go factor 7.Traditionality & Addiction factor

24
Factors – explained - continued - 1. Socialization FactorSocialize, sit down, being with friends, cozy atmosphere 2. Internet/Trendiness FactorWi-Fi availability, internet, trendy place 3. Close meeting place FactorClose to home/work/school, ability to meet people, quality of coffee not important 4. Intellectual/Non-smoking FactorNon-smokers, usually snack, love to read 5. Familiarity FactorGo to the same bar, do not like trying new places, concerned about quality of coffee 6. Variety/To-go FactorVariety and coffee to go, non traditional Italian coffee, preference for taking coffee alone 7. Traditionality/Addiction FactorItalian coffee preference, addicts

25
The consumption of Digital Music and its impact on the Music Industry

26
Factor Analysis We have taken into consideration questions n° 4,9,10 and therefore we have 24 variables We asked interviewees to give a score from 1 to 9 (1: I dont like it 9: I love it) or to use percentages Quest.n.4: score Quest.n.9: score Quest.n.10: % 1.Home 2.Car 3.Outside in general 4.Office/University 5.Shops 6.Restaurants 7.Bars/discoteque 8.Record player 9.Cassette player 10.CD player 11.Digital player 12.Car stereo 13.House stereo 14.Radio 15.Mobile phone 16.USE record player 17.USE cassette player 18.USE CD Player 19.USE digital player 20.USE car stereo 21.USE house stereo 22.USE radio 23.USE PC 24.USE mobile phone
 or to use percentages Quest.n.4: score Quest.n.9: score Quest.n.10: % 1.Home 2.Car 3.Outside in general 4.Office/University 5.Shops 6.Restaurants 7.Bars/discoteque 8.Record player 9.Cassette player 10.CD player 11.Digital player 12.Car stereo 13.House stereo 14.Radio 15.Mobile phone 16.USE record player 17.USE cassette player 18.USE CD Player 19.USE digital player 20.USE car stereo 21.USE house stereo 22.USE radio 23.USE PC 24.USE mobile phone")
27
Factor Analysis First hypothesis: Number of factors: 9 Extraction: Principal Component Analysis Max number of interaction: 25 Rotation : Varimax

28
Factor Analysis Ratio between component number and variable number ADEQUATE For a set of 17 variables, the ideal number of components is 4-5. In this case for a set of 24 variables, we have considered 9 components % global explained variance OK About 68% - the optimal range is 60% - 70% CommunalitiesADEQUATE The values vary among 0,456 and 0,917 We found a problem looking at the rotated component matrix: CORRELATION AMONG COMPONENTS AND ORIGINAL VARIABLES NON OPTIMAL problematic 9th component

29
Factor Analysis Second hypothesis: Number of factors: 8 Extraction: Principal Component Analysis Max number of interaction: 25 Rotation : Varimax

30
Factor Analysis Ratio between component number and variable number ADEQUATE For a set of 17 variables, the ideal number of components is 4-5. In this case for a set of 24 variables, we have considered 8 components % global explained variance OK About 63% - the optimal range is 60% - 70% CommunalitiesACCEPTABLE The values vary among 0,431 and 0,870

31
Factor Analysis Scree plotADEQUATE Quite linear slope From the 9th component, there is little increase in significance explained.

32
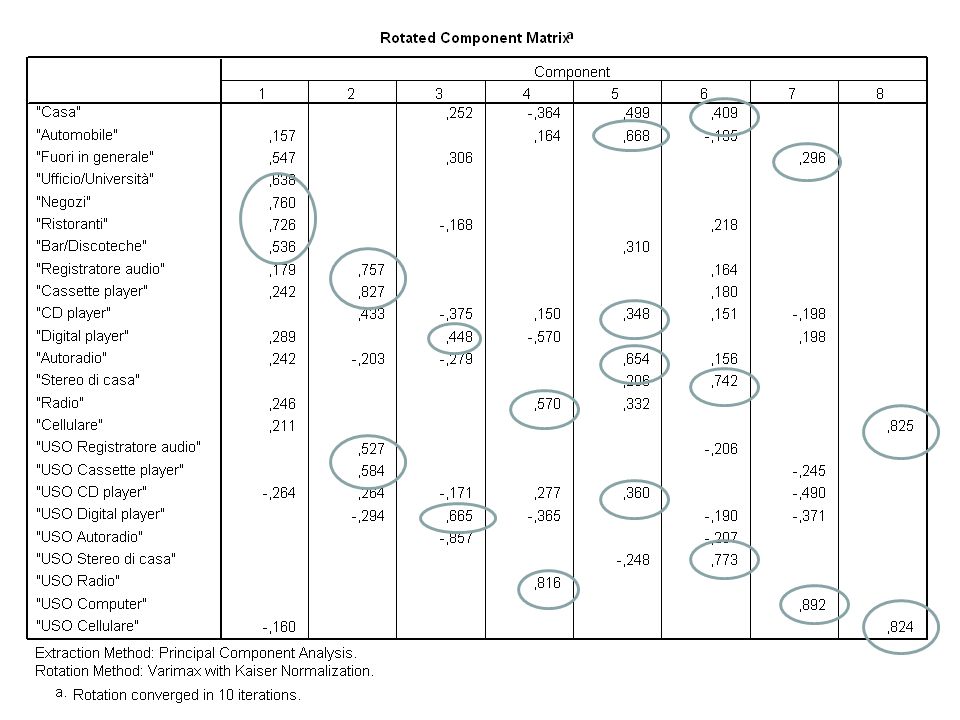
Factor Analysis Interpretation 1.Problems with the 9th component its over. 2.We choosed Varimax option to minimize the number of variables that have elevated saturations for each factor WE CHOOSE THE SECOND HYPOTHESIS

34
Office/University Shops Restaurants Bars/Discoteque OUTSIDE LISTENING Record player Use record player Cassette player Use cassette player STEREO Digital player Use digital player DIGITAL PLAYER Radio Use radio RADIO Car Car stereo CD player Use CD player CAR LISTENING Home House stereo Use house stereo HOUSE LISTENING Outside in general Use PC PC Mobile phone Use mobile phone MOBILE PHONE Factor Analysis Interpretation

Presentazioni simili


>")


