Scaricare la presentazione
La presentazione è in caricamento. Aspetta per favore

1
M. Bruno, F. Cannata, M. DAgostino, E. Geraci, P. Marini, J. De Sanctis, G. Vannini NUCL-EX Collaboration: INFN e Universita Bologna, Firenze, Milano, Napoli, Trieste INFN – Laboratori Nazionali di Legnaro LPC e GANIL – Caen (Francia) IPN – Orsay (Francia) Evidenze sperimentali di transizione di fase liquido-gas nei nuclei Universita BolognaINFN-Bologna
 IPN – Orsay (Francia) Evidenze sperimentali di transizione di fase liquido-gas nei nuclei Universita BolognaINFN-Bologna.")
2
Schema Che osservabili prevede la teoria nelle transizioni di fase Cosa si misura e come Come si analizzano i dati: osservabili, sorting Confronto fra dati e teoria Cosa ancora si deve misurare Non necessariamente in questo ordine !!!

3
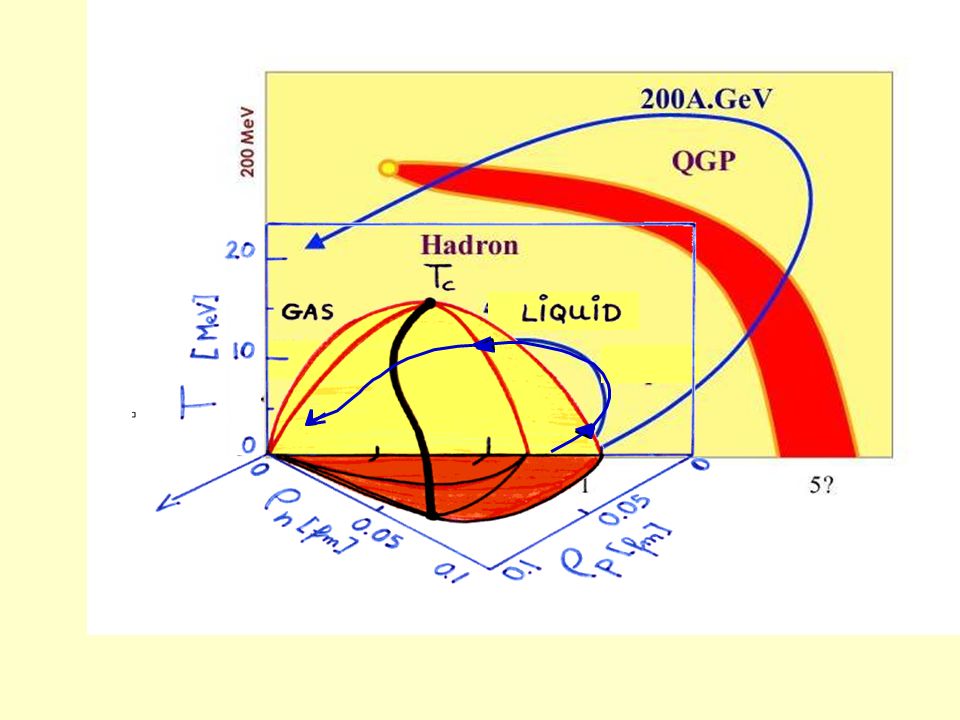
Gas Liquid Density Density Temperature 20200 MeV Plasma of Quarks and Gluons Plasma of Quarks and Gluons Crab nebula July 5, 1054 Collisions Heavy Ion 1: nuclei 5? Phases of Nuclear Matter Philippe Chomaz artistic view Hadronization

4
Transizioni di fase: Keywords QG PlasmaLiquid-Gas Soppressione di canaliJ/ΨRisonanza gigante di dipolo Fenomeno criticodeconfinamentomultiframmentazione Tempi di equilibrio e di rilassamento t eq 1 fm/ct eq 100 fm/c Parametri criticiTemperatura critica (T c 170 MeV) Esponenti critici Temperatura critica (T c 5 MeV) Esponenti critici Fluttuazionitemperatura e molteplicita energia (capacita termica negativa) Ordine della transizionePrimo o secondo?
 Esponenti critici Temperatura critica (T c 5 MeV) Esponenti critici Fluttuazionitemperatura e molteplicita energia (capacita termica negativa) Ordine della transizionePrimo o secondo")
5
H.Jaqaman et al. PRC27(1983)2782 Forze nucleari: repulsive a piccole distanze attrattive a grandi distanze Simili a forze di Van der Waals
2782 Forze nucleari: repulsive a piccole distanze attrattive a grandi distanze Simili a forze di Van der Waals.")
6
Aladin PRL1995 R. Wada et al., PRC 39, 497 (1989) Equazione di stato della materia nucleare Sono possibili transizioni di fase? Il nucleo a basse energie di eccitazione si comporta come un liquido (formula di massa di Weizsäcker) ad alta energie di eccitazione come un gas (modello a gas di Fermi)
 Equazione di stato della materia nucleare Sono possibili transizioni di fase. Il nucleo a basse energie di eccitazione si comporta come un liquido (formula di massa di Weizsäcker) ad alta energie di eccitazione come un gas (modello a gas di Fermi).")
7
Heavy Ion collisions at intermediate energies ~100 fm/c DETECTOR ~20 fm/c (10 -22 sec) ~100 ÷ 1000 fm/c ~10 14 fm/c Vacuum (10 -6 mb) Expansion γ emission Freeze-out configuration For each collision N (charged) products are measured, with: charge Z i, mass m i kinetic energy k i, flying direction θ i, φ i (i=1,N 1 ) Inclusive observables correspond to averages, weighted on the impact parameter
 ~100 ÷ 1000 fm/c ~10 14 fm/c Vacuum (10 -6 mb) Expansion γ emission Freeze-out configuration For each collision N (charged) products are measured, with: charge Z i, mass m i kinetic energy k i, flying direction θ i, φ i (i=1,N 1 ) Inclusive observables correspond to averages, weighted on the impact parameter")
8
H.I. Collisions, intermediate energies (10-100 AMeV): 1-st generation 4π devices The decaying system can be identified and its calorimetric excitation energy can be estimated from the energy balance: Z i, k i, θ i, φ i are measured for almost all charged products, event by event, with high energy resolution (few %) and low energy thresholds (gas detectors) Statistical multidimensional analyses performed on global (event) observables allow to sort the events in classes of centrality. Fragments and particles are detected at ~10 14 fm/c, as they were at 10 3 fm/c, since the propagation in vacuum does not allow further interactions with matter. m i are measured only for light products neutrons and γ are quite often not measured
: 1-st generation 4π devices The decaying system can be identified and its calorimetric excitation energy can be estimated from the energy balance: Z i, k i, θ i, φ i are measured for almost all charged products, event by event, with high energy resolution (few %) and low energy thresholds (gas detectors) Statistical multidimensional analyses performed on global (event) observables allow to sort the events in classes of centrality. Fragments and particles are detected at ~10 14 fm/c, as they were at 10 3 fm/c, since the propagation in vacuum does not allow further interactions with matter. m i are measured only for light products neutrons and γ are quite often not measured.")
9
How many detection cells are needed? N = expected multiplicity, X = number of detectors ε = geometrical coverage/4π = probability to detect 1 particle ε(1) P(double)=(N-1)/(2X) A reasonable compromise is P(double)~few% P(double) = 1% X=250 for N=50, X=2500 for N=500...... etc. ε (N) = ε(1) N
 P(double)=(N-1)/(2X) A reasonable compromise is P(double)~few% P(double) = 1% X=250 for N=50, X=2500 for N= etc. ε (N) = ε(1) N.")
10
Chimera detector@LNS (CT) (~10 3 detection cells) Incident energies up to 50 A.MeV
 (~10 3 detection cells) Incident energies up to 50 A.MeV")
11
Alice detector@CERN (CH) Incident energies up to 500 A.GeV 157 000 cells, 150 m 2 for TOF
 Incident energies up to 500 A.GeV cells, 150 m 2 for TOF")
12
Structure of the measured quantities 1.N 1 (Z i, m i, k i, θ i, φ i, i=1,N 1 ) 2.N 2 (Z i, m i, k i, θ i, φ i, i=1,N 2 ) 3.N 3 (Z i, m i, k i, θ i, φ i, i=1,N 3 ) 4.N 4 (Z i, m i, k i, θ i, φ i, i=1,N 4 ) 5.N 5 (Z i, m i, k i, θ i, φ i, i=1,N 5 )....... X N X (Z i, m i, k i, θ i, φ i, i=1,N X ) X = about 10 8 (some GigaBytes-> some TeraBytes after analysis) event Primary quantities: Each event = N (charged) products, charge Z i, mass m i kinetic energy k i, flying direction θ i, φ i (i=1,N 1 )
 X = about 10 8 (some GigaBytes-> some TeraBytes after analysis) event Primary quantities: Each event = N (charged) products, charge Z i, mass m i kinetic energy k i, flying direction θ i, φ i (i=1,N 1 ).")
13
Structure of the calculated quantities Energy balance: 1.N 1 (Z i, m i, k i, θ i, φ i, i=1,N 1 ) 2.N 2 (Z i, m i, k i, θ i, φ i, i=1,N 2 ) 3.N 3 (Z i, m i, k i, θ i, φ i, i=1,N 3 ) 4.N 4 (Z i, m i, k i, θ i, φ i, i=1,N 4 ) 5.N 5 (Z i, m i, k i, θ i, φ i, i=1,N 5 )....... X N X (Z i, m i, k i, θ i, φ i, i=1,N X ) Global quantities: e.g. Moments m k = Z i k, m 0 = N, m 1 = N, m 2 =N (σ 2 - 2), etc. m 0 (1), m 1 (1), m 2 (1),… m 0 (2), m 1 (2), m 2 (2),… m 0 (3), m 1 (3), m 2 (3),… m 0 (4), m 1 (4), m 2 (4),… m 0 (5), m 1 (5), m 2 (5),…....... m 0 (X), m 1 (X), m 2 (X),… Flow tensor: Correlations
 Global quantities: e.g. Moments m k = Z i k, m 0 = N, m 1 = N, m 2 =N (σ 2 - 2), etc. m 0 (1), m 1 (1), m 2 (1),… m 0 (2), m 1 (2), m 2 (2),… m 0 (3), m 1 (3), m 2 (3),… m 0 (4), m 1 (4), m 2 (4),… m 0 (5), m 1 (5), m 2 (5),… m 0 (X), m 1 (X), m 2 (X),… Flow tensor: Correlations.")
14
Sorting the events with a multidimensional analysis Principal components/Neural networks Filtered CMD model E. Geraci et al.,NPA732(2004)173,NPA734 (2004)524 Flow tensor:
173,NPA734 (2004)524 Flow tensor:.")
15
Sorting the events: multidimensional analysis Central collisions: one source Peripheral collisions: many sources Multics-NPA650 (1999) 329 Z>8 open circles >18 full points >28 open squares >38 full squares >48 open triangles >58 full triangles >68 open crosses MulticsNPA734(2004)487
 329 Z>8 open circles >18 full points >28 open squares >38 full squares >48 open triangles >58 full triangles >68 open crosses MulticsNPA734(2004)487")
16
Multics-NPA724 (2003) 329 Sorting the events: multidimensional analysis Central collisions: one source Peripheral collisions: many sources 124 Sn+ 64 Ni 35MeV/A Chimera data
 329 Sorting the events: multidimensional analysis Central collisions: one source Peripheral collisions: many sources 124 Sn+ 64 Ni 35MeV/A Chimera data")
17
Dalla previsione del fenomeno alla rivelazione Q Theory Experiment+device asymptotic backtrace the data Q,σ Filter the theory (if event by event)* * To be compared with data, Coulomb trajectories are needed. True for: Statistical models Classical Molecular Dynamics Not still true for: Lattice gas model False for: percolation

18
Modelli statistici: esplorazione dello spazio delle fasi Tutte le partizioni sono equiprobabili Nel caso piu semplice, gli input sono: A 0, E 0 =Energia termica di A 0 Da considerazioni geometriche viene calcolata la probabilita' p(A 0,M) che un sistema di A 0 nucleoni venga diviso in M parti intere, servono formule ricorsive, infatti un sistema con A 0 = 100 si puo rompere in 10 8 modi. Si estrae una molteplicita M*, secondo la distribuzione di probabilita p(A 0,M) Si determina (random) la massa degli M* frammenti (partizione di un intero in M* parti), Si determina la energia associata alla partizione scelta e la si accetta se: Q-valore+Coulombiano<= E 0 lenergia rimanente moto termico& energia interna delle M parti....... seguono momenti termici iniziali, traiettorie coulombiane decadimenti secondari, etc. SMM: J.Bondorf et al. NPA 443 (1985) 321, NPA 444 (1985) 460 MMMC: D.E. Gross Phys.Rep. 1993, MMC: Al.&Ad. Raduta, NPA 1999 Failure: residual nuclear interaction
 Si determina (random) la massa degli M* frammenti (partizione di un intero in M* parti), Si determina la energia associata alla partizione scelta e la si accetta se: Q-valore+Coulombiano<= E 0 lenergia rimanente moto termico& energia interna delle M parti seguono momenti termici iniziali, traiettorie coulombiane decadimenti secondari, etc. SMM: J.Bondorf et al. NPA 443 (1985) 321, NPA 444 (1985) 460 MMMC: D.E. Gross Phys.Rep. 1993, MMC: Al.&Ad. Raduta, NPA 1999 Failure: residual nuclear interaction.")
19
Checking equilibrium: uniform population of the available phase space Static observables from liquid+vapor to droplets are reproduced by thermal models Multics-NPA650 (1999) 329 Au source: peripheral collisions symbols: data lines: thermal model (SMM) = 1.5, 2.5, 3.5, 4.5, 5, 6 AMeV Multics-NPA724 (2003) 329 Central collisions
 329 Au source: peripheral collisions symbols: data lines: thermal model (SMM) = 1.5, 2.5, 3.5, 4.5, 5, 6 AMeV Multics-NPA724 (2003) 329 Central collisions")
20
La variazione di energia libera quando si forma una goccia di liquido di massa A da un gas di A+B nucleoni (A e B in equilibrio, cioe alla stessa temperatura e pressione) e data dalla differenza fra: G con goccia = μ A + μ g B + 4π R 2 σ(T) + T lnA G no goccia = μ g (A+B), dove 4π R 2 σ = tensione superficiale della goccia, T lnA = termine che tiene conto che la goccia e finita e la sua superficie e chiusa Fisher inoltre scrive il termine di superficie 4π R 2 σ(T) = 4π r 0 2 A 2/3 σ(T) come a s (T c -T)A σ con σ esponente che descrive il rapporto superficie/volume della goccia e tiene conto del fatto che al punto critico liquido e vapore sono indistinguibili. si puo anche includere δC = variazione della energia di Coulomb, (J.Lopez and C.Dorso,World Scientific -2000) Transizioni di fase: modello di Fisher Transizioni di fase: modello di Fisher (M. E. Fisher, Rep. Prog. Phys. 30 (1967) 615)
 Transizioni di fase: modello di Fisher Transizioni di fase: modello di Fisher (M. E. Fisher, Rep. Prog. Phys. 30 (1967) 615).")
21
Transizioni di fase: modello di Fisher La probabilita (insieme gran canonico) di formazione di una goccia di massa A, a partire da un gas di A+B nucleoni e: Alla coesistenza μ g = μ Al punto critico μ g = μ a s (T-Tc)=0 P(A) = Y 0 A - M. E. Fisher, Rep. Prog. Phys. 30 (1967) 615
 615.")
22
Classical Molecular Dynamics Classical Molecular Dynamics (A.Bonasera) M. Belkacem, V. Latora, A. Bonasera PRC 52(1995)271
271.")
23
Classical Molecular Dynamics Classical Molecular Dynamics (A.Bonasera)
")
24
Au Liquid-Gas c eV IsIs PRL2002 EoS PRC2003 J.Finn et al PRL1982 p+Xe 80-350 GeV A -2.64 Multics NPA724 (2003) 455 Data: Self similarity and scaling Power-laws are free of scales All the information falls on a single curve Scaled yield: P(A)/[Y 0 A - exp(A Δμ/T)] Scaled temperature: A / T P(A)=Y 0 A - exp (A Δμ/T - c 0 A /T) Fisher 1967
![Au Liquid-Gas c eV IsIs PRL2002 EoS PRC2003 J.Finn et al PRL1982 p+Xe GeV A Multics NPA724 (2003) 455 Data: Self similarity and scaling Power-laws are free of scales All the information falls on a single curve Scaled yield: P(A)/[Y 0 A - exp(A Δμ/T)] Scaled temperature: A / T P(A)=Y 0 A - exp (A Δμ/T - c 0 A /T) Fisher 1967](http://images.slideplayer.it/2/602314/slides/slide_24.jpg "Au Liquid-Gas c eV IsIs PRL2002 EoS PRC2003 J.Finn et al PRL1982 p+Xe GeV A Multics NPA724 (2003) 455 Data: Self similarity and scaling Power-laws are free of scales All the information falls on a single curve Scaled yield: P(A)/[Y 0 A - exp(A Δμ/T)] Scaled temperature: A / T P(A)=Y 0 A - exp (A Δμ/T - c 0 A /T) Fisher 1967")
25
Multics: Central from Z 0 =85 to Z 0 =100 (lines) Multics: Au peripheral Z 0 =79 (symbols) Isis: π+Au 8 GeV/c NPA734(2004)487 Fasa: p,α+Au 4-14 GeV NPA709(2002)392 1-st generation 4π devices & stable beams For all multifragmentation experiments, independenly on the entrance channel, the region in which power-laws are observed in reaction observables corresponds to E*/A = 5 +/-1 A.MeV Within a phase-transition scenario, this value represents the transition energy. The current state of nuclear calorimetry permits determination of the E*/A of the fragmenting source to an accuracy of about 20%. Nearly all experiments can be made self-consistent within this range Z -2.1 More information on WCI 2003-2005 in: http://cyclotron.tamu.edu/wci3/ world-wide review of the field of dynamics and thermodynamics with nucleonic degrees of freedom

26
P(A) ha un massimo ad una temperatura T max (A) diverso per ogni A. Dallandamento di T max (A) vs.A si puo ricavare σ. Dai due esponenti σ, τ si possono ricavare altri esponenti critici, tramite le relazioni: β = (τ-2)/σ, γ= (3-τ)/σ e studiare (per dati e modelli) i momenti: m 1 = n s s ~ |ε| β m 2 = n s s 2 ~ |ε| -γ m k = n s s k ~ |ε| (τ-1-k)/σ per verificare la compatibilita delle loro distribuzioni e le loro correlazioni con un comportamento critico Critical exponents from moment analysis
 vs.A si puo ricavare σ. Dai due esponenti σ, τ si possono ricavare altri esponenti critici, tramite le relazioni: β = (τ-2)/σ, γ= (3-τ)/σ e studiare (per dati e modelli) i momenti: m 1 = n s s ~ |ε| β m 2 = n s s 2 ~ |ε| -γ m k = n s s k ~ |ε| (τ-1-k)/σ per verificare la compatibilita delle loro distribuzioni e le loro correlazioni con un comportamento critico Critical exponents from moment analysis.")
27
M. Belkacem, V. Latora, A. Bonasera PRC 52(1995)271 ln (M 2 ) Classical Molecular Dynamics Classical Molecular Dynamics (A.Bonasera) σ= (τ-2)/β, γ= (3-τ)/σ m 1 = n s s ~ |ε| β m 2 = n s s 2 ~ |ε| -γ m k = n s s k ~ |ε| (τ-1-k)/σ Critical « correlations » of static moments liquid branch and gas branch meet at the critical region
271 ln (M 2 ) Classical Molecular Dynamics Classical Molecular Dynamics (A.Bonasera) σ= (τ-2)/β, γ= (3-τ)/σ m 1 = n s s ~ |ε| β m 2 = n s s 2 ~ |ε| -γ m k = n s s k ~ |ε| (τ-1-k)/σ Critical « correlations » of static moments liquid branch and gas branch meet at the critical region.")
28
τ Critical exponents from moment analysis (data) m 1 = n s s ~ |ε| β m 2 = n s s 2 ~ |ε| -γ m k = n s s k ~ |ε| (τ-1-k)/σ σ= (τ-2)/β β β/γβ/γ τ Au Liquid-Gas τ 2.13 0.04 2.196 0.024 γ 1.29 0.01 1.24 0.01 β 0.31 0.04 0.305 0.005 crit = 4.5 ± 0.2 AMeV Multics-NPA650 (1999) 329 EoS: PRC 62 (2000) 064603
 m 1 = n s s ~ |ε| β m 2 = n s s 2 ~ |ε| -γ m k = n s s k ~ |ε| (τ-1-k)/σ σ= (τ-2)/β β β/γβ/γ τ Au Liquid-Gas τ γ β crit = 4.5 ± 0.2 AMeV Multics-NPA650 (1999) 329 EoS: PRC 62 (2000)")
29
Toy modelData Perche studiare le correlazioni? Segnali necessari e/o (?) sufficienti? Review paper: A. Bonasera, M. Bruno, C. O. Dorso and P. F. Mastinu, Riv. Nuovo Cimento 23, 1 (2000) No power law !!!
 No power law !!!.")
30
A0A0 A 0 -1 (A 0 -1)/2 1 Sequential binary decays: evaporation&fission (Gemini) (A 0 -1)/2 ………… Size distributions exponential, not free of scales, not compatible with Fisher scaling
/2 1 Sequential binary decays: evaporation&fission (Gemini) (A 0 -1)/2 ………… Size distributions exponential, not free of scales, not compatible with Fisher scaling")
31
Au Liquid-Gas 2.13 0.04 2.196 0.024 1.29 0.01 1.24 0.01 β 0.33 0.04 0.305 0.005 crit = 4.5 ± 0.2 AMeV Liquid-gas phase transition: is the game over? equilibrated collisions behaving as a universal process, independent of the entrance channel fragment yields described by critical exponents (liquid-gas universality class) We observed: suppression/enhancement of branching ratios (liquid-gas) Can we conclude that the system reached the critical point?
 We observed: suppression/enhancement of branching ratios (liquid-gas) Can we conclude that the system reached the critical point .")
32
Liquid-gas phase transition: is the game over? T? ρ? We have to thermodynamically characterize the system (T,ρ) look at more observables look at thermodynamical models
 look at more observables look at thermodynamical models.")
33
Lattice gas model F. Gulminelli, V.Duflot, Ph.Chomaz PRL 1999 The system is finite: power-laws are found at all densities Also inside the coexistence region Cubic lattice (L 3 ), A 0 nucleons occupy A 0 sites, ρ = A 0 /L 3 occupancy (τ =0,1) from the partition sum: Z(A 0,β)= W(E) exp(-βE) interaction among nearest neighboring
, A 0 nucleons occupy A 0 sites, ρ = A 0 /L 3 occupancy (τ =0,1) from the partition sum: Z(A 0,β)= W(E) exp(-βE) interaction among nearest neighboring.")
34
The surface gives a negative contribution to S Finite systems-Thermodynamical anomalies β=T -1 = S C= E

35
Finite systems-Thermodynamical anomalies T -1 = S Temperature Energy M.S.Challa 1988, D.Gross 1996 Phase II Phase I S=logW Energy Infinite Finite

36
Lattice gas model The caloric curve depends on the transformation (ideal gas) T =E/C V T =E/C p
 T =E/C V T =E/C p")
37
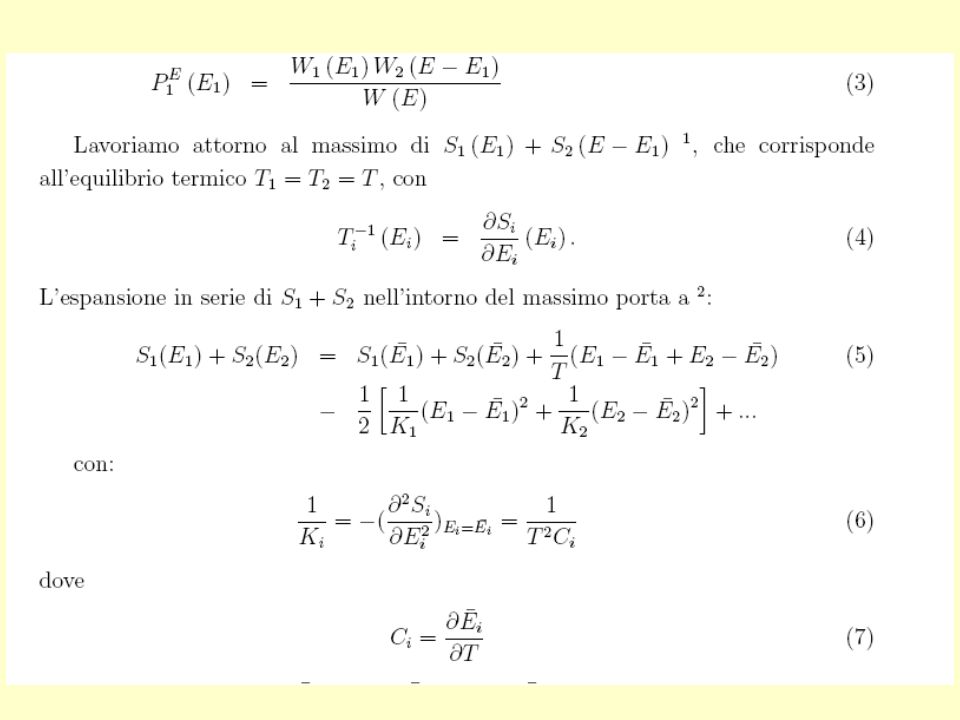
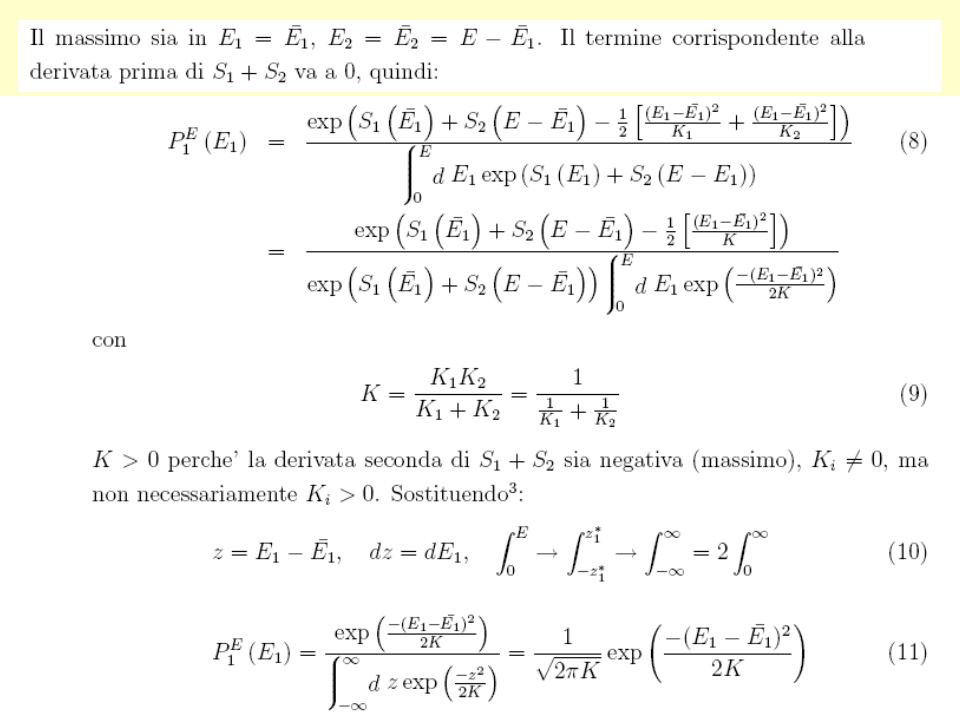
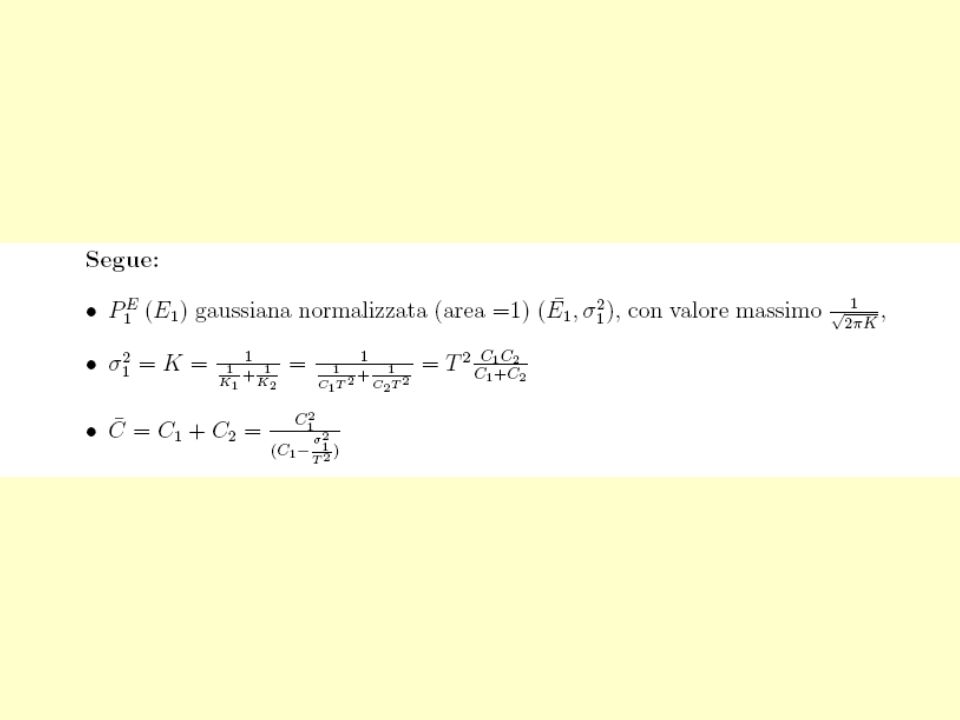
Microcanonical heat capacity of finite systems Microcanonical heat capacity of finite systems Ph. Chomaz, F. Gulminelli NPA 647 (1999) 153 Suddividiamo un sistema con energia E in due sottosistemi 1 e 2, tali che E = E 1 + E 2 W(E) W 1 (E 1 )W 2 (E 2 ) P(E 1 ) = C 1 C 2 T -2 (C 1 +C 2 ) Le fluttuazioni di E 1 (C 1 - σ 1 2 /T 2 ) C12C12 Il calore specifico del sistema C ~= C 1 + C 2 P(E 1 ) E1E1 In corrispondenza del valore piu probabile: 1/T 1 = S 1 / E 1 = S 2 / E 2 = 1/T 2 = 1/T Si dimostra analiticamente che: (S.K. Ma Statistical mechanics- Chap.6) C= 2 = C 1 =E 1 / T C 2 =E 2 / T
 153 Suddividiamo un sistema con energia E in due sottosistemi 1 e 2, tali che E = E 1 + E 2 W(E) W 1 (E 1 )W 2 (E 2 ) P(E 1 ) = C 1 C 2 T -2 (C 1 +C 2 ) Le fluttuazioni di E 1 (C 1 - σ 1 2 /T 2 ) C12C12 Il calore specifico del sistema C ~= C 1 + C 2 P(E 1 ) E1E1 In corrispondenza del valore piu probabile: 1/T 1 = S 1 / E 1 = S 2 / E 2 = 1/T 2 = 1/T Si dimostra analiticamente che: (S.K. Ma Statistical mechanics- Chap.6) C= 2 = C 1 =E 1 / T C 2 =E 2 / T.")
38
Microcanonical heat capacity of finite systems Microcanonical heat capacity of finite systems Ph. Chomaz, F. Gulminelli NPA 647 (1999) 153 2nd order 1st order C = C 1 2 /(C 1 -σ 1 2 /T 2 )
 153 2nd order 1st order C = C 1 2 /(C 1 -σ 1 2 /T 2 ).")
39
Advantages of studying abnormal fluctuations T σ 2 /T 2 p = cte V = cte The caloric curve depends on the transformation Fluctuations are unique energy pressure Ph. Chomaz, F. Gulminelli Nucl. Phys. A 749 (2005) 3 Lattice Gas Model
 3 Lattice Gas Model.")
40
Microcanonical thermodynamics of finite systems The caloric curve depends on the transformation Fluctuations are independent on the transformation, they are state variables Lattice Gas Model

41
Microcanonical thermodynamics of finite systems We can back-trace from data the average volume (ρ) of the system E*= E config + E kin E*= E coul (V)+Q v + E int (T)+E tr (T) Events sorted as a function of E* (calorimetry) the temperature T under the constraint of energy conservation Multics-Nucl.Phys.A699(2002)795
 of the system E*= E config + E kin E*= E coul (V)+Q v + E int (T)+E tr (T) Events sorted as a function of E* (calorimetry) the temperature T under the constraint of energy conservation Multics-Nucl.Phys.A699(2002)795")
42
Early information from measured observables: average volume Circles=Multics data Squares=Coulomb trajectories

43
Early information from measured observables : Temperature Isotope thermometer P.M.Milazzo,PRC58(1998) 953 Indra correlation data N.Marie,PRC58(1998)256 =(3/2) T+ T 2 Multics-NPA699(2002)795 T, E int from independent measurements/methods Liquid-drop Aladin PRL1995
 953 Indra correlation data N.Marie,PRC58(1998)256 =(3/2) T+ T 2 Multics-NPA699(2002)795 T, E int from independent measurements/methods Liquid-drop Aladin PRL1995")
44
Microcanonical heat capacity from fluctuations E*=E config +E kin ( 2 config = 2 kin ) Ph.Chomaz, F.Gulminelli, NPA 647(1999) 153 E kin = E trasl (T)+E internal (T) E config =Q v +E coul (V) The system being thermodynamically characterized: Multics-PLB473 (2000) 219;NPA699 (2002) 795;NPA734 (2004) 512 Microcanonical fluctuations larger than the canonical expectation? C = C kin 2 /(C kin -σ kin 2 /T 2 ) where: C kin =dE kin /dT
 where: C kin =dE kin /dT.")
45
Heat capacity from fluctuations Grey area: peripheral collisions Points: central collisions: Indra: NPA699(2002)795 Au+C Au+Cu Au+Au Multics: PLB473 (2000) 219 NPA699 (2002) 795 NPA734 (2004) 512 1-st order phase transition
795 Au+C Au+Cu Au+Au Multics: PLB473 (2000) 219 NPA699 (2002) 795 NPA734 (2004) st order phase transition")
46
Au Liquid-Gas c eV Liquid-gas phase transition: is the game over? Critical behavior inside the coexistence region Liquid-drop

47
What is left for future measurements? Multics E 1 =2 0.3 E 2 =6.5 0.7 Isis E 1 =2.5 E 2 =7. Indra E 2 =6. 0.5 Coincident experimental information are needed on: critical partitioning of the system, fluctuations calorimetric excitation energy isotopic temperature proximity of the decay products 4π mass and charge detection !! Multics NPA 2004 E * /A (A.MeV) A better quantitative nuclear metrology of hot nuclei
 A better quantitative nuclear metrology of hot nuclei.")
49
2-nd generation devices and exotic beams are needed, to fully investigate the phase transition by changing: the Coulomb properties the isospin content of the fragmenting source the 3-rd dimension of the EoS M.Colonna et al.,PRL 88(2002) 122701 Instability growth time 100 fm/c (dashed/orange) 50 fm/c (dotted/red) More asymmetric systems are less unstable What is left for future measurements?
 Instability growth time 100 fm/c (dashed/orange) 50 fm/c (dotted/red) More asymmetric systems are less unstable What is left for future measurements")
50
FAZIA : Four π A-Z Identification Array ~6000 telescopes Compactness of the device Ebeam from Barrier up to 100 A.MeV Telescopes: Si-ntd/Si-ntd/CsI Possibility of coupling with other detectors Complete Z (~70) and A (~50) id. Low-energy & identification threshold Digital electronics for pulse-shape id. Ions stopped in ONE silicon

52
Systems and subsystems Systems and subsystems S.K. Ma Statistical mechanics- Chap.6

56
T from double ratios: Y(He 3 )/Y(He 4 ) Y(Li 6 )/Y(Li 7 ) V 1 =V 2 Isotope analysis
/Y(He 4 ) Y(Li 6 )/Y(Li 7 ) V 1 =V 2 Isotope analysis")
57
Temperatura Ipotesi: equilibrio slope: effetti dinamici doppio rapporto isotopico si elimina la dipendenza dalle proprieta chimiche popolazione di stati eccitati

58
Symmetry energy and free nucleon densities E. Geraci, et al., Nucl. Phys. A 732 (2004) 173, Nucl.Phys. A734 (2004) 524 = 0.44 ± 0.01 Symmetry Energy~18-20 MeV 112,124 Sn+ 58,64 Ni 35 AMeV central collisions CHIMERA-REVERSE Experiment
 173, Nucl.Phys. A734 (2004) 524 = 0.44 ± 0.01 Symmetry Energy~18-20 MeV 112,124 Sn+ 58,64 Ni 35 AMeV central collisions CHIMERA-REVERSE Experiment.")
59
Δ(Z/A)² D.Shetty et al., P. R.C 70 (2004) 011601 E.Geraci et al.,NPA732(2004) A.Botvina et al., PRC65(2002): Extraction of symmetry energy Asy-soft Asy-stiff Sequential feeding?
 E.Geraci et al.,NPA732(2004) A.Botvina et al., PRC65(2002): Extraction of symmetry energy Asy-soft Asy-stiff Sequential feeding .")
60
1+R(q) ConclusionsConclusions The physics of hot nuclei: a unique laboratory for the thermodynamics of finite, charged, 2-component systems for a quantitative nuclear metrology for interdisciplinary connections Multics E 1 =2 0.3 E 2 =6.5 0.7 Isis E 1 =2.5 E 2 =7. Indra E 2 =6. 0.5 We need: 4 mass and charge detection 20-50 A.MeV radioactive beams Multics NPA 2004 E * /A (A.MeV) 1+R(q) nucl-ex collaboration&garfield
 1+R(q) nucl-ex collaboration&garfield.")
61
J. Pochodzalla et al, PRL 75, 1040 (1995) For the caloric curve one needs to measure: Heavy residue (or QP) Slopes of 1-st chance l.c.p. energy spectra Isotopes (for double ratios) Temperature and caloric curve R. Wada et al., PRC 39, 497 (1989) N.Le Neindre et al, NIM A490 (2002) 251 Sequential feeding?
 For the caloric curve one needs to measure: Heavy residue (or QP) Slopes of 1-st chance l.c.p. energy spectra Isotopes (for double ratios) Temperature and caloric curve R. Wada et al., PRC 39, 497 (1989) N.Le Neindre et al, NIM A490 (2002) 251 Sequential feeding .")
62
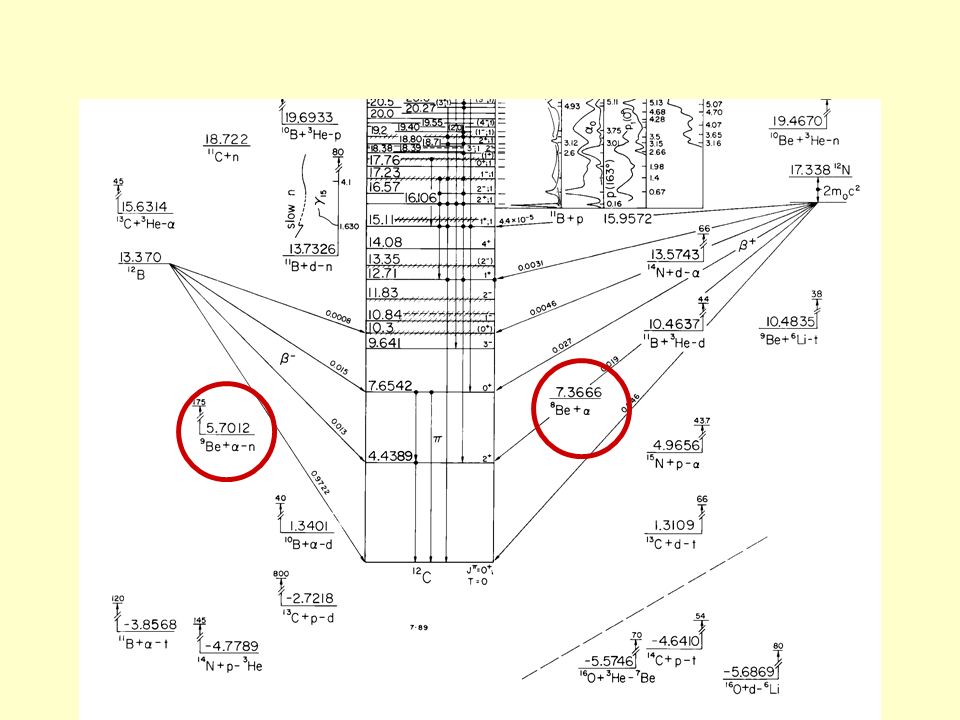
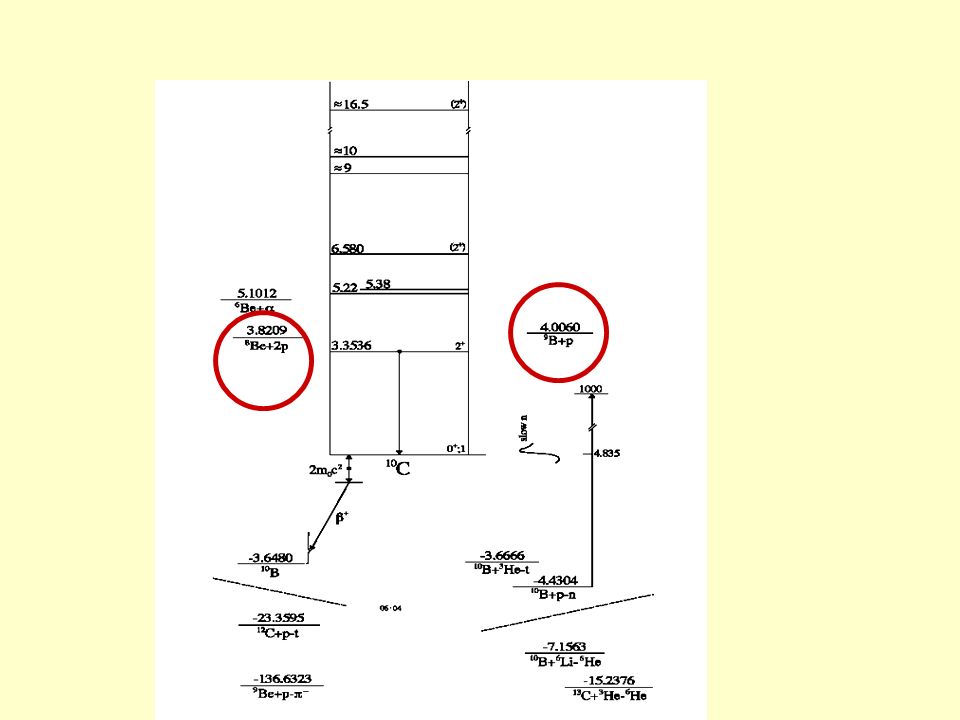
Experiments with n-rich/poor systems 32 S+ 58,64 Ni 14.5 AMeV 3-IMF events Before drawing conclusions on temperature, densities: Isotope emission time scales have to be checked through correlation functions nucl-ex collaboration&garfield@LNL Observed 35 resonances, from He 4 (d+d) to Ne 20 (a+O 16 ) A rough calculation of feeding correction through correlation functions suggests an increase of T by 0.5 MeV for few % of decrease in the He 4 yield
 to Ne 20 (a+O 16 ) A rough calculation of feeding correction through correlation functions suggests an increase of T by 0.5 MeV for few % of decrease in the He 4 yield")
63
Position-sensitive hodoscope Pochodzalla et al., PRC35 (1987)1695 t-α correlation function (Li 7 *) m=multiplicity, N=number of detectors ε (m) = ε(1) m P(double)=(m-1)/(2N) A reasonable compromise is P(double)<5% For m=3 N=10 Resonance spectroscopy
1695 t-α correlation function (Li 7 *) m=multiplicity, N=number of detectors ε (m) = ε(1) m P(double)=(m-1)/(2N) A reasonable compromise is P(double)<5% For m=3 N=10 Resonance spectroscopy")
64
Why many-body correlations? R.J. Charity et al., PRC63 024611 60 Ni+ 100 Mo 11 A.MeV α-particles α-αα-α Δθ 0.6 o high granularity but in a limited angular coverage & not HR full identification

67
112 Sn+ 58 Ni and 124 Sn+ 64 Ni 35 AMeV central collisions CHIMERA-REVERSE Experiment E. Geraci, et al., Nucl. Phys. A 732 (2004) 173, Nucl.Phys. A734 (2004) 524 = 0.44 ± 0.01 C sym = Symmetry Energy~18-20 MeV D.Shetty et al., P. R.C 70 (2004) 011601
 173, Nucl.Phys. A734 (2004) 524 = 0.44 ± 0.01 C sym = Symmetry Energy~18-20 MeV D.Shetty et al., P. R.C 70 (2004)")
Presentazioni simili


>")


 2l2 nel canale di decadimento WW (*) 2l2 Dati Spring07 CMSSW_1_3_x 100 pb -1 (47 pagine)>")
 1 Theory of electron transport in semiconductor materials and structures Carlo Jacoboni INFM-CNR National Research Center on.>")
 1 Theory of electron transport in semiconductor materials and structures Carlo Jacoboni INFM-CNR National Research Center on.>")


