Scaricare la presentazione
La presentazione è in caricamento. Aspetta per favore

1
IL CALCIO COME MESSAGGERO INTRACELLULARE

2
Ca2+ è un messaggero intracellulare universale
Ca2+ è coinvolto nella regolazione specifica e selettiva di processi cellulari (contrazione muscolare, fecondazione, trasmissione sinaptica, sopravvivenza, divisione, differenziamento e movimento cellulare, coagulazione, etc.) Ca2+ non può essere visualizzato direttamente per misurare variazioni di Ca2+ si usano specifiche molecole con proprietà ottiche particolari che si modificano a seguito del legame con Ca2+
 Ca2+ non può essere visualizzato direttamente. per misurare variazioni di Ca2+ si usano specifiche molecole con proprietà ottiche particolari che si modificano a seguito del legame con Ca2+")
3
Il calcio intracellulare è altamente compartimentalizzato:
la sua concentrazione nel citosol è mantenuta molto bassa a spese di energia permeazione passiva: canali del calcio permeazione attiva: antiporto Na/Ca e pompe (PMCA e SERCA)
")
4
TECNICHE DI FLUORESCENZA
La fluorescenza è il risultato di un processo a tre stadi che si verifica in molecole chiamate fluorofori o coloranti fluorescenti o sonde stadio 1 – eccitazione stadio 2 – stato eccitato stadio 3 – emissione di fluorescenza

5
DIAGRAMMA DI JABLONSKI
stato elettronico eccitato stato elettronico eccitato emivita della stato eccitato ( s) emissione di fluorescenza eccitazione efficienza quantica stato di riposo fotoni emessi (stadio 3) fotoni assorbiti (stadio 1)
 emissione. di fluorescenza. eccitazione. efficienza quantica. stato di riposo. fotoni emessi (stadio 3) fotoni assorbiti (stadio 1)")
6
indicatori fluorescenti

7
SPETTRO DI FLUORESCENZA

8
STRUMENTAZIONE Sistemi di rivelazione della fluorescenza
sorgente di eccitazione fluoroforo filtri rivelatore Tipi di strumenti spettrofluorimetro microscopio in fluorescenza citometro a flusso

9
CRITERI DI SELEZIONE degli indicatori di calcio
intervallo di interesse della concentrazione di Ca2+ (costante di dissociazione Kd; risposta misurabile 0.1Kd to 10Kd) modalità di misura (dati qualitativi vs. quantitativi, tipo di strumento, sorgente di rumore etc.) intensità della fluorescenza emessa dall’indicatore registrazione simultanea di altri parametri biologici
 modalità di misura (dati qualitativi vs. quantitativi, tipo di strumento, sorgente di rumore etc.) intensità della fluorescenza emessa dall’indicatore. registrazione simultanea di altri parametri biologici.")
10
idrolisi incompleta dell’AM estere perdita di fluoroforo
DIAGRAMMA SCHEMATICO DEL METODO DI CARICAMENTO DEL FLUOROFORO: UTILIZZO DELL’ACETOSSIMETIL (AM) ESTERE PROBLEMI: compartimentazione idrolisi incompleta dell’AM estere perdita di fluoroforo
 ESTERE. PROBLEMI: compartimentazione. idrolisi incompleta dell’AM estere. perdita di fluoroforo.")
11
INDICATORI FLUORESCENTI ECCITATI DA LUCE UV
Fura-2, Indo-1 and derivati Quin-2 and derivati indicatori con affinità intermedia (Fura-4F, Fura-5F & Fura-6F; Benzothiaza-1 & Benzothiaza-2) indicatori a bassa affinità (Fura-FF, BTC, Mag-Fura-2, Mag-Fura-5, Mag-Indo-1)
 indicatori a bassa affinità (Fura-FF, BTC, Mag-Fura-2, Mag-Fura-5, Mag-Indo-1)")
12
Fura-2 eccitazione a 340 e 380 nm. emissione at 510 nm
[Ca2+] dipende dal rapporto Ex340/Ex380, independentemente dalla concentrazione di fura-2 e da altri parametri esterni Ex at 340 nm Ex at 380 nm

13
Indo-1 eccitazione a 380 nm doppia emissione (400 e 475 nm)
[Ca2+ ] = rapporto tra Em400 / Em475 indipendente dalla concentrazione di indo

14
CALIBRAZIONE RAZIOMETRICA
utilizzabile solo con indicatori che presentano shift dello spettro di eccitazione o emissione intensità di fluorescenza misurata a due lunghezze d’onda (con variazioni opposte del segnale a seguito del legame con il Ca2+) elimina le variabili legate a concentrazione dell’indicatore, percorso ottico, intensità di eccitazione, efficienza di rilevazione
 elimina le variabili legate a concentrazione dell’indicatore, percorso ottico, intensità di eccitazione, efficienza di rilevazione.")
15
calibrazione raziometrica

16
esempio di calibrazione con fura-2 mediante utilizzo di ionoforo (ionomicina o simili)
[Ca]=Kd x (R-Rmin)/(R-Rmax) x Sf2/Sb2 Rmin=A1/A2 Rmax=B1/B2 Sf2/Sb2=A2/B2
/(R-Rmax) x Sf2/Sb2. Rmin=A1/A2. Rmax=B1/B2. Sf2/Sb2=A2/B2.")
17
INDICATORI ECCITATI DALLA LUCE VISIBILE - VANTAGGI
possibilità di utilizzo con microscopia confocale laser minore autofluorescenza minor danno e scattering cellulare maggiore assorbanza compatibilità con composti caged

18
INDICATORI ECCITATI NEL VISIBILE
Fluo-3, Rhod-2 e relativi derivati indicatori a bassa affinità: Fluo-5N, Rhod-5N, X-Rhod-5N e relativi derivati Calcium Green, Calcium Orange e Calcium Crimson Oregon Green 488 BAPTA Fura Red Calcein

19
Fluo-3 indicatore eccitato nel visibile (488 nm, sorgente laser Argon). emissione a 525 nm non è raziometrico

20
Fluo-3 e Fura Red l’uso dei due indicatori risolve il problema della calibrazione Fluo-3 (aumento a 525 a seguito del legame con il Ca2+) e Fura Red (diminuzione a 650). entrambi eccitati a 488 nm. [Ca2+ ] dipende dal rapporto Em del Fluo-3 / Em del Fura Red, independentemente dalla [indicatore].
 e Fura Red (diminuzione a 650). entrambi eccitati a 488 nm. [Ca2+ ] dipende dal rapporto. Em del Fluo-3 / Em del Fura Red, independentemente dalla [indicatore].")
21
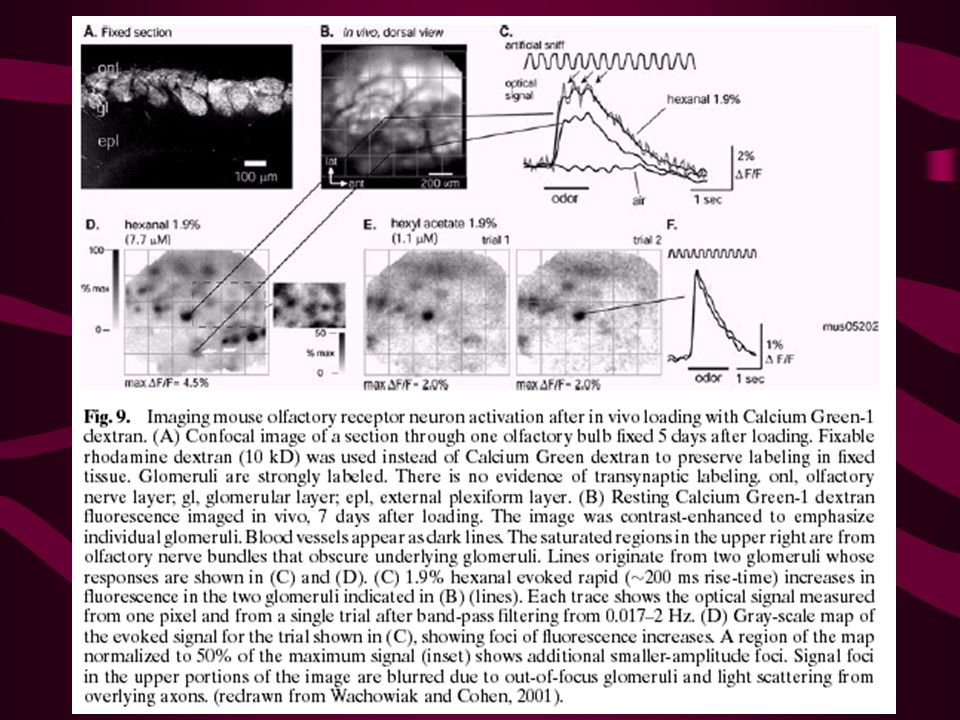
neuroni di bulbo olfattivo di rana fluo3 e fura red
risposta del Ca2+ a trattamento con KCl e nifedipina. l’immagine è il rapporto di immagini relative a fluo e fura red acquisite al microscopio confocale.

22
segnale di calcio attivato da recettori metabotropici glutamatergici in neurone purkinje di cervelletto embrionale di topo

23
CONIUGATI DEGLI INDICATORI FLUORESCENTI
coniugati con destrani destrani con fura e indo Calcium Green e Oregon Green 488 BAPTA destrani derivati lipofilici per il rilevamento del calcio sotto membranario Fura-C18 e Calcium Green-C18

24
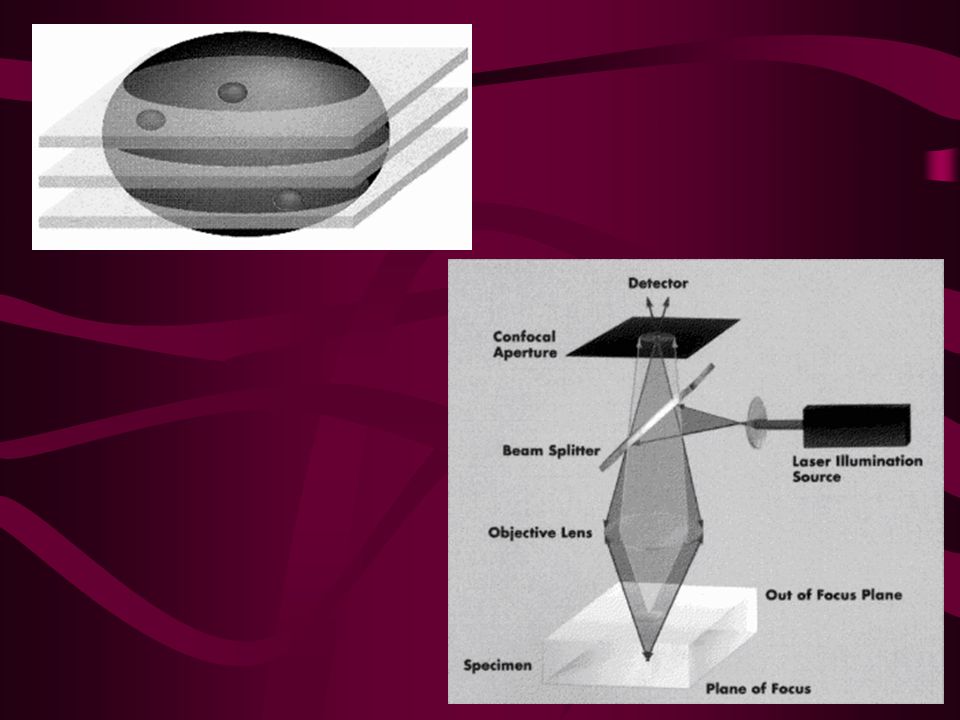
SETUP DI MICROSCOPIA CONFOCALE LASER (CLSM)
la CLSM consente di isolare sezioni ottiche di un preparato e di ricostruire tridimensionalmente le variazioni di calcio

27
control 100 ng/ml bFGF 1 3 2

28
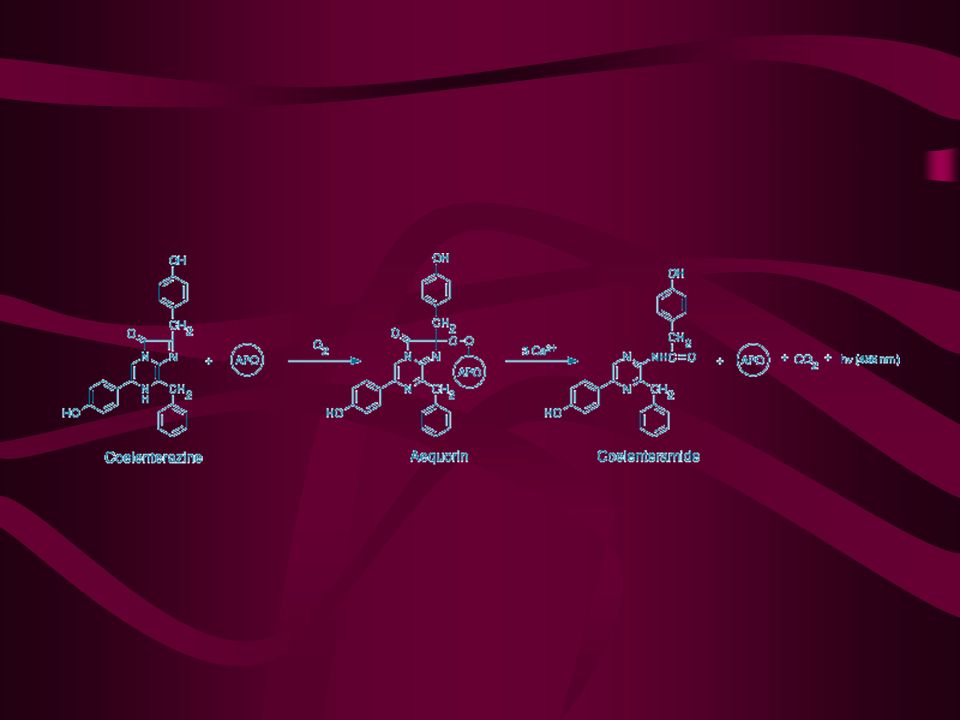
INDICATORE BIOLUMINESCENTE
la bioluminescenza è la produzione di luce operata da fotoproteine presenti in alcuni organismi la bioluminescenza non richiede illuminazione l’intensità luminosa è generalmente bassa L’equorina è una fotoproteina luminescente isolata da una medusa l’equorina non è esportata o secreta, ma deve essere microiniettata nelle cellule

31
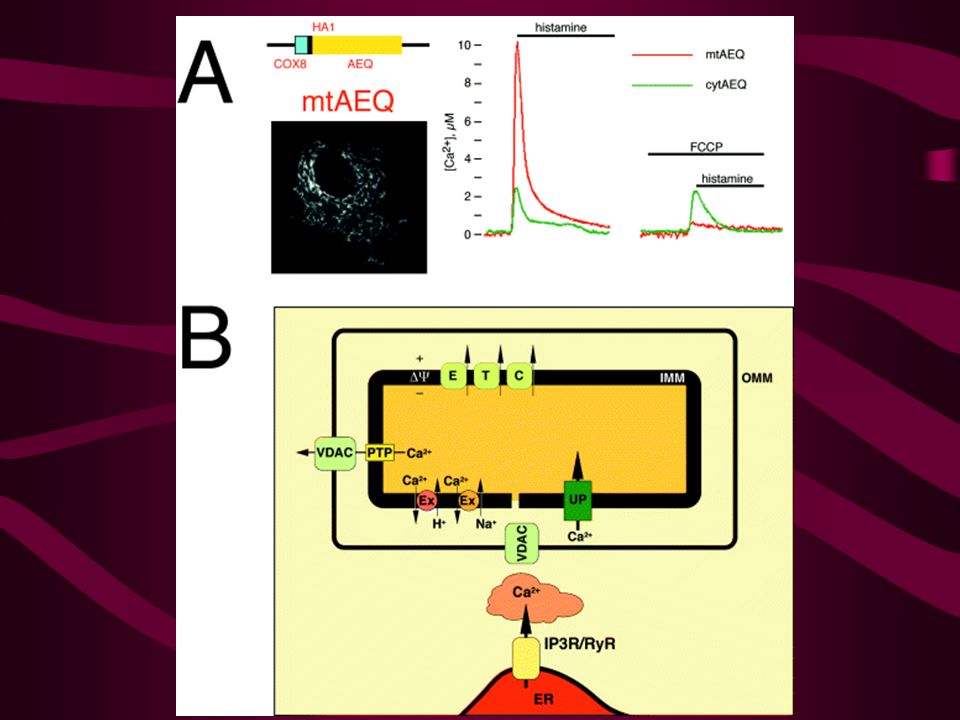
l’equorina ricombinante consente di misurare le variazioni di calcio in distretti intracellulari diversi (mitocondri, nucleo...)
")
34
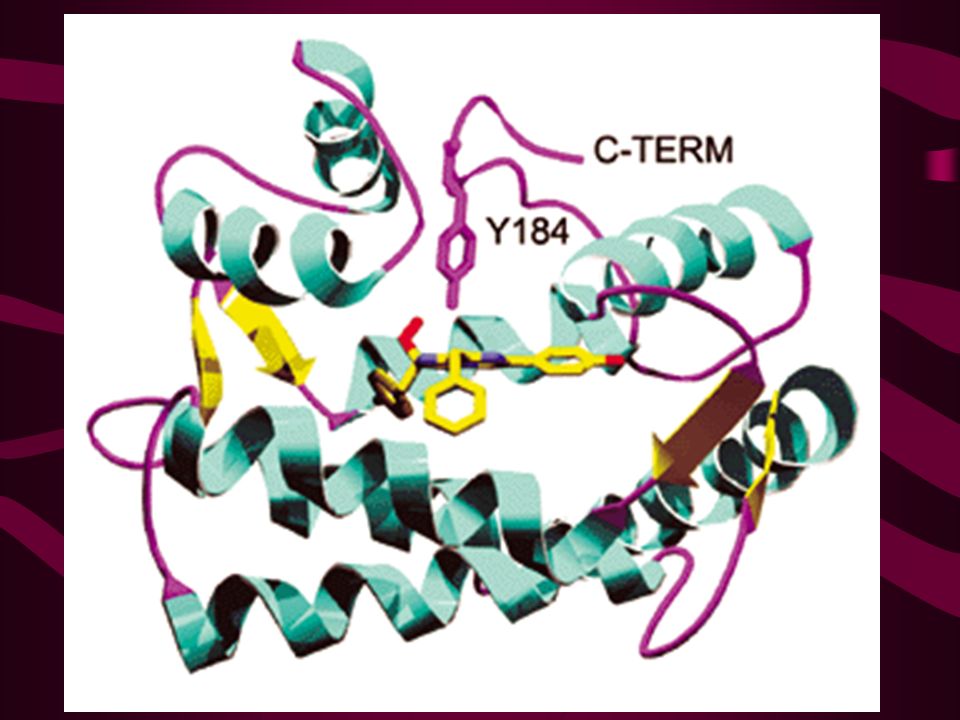
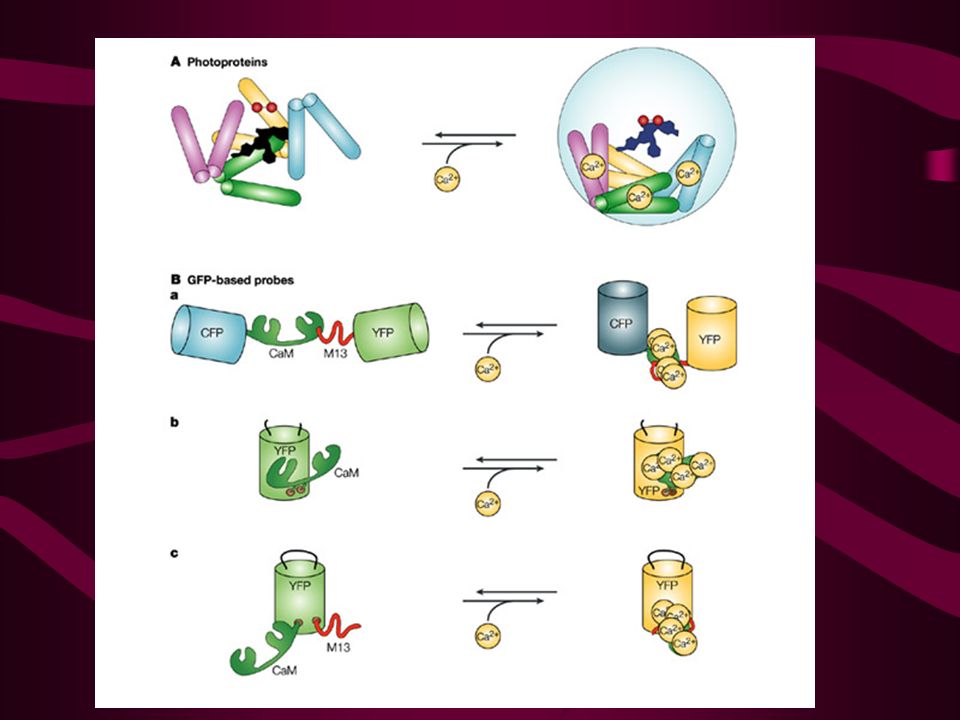
Photoproteins A Ca2+-induced conformational change of the apoprotein (depicted as a rod-shaped structure) leads to peroxidation of the coenzyme (the reduced form of the coenzyme coelenterazine is shown in black and the oxidized form, coelenteramide, is shown in dark blue), which results in the release of blue light (see figure, part A). Red circles represent the peroxide molecules.
 leads to peroxidation of the coenzyme (the reduced form of the coenzyme coelenterazine is shown in black and the oxidized form, coelenteramide, is shown in dark blue), which results in the release of blue light (see figure, part A). Red circles represent the peroxide molecules.")
36
GFP-based probes In the case of cameleon, a Ca2+-induced interaction between calmodulin (CaM) and the CaM-binding peptide M13 increases fluorescence resonance energy transfer (FRET) leading to a decrease in the fluorescence of cyan fluorescent protein (CFP) and an increase in the fluorescence of yellow fluorescent protein (YFP) (see figure, part Ba). A similar FRET-based probe, FIP-CB, was constructed that measured the concentration of free Ca2+ as a decrease of FRET (not shown). For the camgaroo probe, the Ca2+-induced conformational change in CaM leads to an increase in the fluorescence of YFP (see figure, part Bb). The Ca2+-induced interaction between CaM and the binding peptide M13 of pericam leads to changes in the fluorescence characteristics of circularly permuted (cp)YFP (see figure, part Bc). A similar probe with circularly permuted enhanced green fluorescent protein (cpEGFP) has also been developed (not shown).
 and the CaM-binding peptide M13 increases fluorescence resonance energy transfer (FRET) leading to a decrease in the fluorescence of cyan fluorescent protein (CFP) and an increase in the fluorescence of yellow fluorescent protein (YFP) (see figure, part Ba). A similar FRET-based probe, FIP-CB, was constructed that measured the concentration of free Ca2+ as a decrease of FRET (not shown). For the camgaroo probe, the Ca2+-induced conformational change in CaM leads to an increase in the fluorescence of YFP (see figure, part Bb). The Ca2+-induced interaction between CaM and the binding peptide M13 of pericam leads to changes in the fluorescence characteristics of circularly permuted (cp)YFP (see figure, part Bc). A similar probe with circularly permuted enhanced green fluorescent protein (cpEGFP) has also been developed (not shown).")
37
Sensitivity to pH is a bigger problem with GFP-based indicators than with synthetic dyes. With the synthetic dyes, pH has an effect on fluorescence and Ca2+ affinity only below about pH 6.5, whereas with most GFP-based probes, even pH changes around neutral can lead to marked changes in fluorescence. Finally, it is worth pointing out that the loss of signal (owing to photobleaching and/or photoisomerization) with protein dyes is more significant than with synthetic dyes, and that some GFPs have absorption spectra that are not suitable for standard confocal microscope laser lines.
 with protein dyes is more significant than with synthetic dyes, and that some GFPs have absorption spectra that are not suitable for standard confocal microscope laser lines..")
38
Fig. 4. Targeting of GFP-based calcium sensors
Fig. 4. Targeting of GFP-based calcium sensors. CYT, cytoplasm; ER, endoplasmic reticulum; MT, mitochondria; NUC, nucleus; PM, plasma membrane; SGs, secretory granules.

40
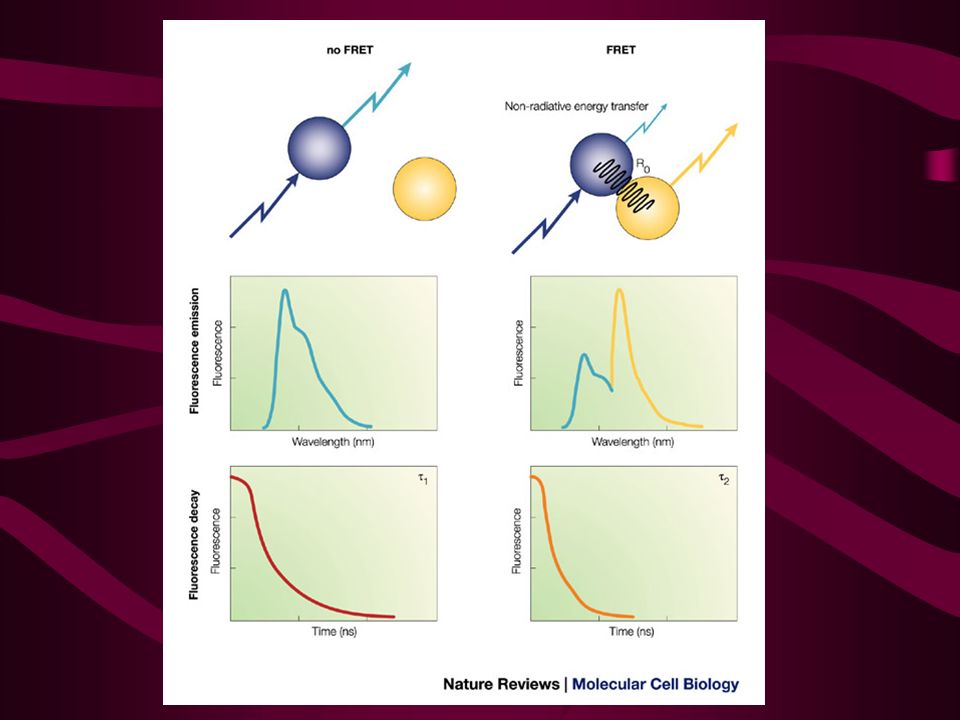
Fluorescence resonance energy transfer (FRET) is a quantum mechanical phenomenon that occurs between a fluorescence donor and a fluorescence acceptor that are in molecular proximity of each other if the emission spectrum of the donor overlaps the excitation spectrum of the acceptor. Under these conditions, energy (E) is transferred non-radiatively from the donor to the acceptor with an efficiency defined by the equation, where r is the distance between the two fluorophores and R0 (Förster distance) is the distance at which 50% energy transfer takes place (typically 20–60 Å).
 is transferred non-radiatively from the donor to the acceptor with an efficiency defined by the equation, where r is the distance between the two fluorophores and R0 (Förster distance) is the distance at which 50% energy transfer takes place (typically 20–60 Å)..")
42
R0 is dependent on the extent of spectral overlap between the donor and acceptor, the quantum yield of the donor and the relative orientation of the donor and acceptor. Excitation of a donor fluorophore in a FRET pair leads to quenching of the donor emission and to an increased, sensitized, acceptor emission. Intensity-based FRET detection methods include monitoring the donor intensity with or without acceptor photobleaching, the sensitized acceptor emission or the ratio between the donor and acceptor intensity. Methods that are based on fluorescence-decay-kinetics include determining the rate of donor photobleaching, the decrease of donor fluorescence lifetime or the appearance of new components in the acceptor decay kinetics.

46
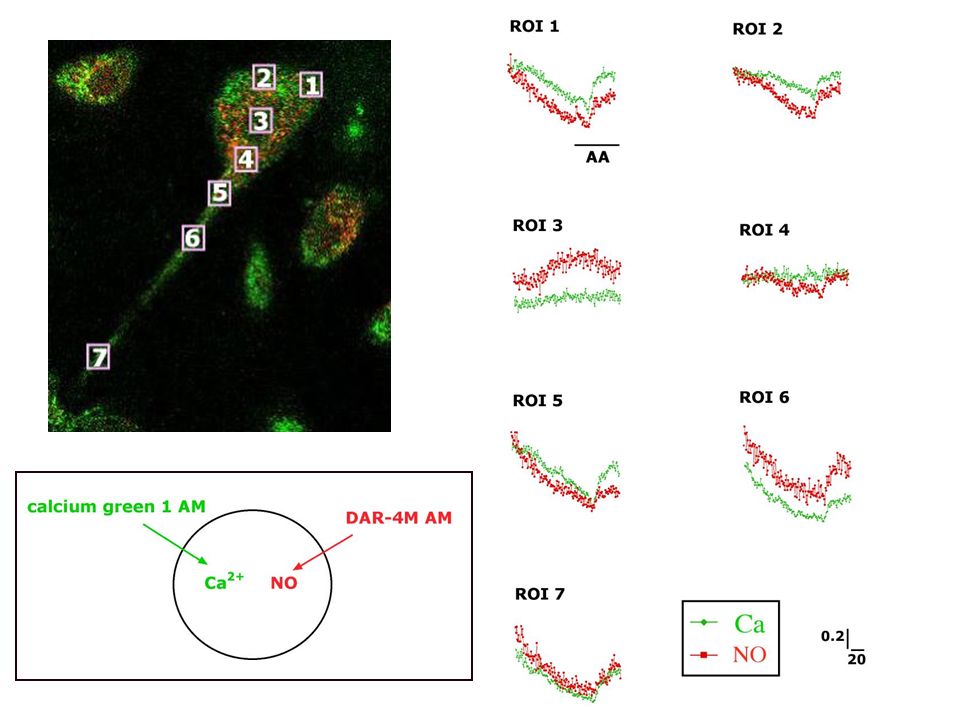
DAR-4M AM indicatore per NO eccitato nel visibile (568 nm, sorgente laser Argon). emissione a 585 nm non è raziometrico

48
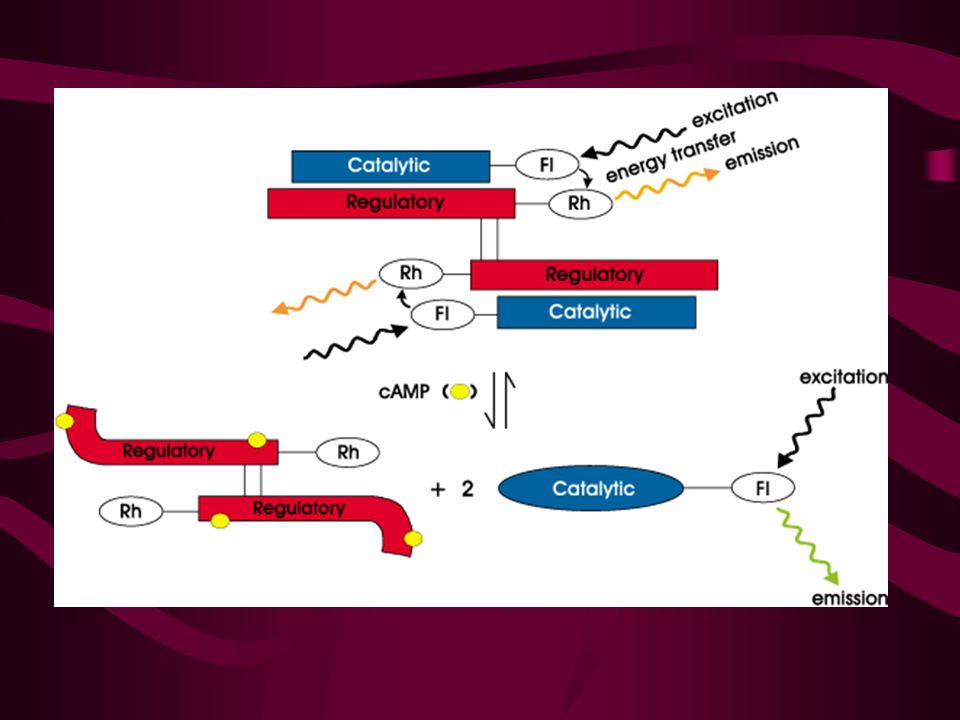
(Figura successiva) Schematic depiction of the structure and response mechanism of Cyclic AMP Fluorosensor (FlCRhR). Fluorescence resonance energy transfer from the fluorescein-labeled (Fl) catalytic subunit to the rhodamine-labeled (Rh) regulatory subunit is eliminated upon cAMP-dependent dissociation of the holoenzyme. The resulting increase of the 488 nm light–excited fluorescein (520 nm) to rhodamine (580 nm) emission ratio can be used to measure intracellular cAMP.
 catalytic subunit to the rhodamine-labeled (Rh) regulatory subunit is eliminated upon cAMP-dependent dissociation of the holoenzyme. The resulting increase of the 488 nm light–excited fluorescein (520 nm) to rhodamine (580 nm) emission ratio can be used to measure intracellular cAMP..")
Presentazioni simili


>")


>")


