Scaricare la presentazione
La presentazione è in caricamento. Aspetta per favore

2
Feedback negativo + - Perturbazione Variabile controllata Set point
effettore - oscillazione ritardo sensore Feedback negativo

10
Decomposizione spettrale
B C

11
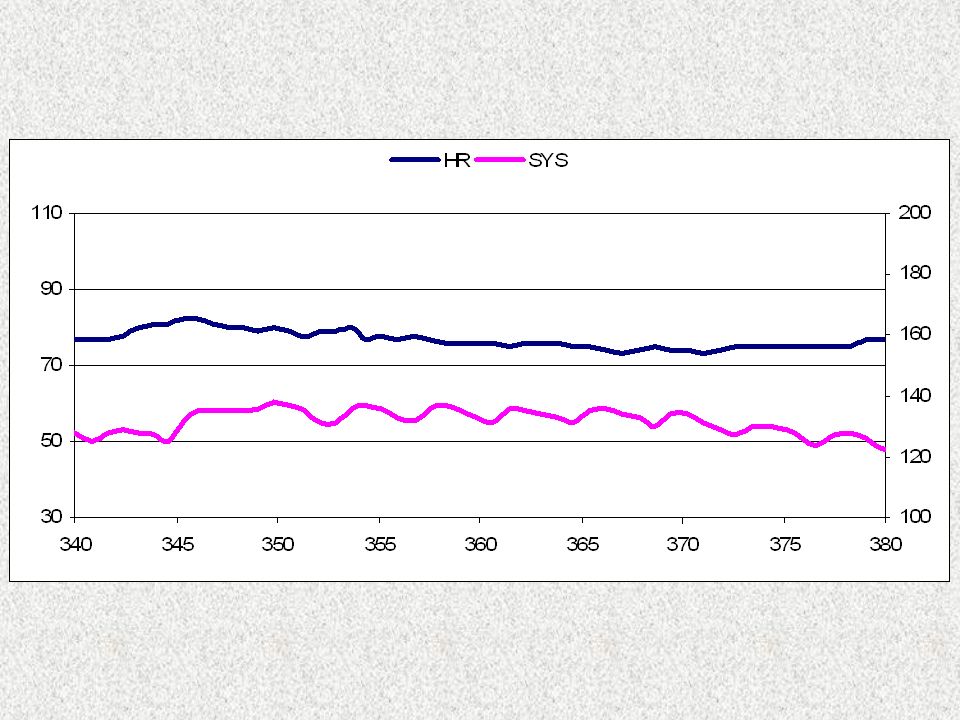
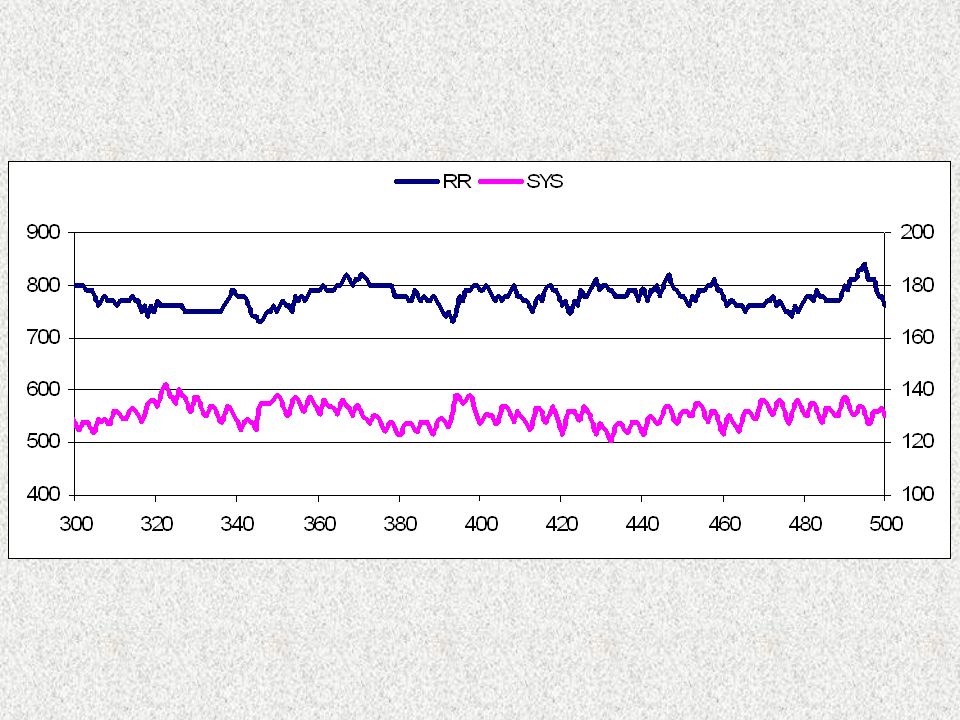
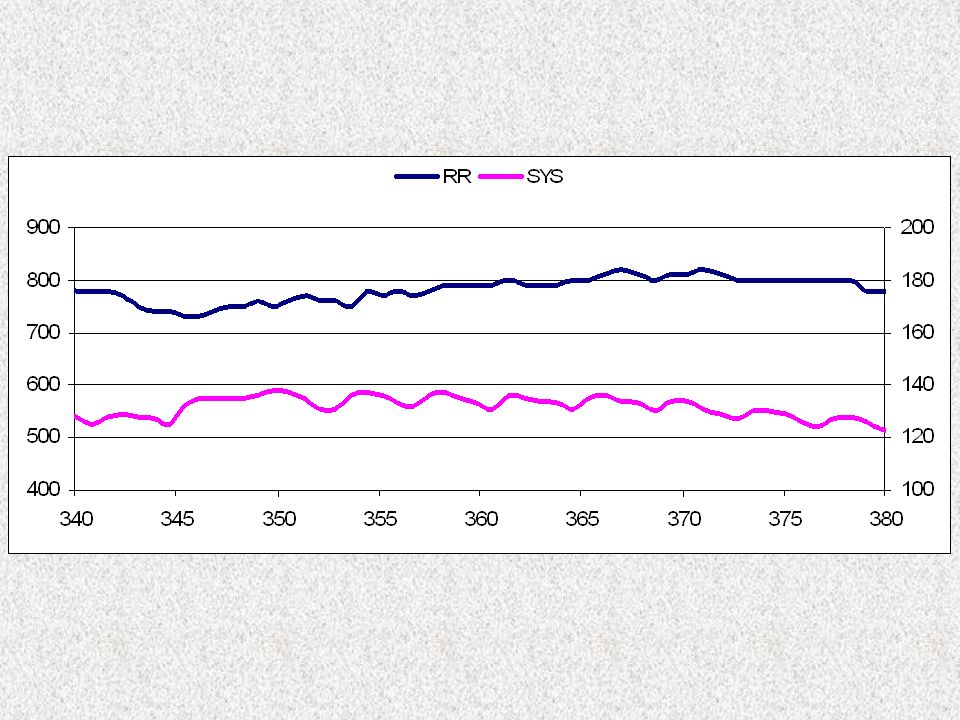
Variabilità spontanea RR
Serie temporale del periodo cardiaco RR

12
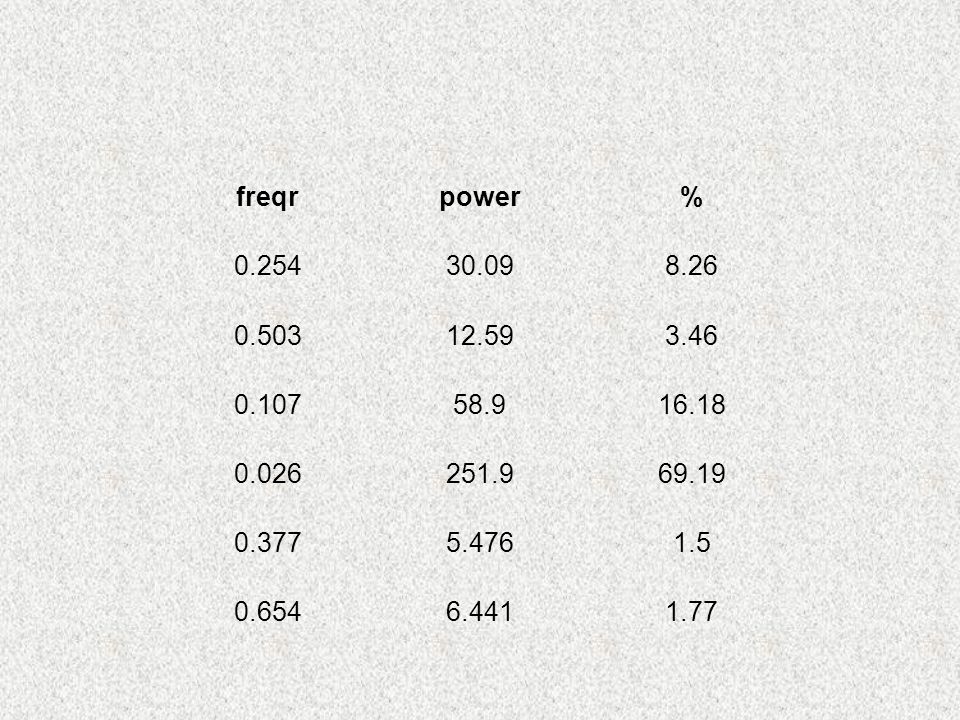
Variabilità spontanea RR
effetto del simpatico? effetto del vago LF HF Analisi spettrale

13
freqr power % 0.254 30.09 8.26 0.503 12.59 3.46 0.107 58.9 16.18 0.026 251.9 69.19 0.377 5.476 1.5 0.654 6.441 1.77
15
L’analisi cross-spettrale
Ritardo di fase Coerenza dei segnali x y Funzione di trasferimento X = FTR * Y Quantificazione del ritardo in gradi

16
Risultati nel dominio delle frequenze
FUNZIONE DI TRASFERIMENTO COERENZA FASE

19
Breve riepilogo delle principali pubblicazioni del mio gruppo

20
Am. J. Physiol 268: H7-H16, 1995

21
Cane anestetizzato: arto isolato e perfuso a pressione costante

22
Valvola di Starling invertita

23
Tracciati da esperimento campione

24
Serie temporali da esperimento campione

25
Analisi spettrale da esperimento campione

26
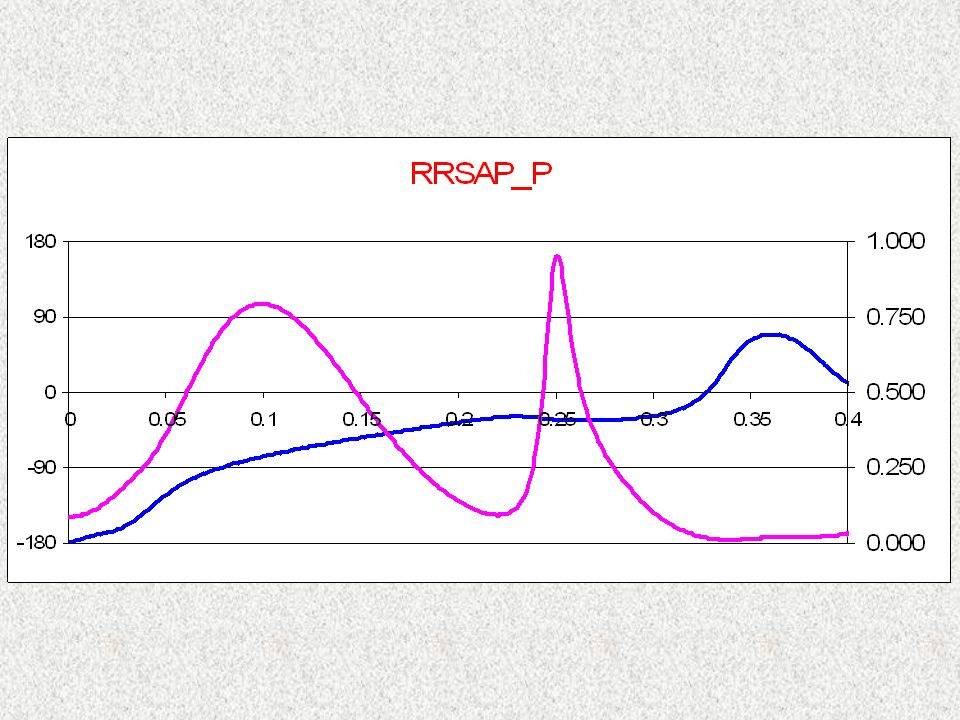
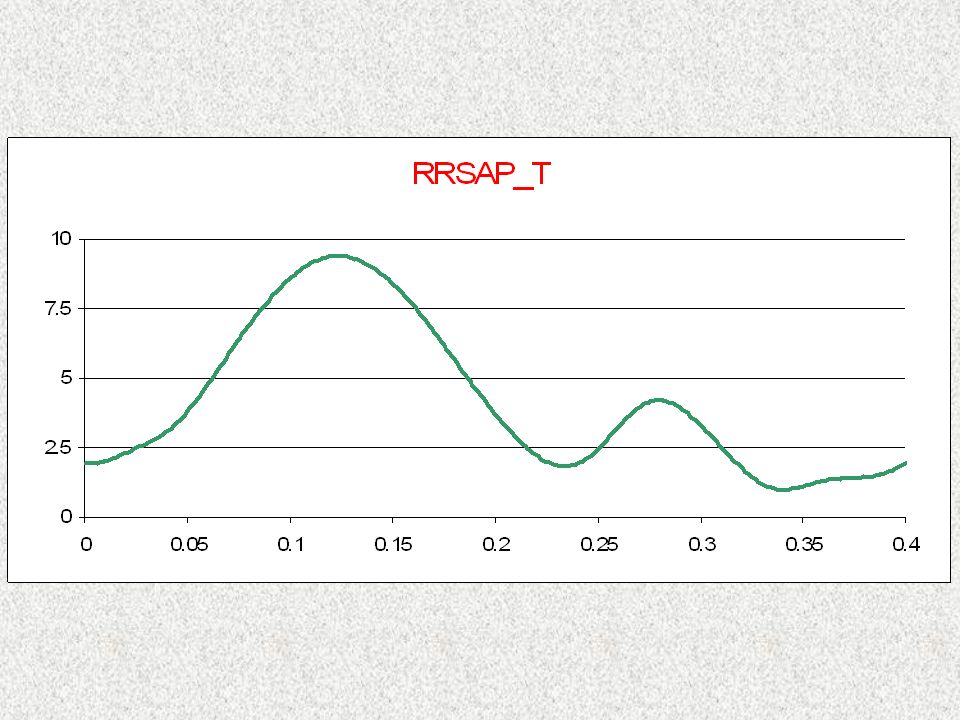
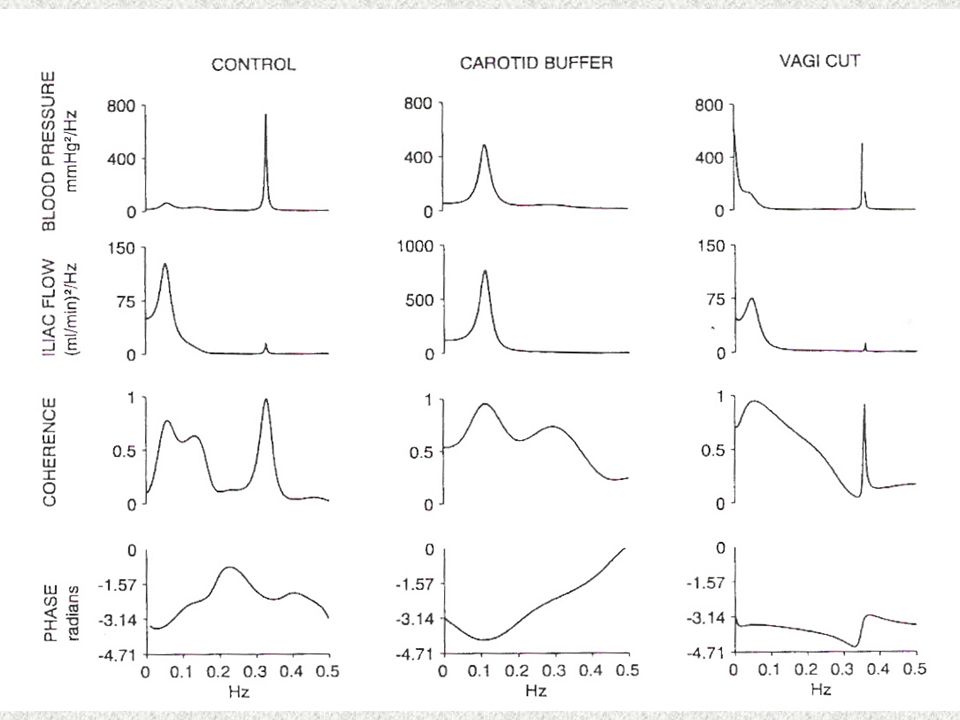
Analisi cross-spettrale da esperimento campione

27
Trasformazione RR-HR e FLOW-RESISTANCE

28
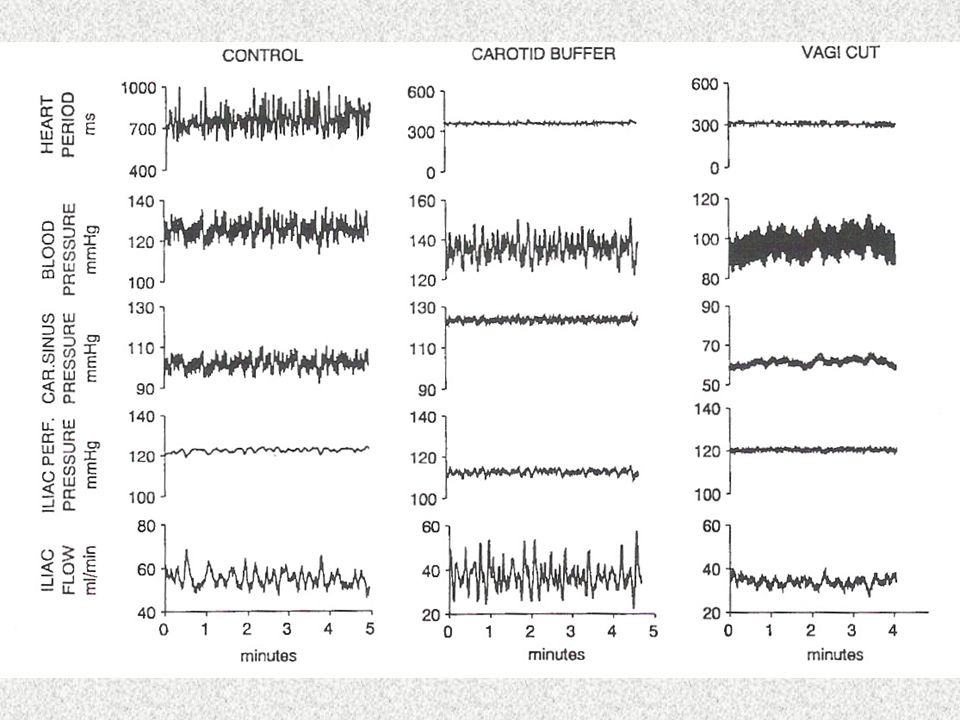
Le conclusioni di questo lavoro affermano che, nel cane anestetizzato con cloralosio, esistono oscillazioni a bassa frequenza (LF) provocate da un’oscillazione intrinseca dei centri bulbari. Le oscillazioni del flusso iliaco sono dovute a variazioni di resistenza. Le variazioni delle resistenze periferiche totali causano le oscillazioni della pressione arteriosa. Le variazioni della frequenza cardiaca precedono quelle del flusso iliaco e della pressione arteriosa perché la via efferente simpatica e la risposta cronotropa del cuore sono più veloci.

32
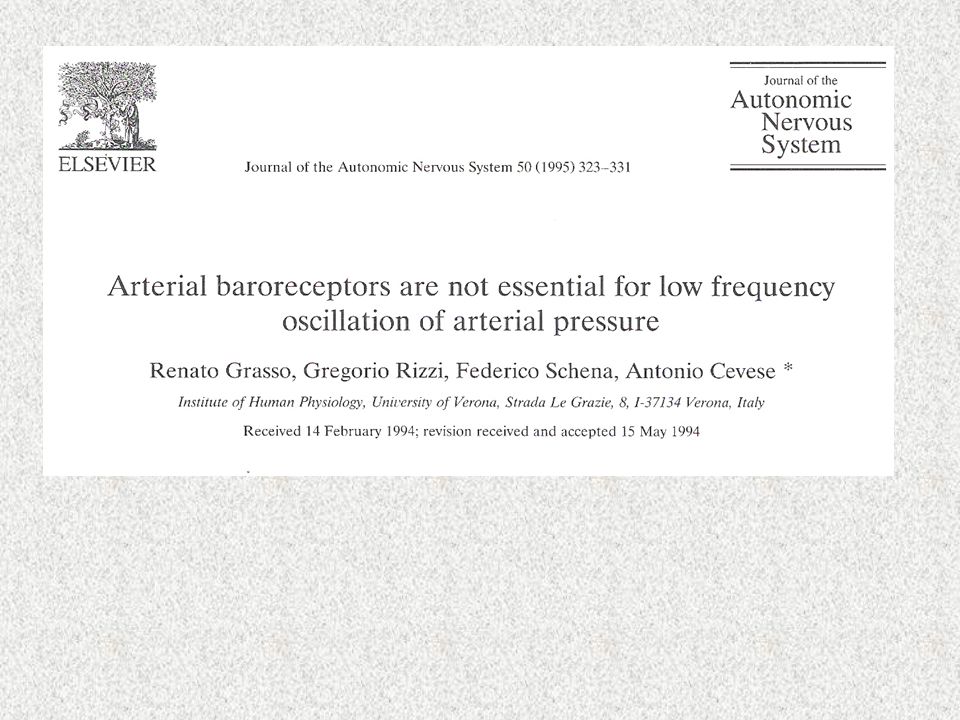
Le conclusioni di questo lavoro affermano che, nel cane anestetizzato con cloralosio, le oscillazioni a bassa frequenza (LF) di pressione arteriosa e di flusso (resistenze) iliaco non dipendono dai barocettori. Sono modificate, ma non abolite, dal taglio dei vaghi

35
Analisi cross-spettrale RR-SP Continua: controllo
Tratteggiata: alfa blocco + angio II

36
Potenza LF in 8 soggetti: barre piene controllo; barre vuote alfa blocco + angio II

37
Il blocco dei recettori alfa adrenergici nell’uomo, conservando i valori della pressione arteriosa mediante infusione di angiotensina II, elimina le oscillazioni LF sia della pressione sia del periodo RR. Le LF cardiache a 0.1 Hz non sono dovute all’attività del simpatico sul cuore

38
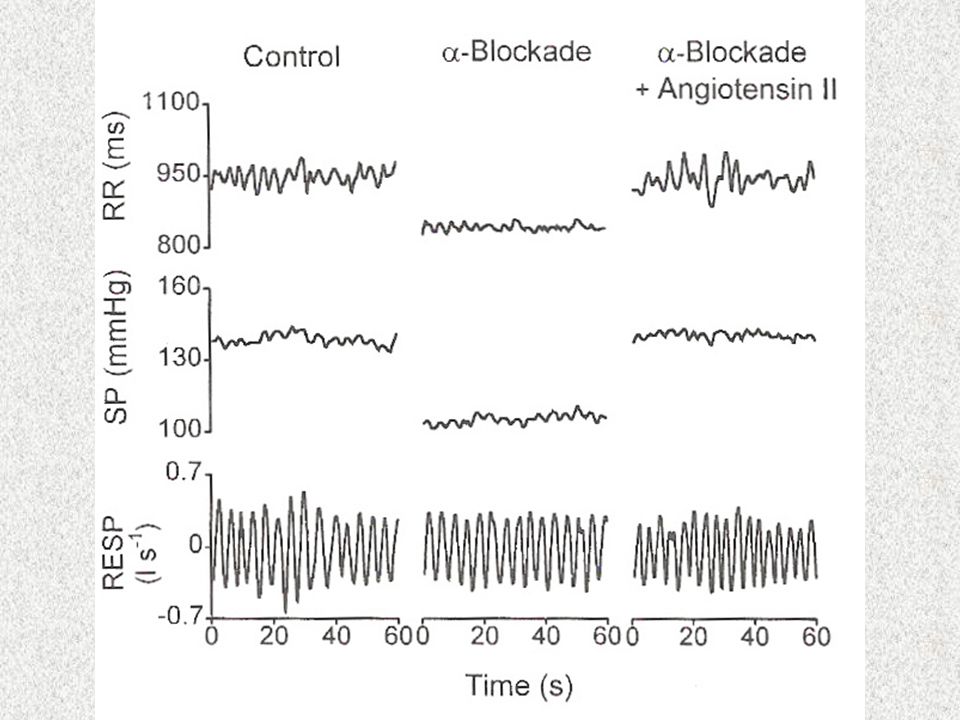
Serie temporali filtrate e amplificate
A = controllo B = alfa blocco + angio II C = idem ma con trasformazione RR-HR

39
Dopo la soppressione dell’attività vasomotoria mediante alfa blocco, in molti soggetti compaiono oscillazioni di RR e SP a circa 0.05 Hz perfettamente in fase. Interpretazione: emerge attività oscillatoria simpatica sul cuore a frequenza ≈ alla metà delle LF, che si trasmette direttamente a SP

42
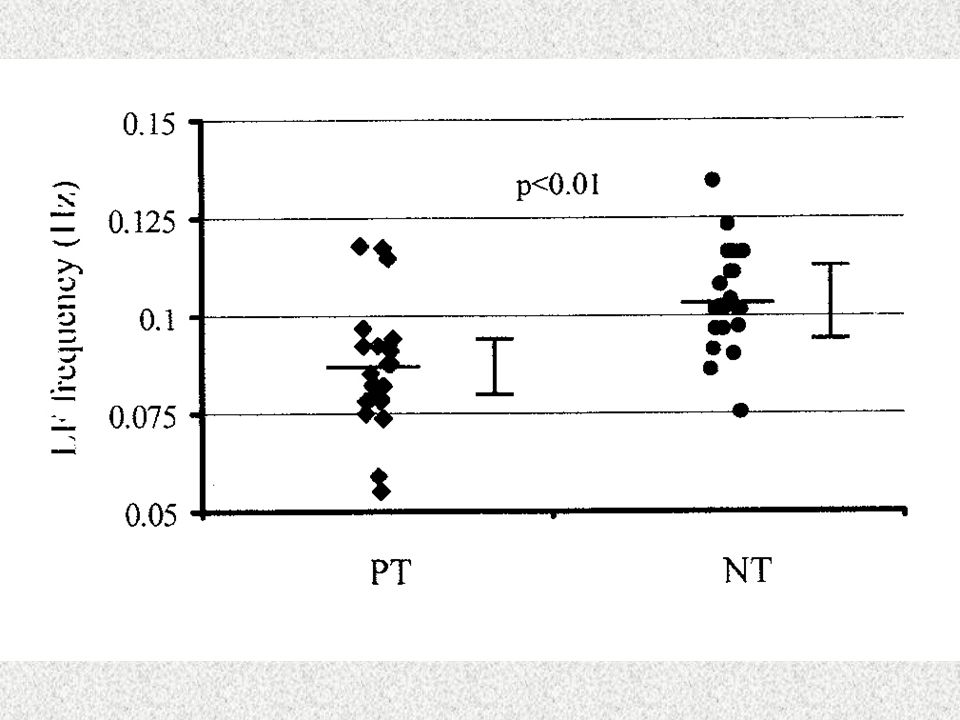
La frequenza della componente LF (analisi cross-spettrale RR-SP, picco di coerenza) in posizione supina è significativamente più bassa nei soggetti con ridotta tolleranza ortostatica
 in posizione supina è significativamente più bassa nei soggetti con ridotta tolleranza ortostatica")
44
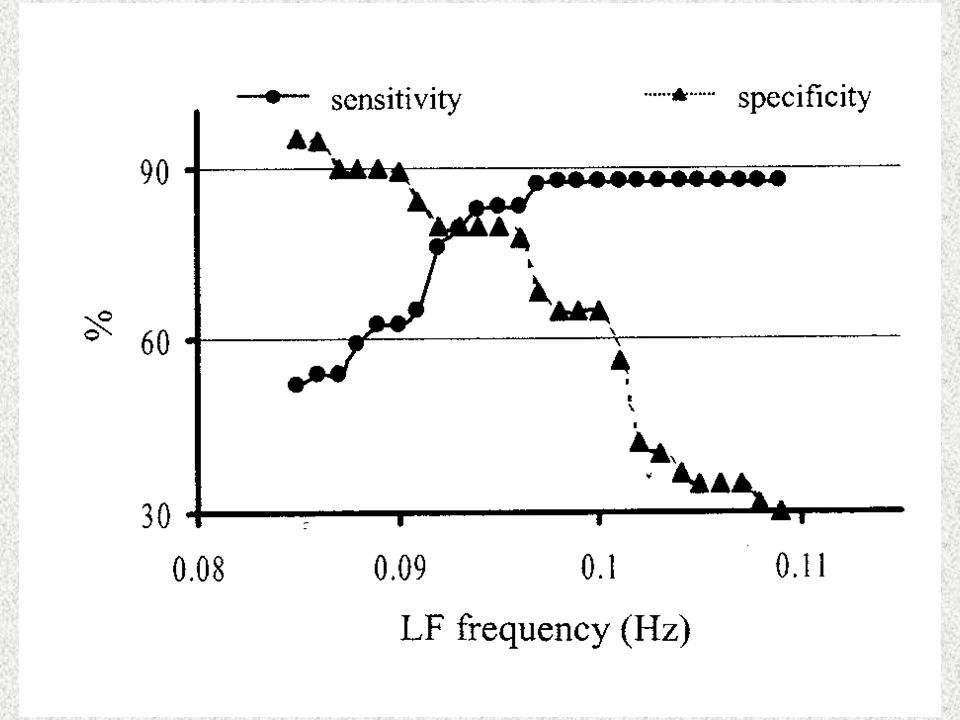
Le curve di specificità e sensibilità si incrociano su valori compresi fra e Hz. Tutti i soggetti con fLF < .091 hanno ridotta tolleranza ortostatica. Tutti i soggetti con fLF > .095 hanno tolleranza normale

46
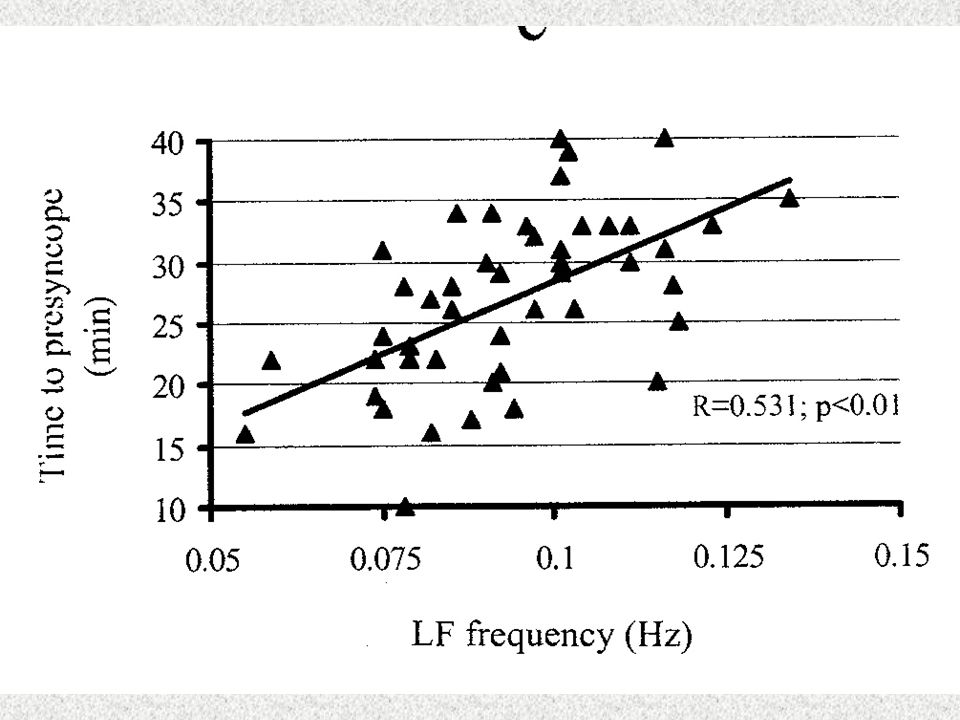
Esiste una discreta correlazione fra fLF e tempo allo svenimento (usato come misura di tolleranza ortostatica)
")
47
Modello di oscillazione del centro vasomotore
vago NA NMDV CO ABP x CVLM - x NTS RVLM IML HR SV TPR CUORE simpatico BARO Modello di oscillazione del centro vasomotore Interferenza del vago attraverso i barocettori

48
vago x - simpatico x NA NMDV CO ABP NTS CVLM RVLM IML HR SV TPR CUORE
BARO

49
The use of heart rate variability measures to assess autonomic
Scand J Med Sci Sports 2006: 16: 302–313 The use of heart rate variability measures to assess autonomic control during exercise G. R. H. Sandercock1,2, D. A. Brodie2

50
Table 1. Descriptions and definitions of HRV measurement terminology
Measure Description SDNN The standard deviation of all normal-to-normal RR intervals Total power (TP) All variation in RR interval within the measured frequency bands Low-frequency (LF) spectral power Variation in RR interval 0.04–0.15 Hz. High-frequency (HF) spectral power Variation in RR interval 0.15–0.40 Hz. Normalized LF spectral power (LFnu) The proportion of spectral power from 0.04 to 0.15 Hz which is in the LF calculated by LF/(TP–VLF) Normalized HF spectral power (HFnu) The proportion of spectral power from 0.15 to 0.40 Hz which is in the HF calculated by HF/(TP–VLF)
 All variation in RR interval within the measured frequency bands. Low-frequency (LF) spectral power Variation in RR interval 0.04–0.15 Hz. High-frequency (HF) spectral power Variation in RR interval 0.15–0.40 Hz. Normalized LF spectral power (LFnu) The proportion of spectral power from 0.04 to 0.15 Hz which is in the LF calculated by LF/(TP–VLF) Normalized HF spectral power (HFnu) The proportion of spectral power from 0.15 to 0.40 Hz which is in the HF calculated by HF/(TP–VLF)")
51
Very low-frequency power (VLF)
The amount of variance of power in the heart’s rhythm explained by periodic oscillations of heart rate at a frequency of –0.04 Hz. LF% The spectral power in the LF band as expressed as a percentage of VLF, LF and HF HF% The spectral power in the HF band as expressed as a percentage of VLF, LF and HF. Poincare´ plots A graphical analysis of RR data in which each interval from a tachogram is plotted as a function of the previous interval. Two-dimensional vector analysis of Poincare´ plots. A statistical method by which an elipse is fitted to the Poincare´ plot. This elipse is then fitted with a both a longitudinal axis (axis 2) and an axis perpendicular to this (axis 1) which defines the transverse slope. The plot is then rotated anticlockwise and clockwise in turn to give the measures
 and an axis perpendicular to this (axis 1) which defines the transverse slope. The plot is then rotated anticlockwise and clockwise in turn to give the measures.")
52
SD1 and SD2 SD1 A representation of the beat-to-beat variability in HR After the clockwise rotation of a Poincare´ plot the SD of the points is calculated on the horizontal axis (2) which passes through the data center SD1 SD2 The standard deviation of long-term RR intervals. After the anticlockwise rotation of the Poincare´ plot the SD of the data points is calculated around the horizontal axis (1) that passes through the center of the data SD2 CGSA Coarse graining spectral analysis. An alternate method of decomposing the RR interval data into the frequency domain which separates the harmonic from the non-harmonic (1/f) HRV component
 which passes through the data center SD1. SD2. The standard deviation of long-term RR intervals. After the anticlockwise rotation of the Poincare´ plot the SD of the data points is calculated around the horizontal axis (1) that passes through the center of the data SD2. CGSA. Coarse graining spectral analysis. An alternate method of decomposing the RR interval data into the frequency domain which separates the harmonic from the non-harmonic (1/f) HRV component.")
53
PNS, parasympathetic branches of the autonomic nervous system.
LO or SNS indicator Harmonic spectral power in the frequency of 0.0–0.15 Hz HI or PNS indicator Harmonic spectral power in the frequency of 0.15–1.0 Hz LO:HI The ratio of LO to HI, used as a measure of sympathovagal balance in CGSA b or 1/fx A plot used to estimate the complexity of a given time series. 1/fx is a regression line of the inverse relationship between power spectra and frequency, known to exist all fractal processes. x is the exponent of the line, sometimes reported in the literature as beta (b) Df The fractal dimension of the non-harmonic component of HRV. It is derived from the values of beta. Df52/(b _1) for values of 1obo3. When bo1Df51. When 0obo1, Df5infinity HRV, heart rate variability; SNS, sympathetic branches of the autonomic nervous system; PNS, parasympathetic branches of the autonomic nervous system.
 Df. The fractal dimension of the non-harmonic component of HRV. It is derived from the values of beta. Df52/(b _1) for values of 1obo3. When bo1Df51. When 0obo1, Df5infinity. HRV, heart rate variability; SNS, sympathetic branches of the autonomic nervous system; PNS, parasympathetic branches of the autonomic nervous system.")
Presentazioni simili


 Brussels, 26 settembre 2013.>")


 is a disease state characterized by airflow limitation that is not fully reversible. The.>")


>")


