Scaricare la presentazione
La presentazione è in caricamento. Aspetta per favore

1
Unione europea e resto del Mondo

2
IL MUTAMENTO DEL QUADRO ECONOMICO MONDIALE 1860- 2000 POPOLAZIONE RESIDENTE E ATTIVA IN ITALIA PER SETTORE (1860 - 1990)
")
3
LEuropa nelleconomia mondiale Bibliografia essenziale –Valli V. Guena A., Burlando R. La politica economica e macroeconomia, Carocci ed.(2010), (parte terza, capp. 15-18) LEuropa nelleconomia mondiale –Declino relativo dei paesi dellEuropa occidentale (1870- 1945) –Ascesa economica relativa degli USA (1870 – 1945) –Ascesa economica relativa del Giappone (1945-1990) –Tentativo di reazione dellEuropa occidentale (1945 ad oggi) –Crisi economica (anni 80 e 90) e politica e sociale (1989-91) dellURSS e Est Europa (fase di transizione) –Ascesa economica relativa della Cina (1978 ad oggi) –Globalizzazione economica e finanziaria (anni 70 fino ad oggi)
, (parte terza, capp ) LEuropa nelleconomia mondiale –Declino relativo dei paesi dellEuropa occidentale ( ) –Ascesa economica relativa degli USA (1870 – 1945) –Ascesa economica relativa del Giappone ( ) –Tentativo di reazione dellEuropa occidentale (1945 ad oggi) –Crisi economica (anni 80 e 90) e politica e sociale ( ) dellURSS e Est Europa (fase di transizione) –Ascesa economica relativa della Cina (1978 ad oggi) –Globalizzazione economica e finanziaria (anni 70 fino ad oggi).")
4
IL MUTAMENTO DEL QUADRO ECONOMICO MONDIALE (1870 - 1987) Prodotto interno lordo di alcuni paesi (USA=100)*
 Prodotto interno lordo di alcuni paesi (USA=100)*")
5
MUTAMENTO DEL QUADRO ECONOMICO MONDIALE (1870 – 2008) Prodotto interno lordo di alcuni paesi (USA=100)* 187019131950197319922008 USA = 100 100 France 73,327,915,119,317,715,0 Germany 73,345,918,226,722,718,1 Italy 42,518,511,316,515,812,2 Netherlands 10,14,84,25,04,54,3 U. Kingdom 101,843,423,919,115,615,3 Spain 19,98,14,27,58,28,4 EU 14 472,4271,6191,4210,9199,6187,8 Fonte: Maddison 2008 http://sites.google.com/site/econgeodata/maddison-data-on-population-gdphttp://sites.google.com/site/econgeodata/maddison-data-on-population-gdp Fonte: Maddison 2008 http://sites.google.com/site/econgeodata/maddison-data-on-population-gdphttp://sites.google.com/site/econgeodata/maddison-data-on-population-gdp

6
187019131950197319922008 USA = 100 100 Russia ---24,715,613,5 Brazil 7,13,76,111,412,513,3 Mexico 6,35,04,67,99,39,2 Latin America 27,823,328,539,340,142,7 China 192,946,716,820,941,593,9 India 137,139,515,314,019,536,0 Japan 25,813,811,135,140,530,6 Total Asia 432,7131,668,1109,0159,5235,0 Total Africa 46,015,413,915,515,218,3 World Total 1128,0528,3366,5452,8469,1537,4 MUTAMENTO DEL QUADRO ECONOMICO MONDIALE (1870 – 2008) Prodotto interno lordo di alcuni paesi (USA=100)*
 Prodotto interno lordo di alcuni paesi (USA=100)*")
7
Population GDP, GDP per Capita 2008 Regions & Country Population (Mil) GDP (Billion $) GDP Per Capita (000) EU 14 386,68.323,721,5 Italy 58,11.157,619,9 USA 304,29.485,131,2 Latin America 580,24.045,97,0 Brazil 196,31.262,36,4 Mexico 110,0877,38,0 Asia 3.972,222.288,55,6 Japan 127,32.904,122,8 China 1.324,88.908,96,7 India 1.148,03.415,23,0 Africa 974,51.734,91,8 WORLD 6.694,850.973,97,6
 GDP (Billion $) GDP Per Capita (000) EU ,68.323,721,5 Italy 58,11.157,619,9 USA 304,29.485,131,2 Latin America 580,24.045,97,0 Brazil 196,31.262,36,4 Mexico 110,0877,38,0 Asia 3.972, ,55,6 Japan 127,32.904,122,8 China 1.324,88.908,96,7 India 1.148,03.415,23,0 Africa 974,51.734,91,8 WORLD 6.694, ,97,6")
8
The EU in the world

11
195819731981198619952004¹20062008² 2010 UE/CE 168256271322371457464497 501.1 USA 175212230239262292288282 317.6 Giappone 92109118122126127 ¹UE-25; ² UE-27, Fonte: Eurostat e US Bureau of Census

12
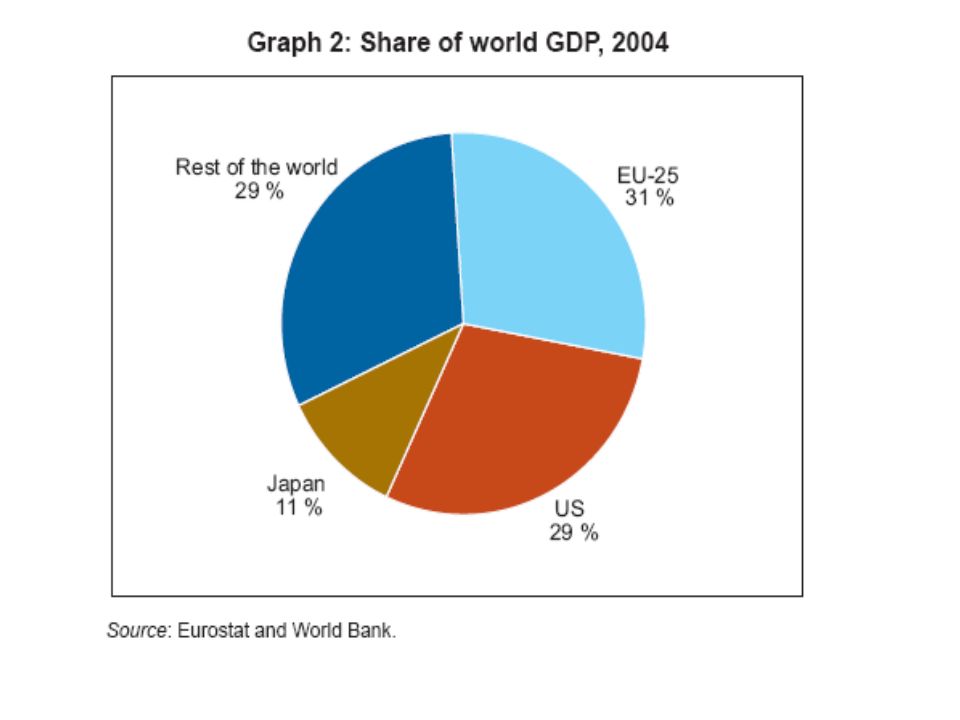
Share of World Population 2004 2010

13
Tab. PIL a confronto in Unione Europea, USA e Giappone (Euro 1000 milioni) 1961197319811986199520042006 2010 UE/CE 2059892309359966081026611583 11791 USA 1123280245355656943310509 10123 Giappone 10562053404037583477 3639 Fonte: Eurostat e Banca Mondiale
 UE/CE USA Giappone Fonte: Eurostat e Banca Mondiale.")
15
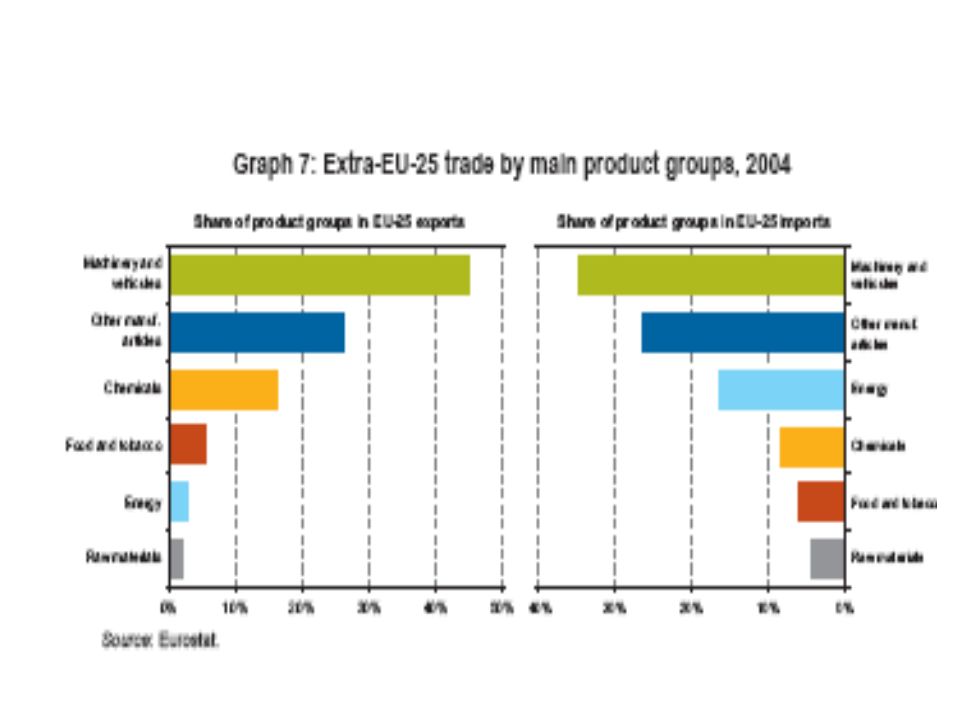
EU in the world trade In 2004, the EU-25 accounted for approximately one fifth of world trade in goods. The EU is one of the main players in world trade (Graph 3): in 2004, nearly one fifth of all imports and exports either arrived in or left the EU. The EU is the worlds leading exporter of goods and the second- largest importer after the US: in 2004, 18 % of all exports were of Community origin and 18 % of all imports came into the EU. The EU direct competitor is the US followed, but some way behind, by China, Japan and Canada. Together, the EU-25, the US, China, Japan and Canada account for more than half of the world trading of goods.
: in 2004, nearly one fifth of all imports and exports either arrived in or left the EU. The EU is the worlds leading exporter of goods and the second- largest importer after the US: in 2004, 18 % of all exports were of Community origin and 18 % of all imports came into the EU. The EU direct competitor is the US followed, but some way behind, by China, Japan and Canada. Together, the EU-25, the US, China, Japan and Canada account for more than half of the world trading of goods..")
16
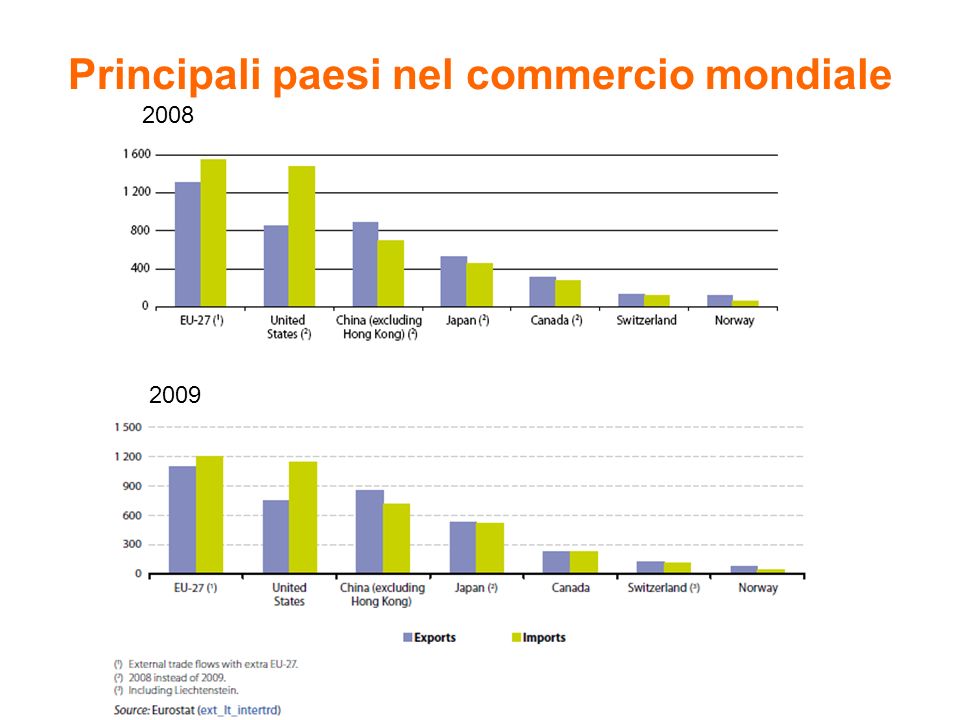
In 2009, the EU-27 accounted for a little less than one fifth of world trade in goods. The EU remains one of the main players in world trade, but the steady increase in EU-27 imports and exports between 2003 and 2008 was reversed in 2009: Exports fell by 16.4 % while imports fell more sharply, by 23.4 %. After 2009 both imports and exports started to follow a slow upward trend. Intra-EU trade decreased in 2009 more markedly than extra-EU exports (- 19 % against -16 %). The United States share of exports remained steady at 20%, while Chinas share rose from 6.0 % to 7.5 % to become the third largest destination for EU- 27 exports after the United States and Switzerland. China was the only major destination to which EU-27 exports rose. Imports were reduced from all main providers (China, United States and Russia) The overall fall of exports was mostly due to declines in the two largest product groups, machinery and vehicles and other manufactured goods. Raw materials experienced the largest fall in imports in relative terms (-37.5 %). Imports of energy products fell by 36.4 %.
. The United States share of exports remained steady at 20%, while Chinas share rose from 6.0 % to 7.5 % to become the third largest destination for EU- 27 exports after the United States and Switzerland. China was the only major destination to which EU-27 exports rose. Imports were reduced from all main providers (China, United States and Russia) The overall fall of exports was mostly due to declines in the two largest product groups, machinery and vehicles and other manufactured goods. Raw materials experienced the largest fall in imports in relative terms (-37.5 %). Imports of energy products fell by 36.4 %..")
17
Principali paesi nel commercio mondiale

18
2008 2009
19
Principali paesi nel commercio mondiale -Exports- 2007 2009

20
Principali paesi nel commercio mondiale - Imports- 2007 2009

21
Sviluppo commercio estero UE (2000-2009): si può fare un grafico più esplicativo??
: si può fare un grafico più esplicativo")
22
Principali partner per lexport 2007 2009

23
Principali partner per limport

24
Il grande sconvolgimento degli ultimi 10 anni (2000-2009)
")
25
Trade balance 2000-2009

26
Trade by sectors (export-import 2009) Relevance of intra-branca trade
 Relevance of intra-branca trade")
30
Intra EU trade

31
worldwide Official Development Assistance (ODA). The EU provides more than half (54 % in 2003) of worldwide official development assistance (ODA). One fifth of the combined EU aid is managed by the European Commission. On average, the Member States of the EU-25 devoted 0.34 % of their GNI to ODA in 2003, compared with 0.15 % for the US and 0.20 % for Japan. Denmark, Luxembourg, the Netherlands and Sweden made the largest effort in terms of development aid, with around 0.8 % of their GNI devoted to ODA.
 of worldwide official development assistance (ODA). One fifth of the combined EU aid is managed by the European Commission. On average, the Member States of the EU-25 devoted 0.34 % of their GNI to ODA in 2003, compared with 0.15 % for the US and 0.20 % for Japan. Denmark, Luxembourg, the Netherlands and Sweden made the largest effort in terms of development aid, with around 0.8 % of their GNI devoted to ODA..")
32
Azioni esterne e strategie di pre adesione

41
LEuropa nelleconomia mondiale Bibliografia essenziale Valli V. Guena A., Burlando R. La politica economica e macroeconomia: Una nuova prospettiva, Carocci ed.(2010), (parte terza, capp. 15-18)
, (parte terza, capp ).")
42
Bibliografia generale sullo sviluppo economico mondiale –Bairoch P. Storia economica e sociale del Mondo, Einaudi,1999 –Maddison A. The World economy, a millennial perspective, OECD; Paris 2001 – Landes D. La ricchezza e la povertà delle nazioni: perchè alcune sono così ricche ed altre così povere, Garzanti ed. 2002 –FAO 2006, World Agriculture towards 2030-2050, Interim report, Roma –World Bank, World development report, Oxford University Press (varie annate) –OECD, Economic Outlook, Paris (varie annate) –OECD-FAO (2010), Agricultural outlook 2010-2019: highligth, Fao-Oecd. –IMF: World Economic Outlook, July 8, 2010; World Economic Outlook, october 2012. –World Bank, World Economic Indicators (Varie annate) –Ciocca P. Leconomia mondiale nel Novecento: Una sintesi, un dibattito, il Mulino, Bologna 1998. (Sintesi di Ciocca a pp.11-53) –Ciocca P. (2005) Ricchi per sempre? Una storia economica dellItalia 1796- 2005, Bollati Boringhieri ed
 –OECD, Economic Outlook, Paris (varie annate) –OECD-FAO (2010), Agricultural outlook : highligth, Fao-Oecd. –IMF: World Economic Outlook, July 8, 2010; World Economic Outlook, october –World Bank, World Economic Indicators (Varie annate) –Ciocca P. Leconomia mondiale nel Novecento: Una sintesi, un dibattito, il Mulino, Bologna (Sintesi di Ciocca a pp.11-53) –Ciocca P. (2005) Ricchi per sempre. Una storia economica dellItalia , Bollati Boringhieri ed.")
43
World Bank, World Development Report 2008: Agriculture for Development, World Bank Washington DC World Bank, World Development Report 2009: Reshaping economic geography, World Bank Washington DC World Bank, World Development Report 2010: Development and Climate Change, World Bank Washington DC The Economist, A special report on the world economy, How to grow. Oct 7th 2010 Sito World Bank (www.worldbank.org)www.worldbank.org Sito FAO (www.fao.org)www.fao.org Sito OECD (www.oecd.org)www.oecd.org Sito WTO (www.wto.org)www.wto.org

44
Bairoch P. La mondialisation: perspectives historiques, in Economie appliquée, n.2, 2002 Il ny a rien de neuf sous le soleil –Una prima fase della mondializzazione si è verificata nella seconda metà del secolo XIX e si è interrotta con la prima guerra mondiale. –Nel secondo dopoguerra si è verificata una nuova fase di mondializzazione –Il termine mondializzazione è entrato solo recentemente nei dizionari economici –1996 –Bialès c. et al., Dictionnaire dèconomie e de faits économiques et sociaux contemporains, Paris –1996 – McMillam, Dictionary of Modern Economics, New York –Fernand Braudel in La dynamique du capitalismenel 1985 aveva usato il termine economie-monde Globalizazione, Mondializzazione (Globalization, Mondialisation)
.")
45
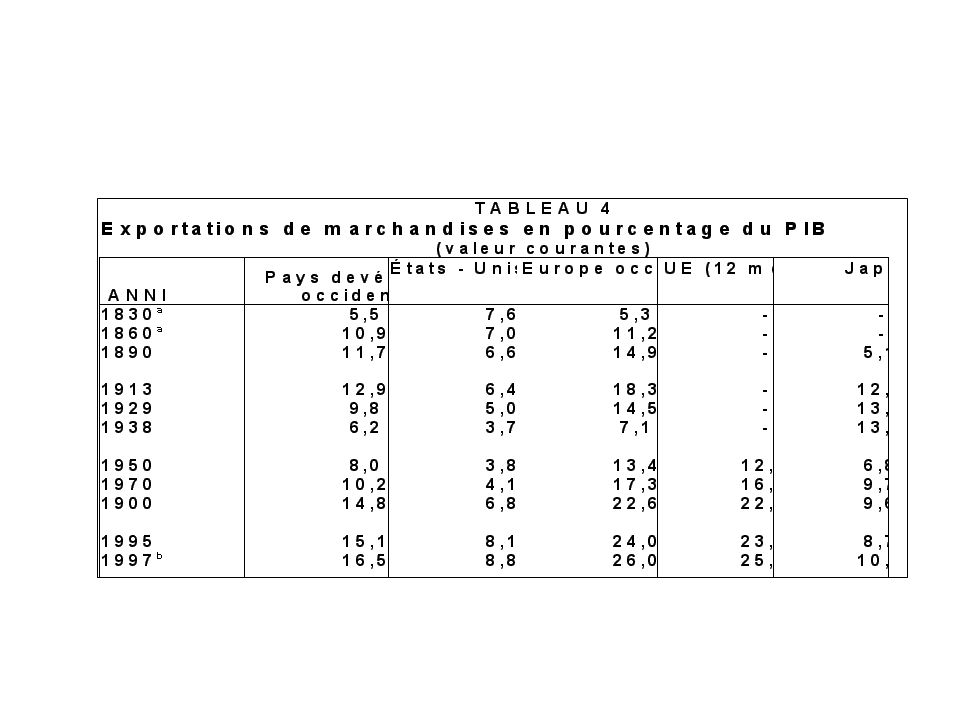
Bairoch P. La mondialisation: perspectives historiques, in Economie appliquée, n.2, 2002 La mondialisation économique dopo il 1950 –IL commercio estero: (nei paesi sviluppati occidentali) Crescita rapida del commercio (esportazioni di beni) dopo il 1968 ed in particolare dopo il 1973 (dal 10,2% del PIL nel 1970 al 14,6 % nel 1976) Dopo il 1975 la crescita del commercio estero è stata più moderata (16,5% del PIL nel 1997) –Gli investimenti diretti allestero Crescita rapida degli investimenti a partire dal 1985 e soprattutto dopo il 1990 (dal 7,5% del Pil nel 1985, al 9,5% nel 1990, al 13,0% nel 1997) –La modializzazione in termini relativi è stata più avanzata nel periodo 1860- 1913 rispetto alla metà degli anni novanta. –Il processo di mondializzazione dopo il 1993 è ancora in fase crescente e non si può prevedere se continuerà a saggi ancora crescenti. La storia mostra che spesso è pericoloso procedere a delle semplici estrapolazioni
 Crescita rapida del commercio (esportazioni di beni) dopo il 1968 ed in particolare dopo il 1973 (dal 10,2% del PIL nel 1970 al 14,6 % nel 1976) Dopo il 1975 la crescita del commercio estero è stata più moderata (16,5% del PIL nel 1997) –Gli investimenti diretti allestero Crescita rapida degli investimenti a partire dal 1985 e soprattutto dopo il 1990 (dal 7,5% del Pil nel 1985, al 9,5% nel 1990, al 13,0% nel 1997) –La modializzazione in termini relativi è stata più avanzata nel periodo rispetto alla metà degli anni novanta. –Il processo di mondializzazione dopo il 1993 è ancora in fase crescente e non si può prevedere se continuerà a saggi ancora crescenti. La storia mostra che spesso è pericoloso procedere a delle semplici estrapolazioni.")
46
Globalizazione, Mondializzazione (Globalization, Mondialisation)
")
48
TABLEAU 7.- Stock des investissements directs à l'éntrager en % du PIB (valeurs courantes) Pays devéloppés occidentaux États - UnisEurope occidentaleJapon 191314,0-19,0 5,0-7,0 20,0-22,01,0-3,0 193813,0-15,0 8,0-9,0 14,0-17,00,5-2,0 19606,9 6,2 10,41,1 19716,4 7,5 6,91,9 19806,3 8,1 6,41,9 19857,5 6,2 10,33,3 19909,5 7,7 12,16,9 1996 a 12,9 10,8 17,67,2 a Chiffres préliminaires P. Bairoch, 2002.

49
FMI: World Economic Outlook, 22 April 2009 Per aggiornamenti EU-Resto del mondo

52
Per aggiornamenti:

53
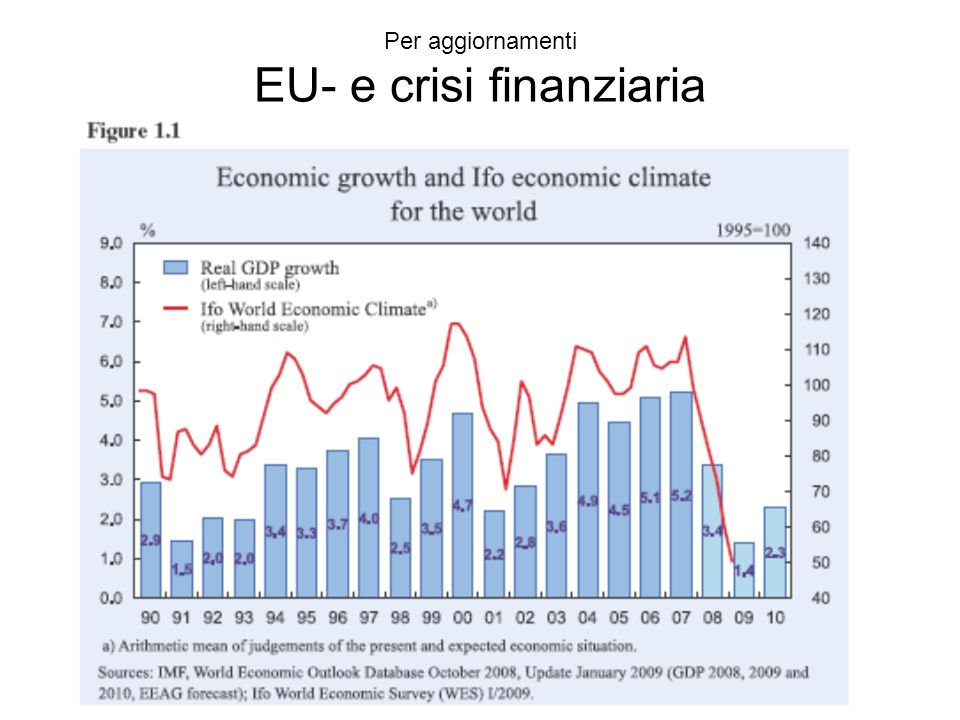
Per aggiornamenti EU- e crisi finanziaria

55
EU- e crisi finanziaria: % saggi sviluppo mondiali e prezzo del petolio (1975-2009)
")
56
EU- e crisi finanziaria

57
Per aggiornamenti EU- e crisi finanziaria

59
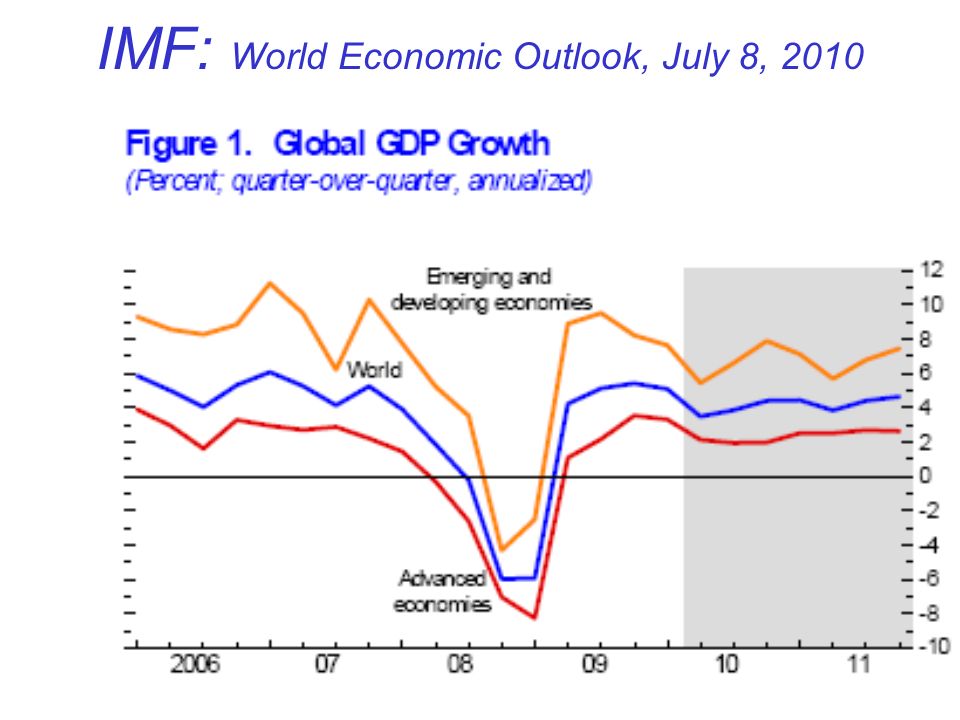
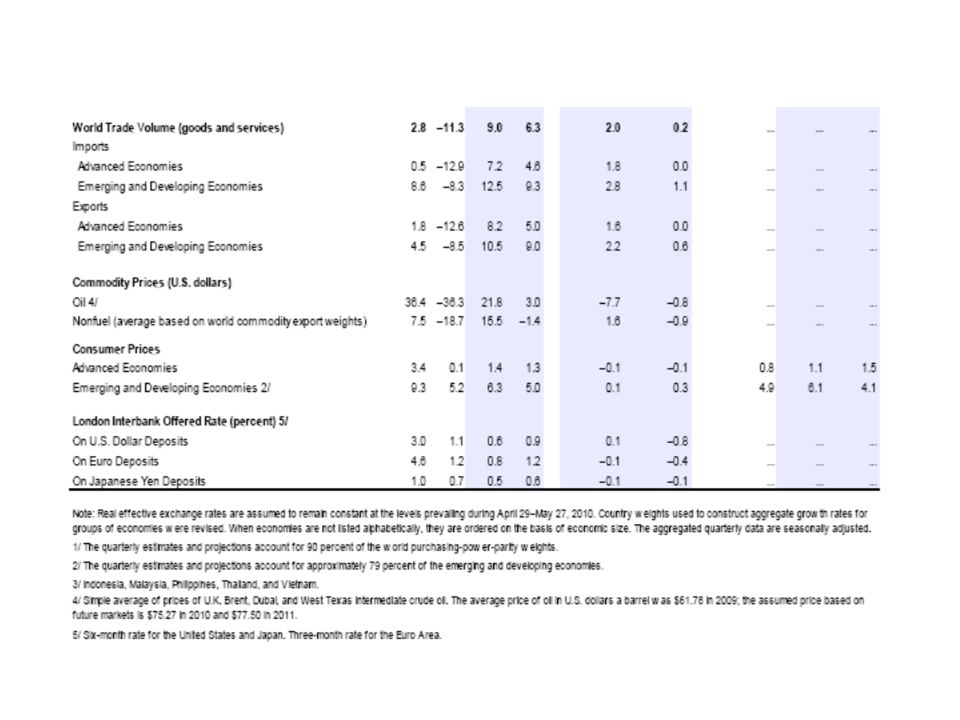
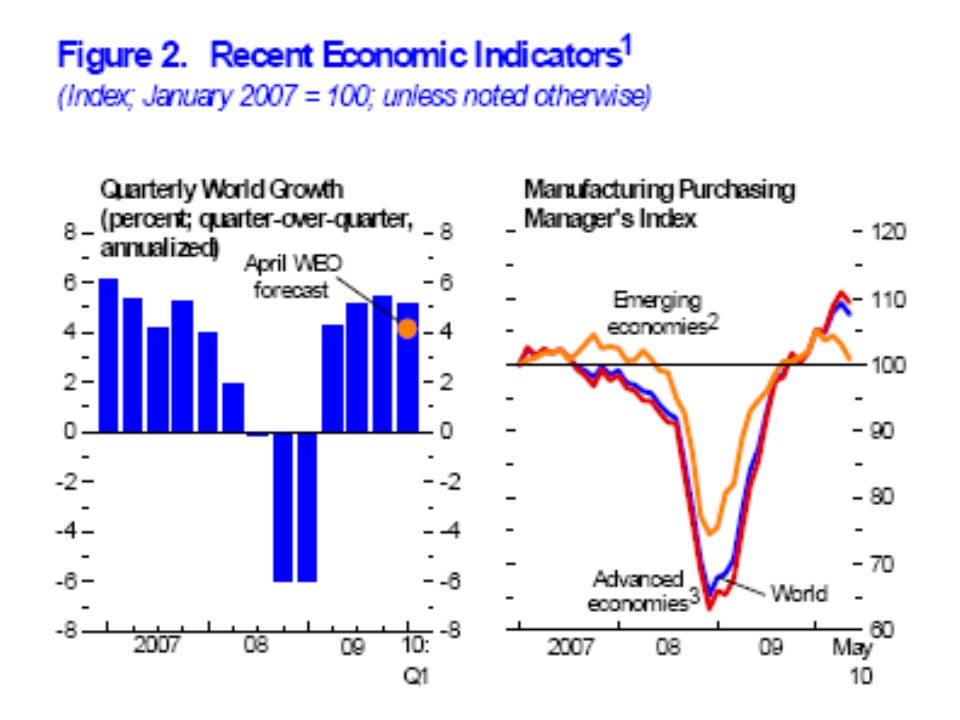
Restoring Confidence without Harming Recovery. IMF: World Economic Outlook, July 8, 2010

60
Restoring Confidence without Harming Recovery World growth is projected at about 4½ percent in 2010 and 4¼ percent in 2011. Relative to the April 2010 World Economic Outlook (WEO), this represents an upward revision of about ½ percentage point in 2010, reflecting stronger activity during the first half of the year. The forecast for 2011 is unchanged (Table 1; Figure 1). At the same time, downside risks have risen sharply amid renewed financial turbulence. In this context, the new forecasts hinge on implementation of policies to rebuild confidence and stability, particularly in the euro area. More generally, policy efforts in advanced economies should focus on credible fiscal consolidation, notably measures that enhance medium-run growth prospects, such as reforms to entitlement and tax systems. Supported by accommodative monetary conditions, fiscal actions should be complemented by financial sector reform and structural reforms to enhance growth and competitiveness. Policies in emerging economies should also help rebalance global demand, including through structural reforms and, in some cases, greater exchange rate flexibility. IMF: World Economic Outlook, July 8, 2010
, this represents an upward revision of about ½ percentage point in 2010, reflecting stronger activity during the first half of the year. The forecast for 2011 is unchanged (Table 1; Figure 1). At the same time, downside risks have risen sharply amid renewed financial turbulence. In this context, the new forecasts hinge on implementation of policies to rebuild confidence and stability, particularly in the euro area. More generally, policy efforts in advanced economies should focus on credible fiscal consolidation, notably measures that enhance medium-run growth prospects, such as reforms to entitlement and tax systems. Supported by accommodative monetary conditions, fiscal actions should be complemented by financial sector reform and structural reforms to enhance growth and competitiveness. Policies in emerging economies should also help rebalance global demand, including through structural reforms and, in some cases, greater exchange rate flexibility. IMF: World Economic Outlook, July 8,")
67
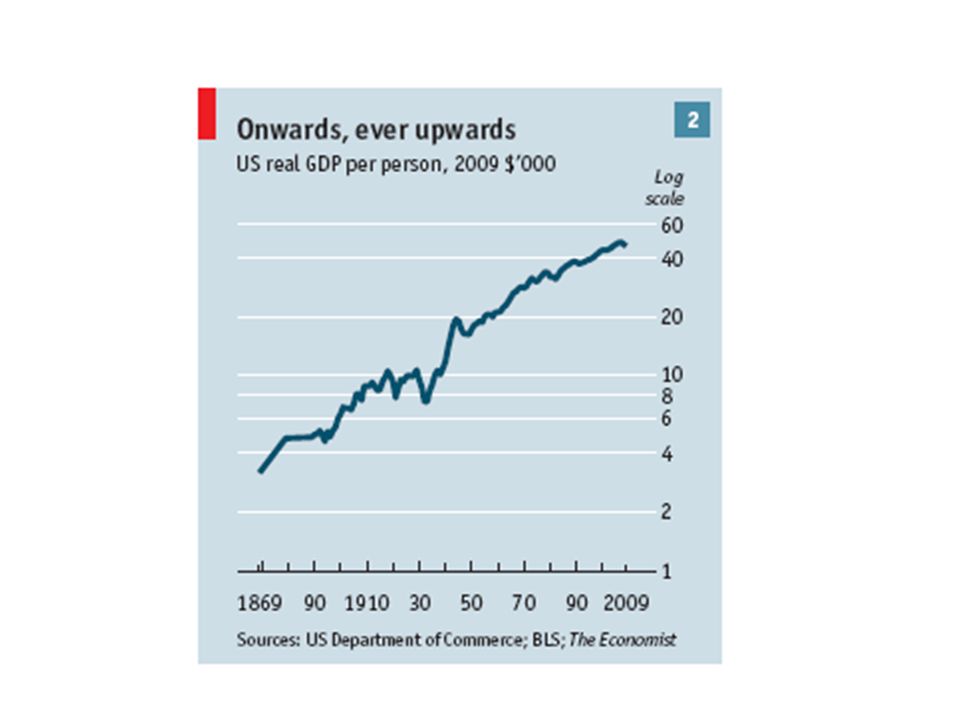
The Economist : How to grow, A special report on the world economy, October 9th 2010

75
The Economist- How to Grow Una relazione speciale sulleconomia mondiale The Economist, A special report on the world economy, How to grow. Oct 7th 2010

76
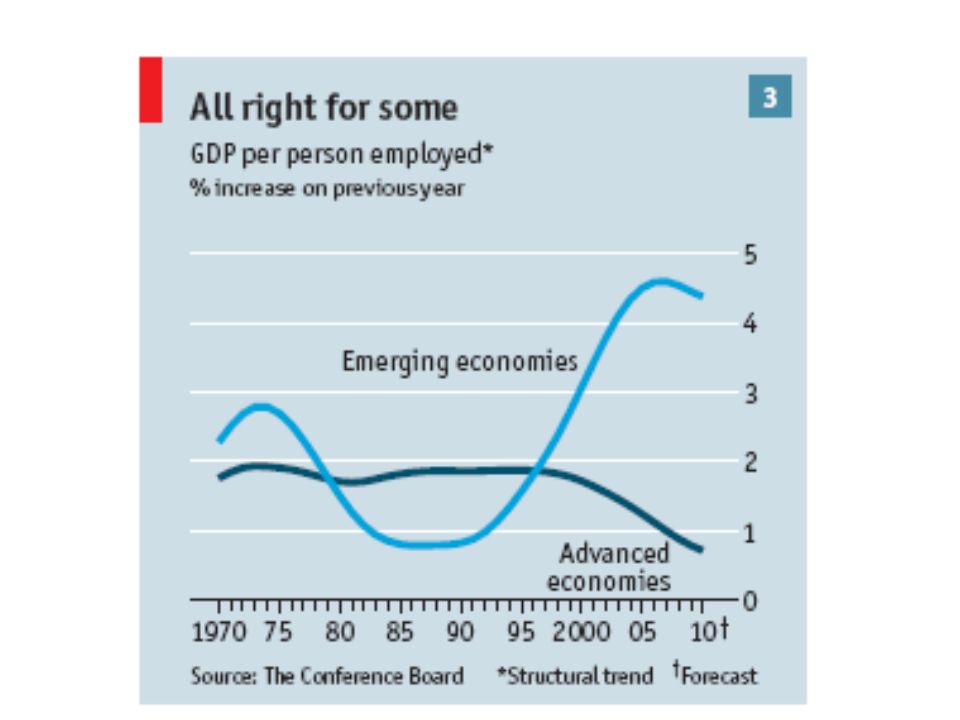
I Cambiamenti 10 anni fa, i paesi ricchi producevano i 2/3 del Pil globale. Oggi apportano solo 50%. Ed è previsto un calo al 40% nei prossimi 10 anni. Tra 1998 e 2008, l'85% dei paesi emergenti sono cresciuti più velocemente rispetto agli Stati Uniti.

77
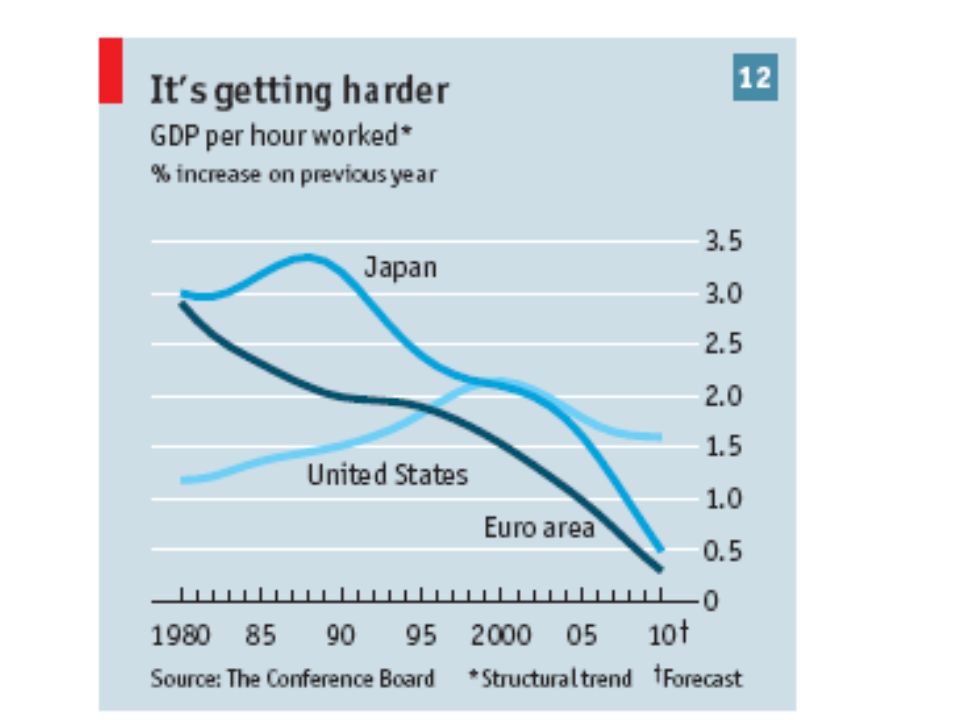
PIL pro capite: andamento % rispetto anno precedente. Confronto fra economie avanzate ed economie emergenti.

78
I Problemi della grande recessione mondiale del 2008/09. 1)Lofferta sta rallentando. Vi è un aumento nel numero dei disoccupati, dei pensionati ed un calo della produttività e della popolazione in età lavorativa. 2)Questi fattori nuociono alla capacità di ripresa delle economie e gravano sul debito pubblico.
Lofferta sta rallentando. Vi è un aumento nel numero dei disoccupati, dei pensionati ed un calo della produttività e della popolazione in età lavorativa. 2)Questi fattori nuociono alla capacità di ripresa delle economie e gravano sul debito pubblico..")
79
Il mercato del lavoro

80
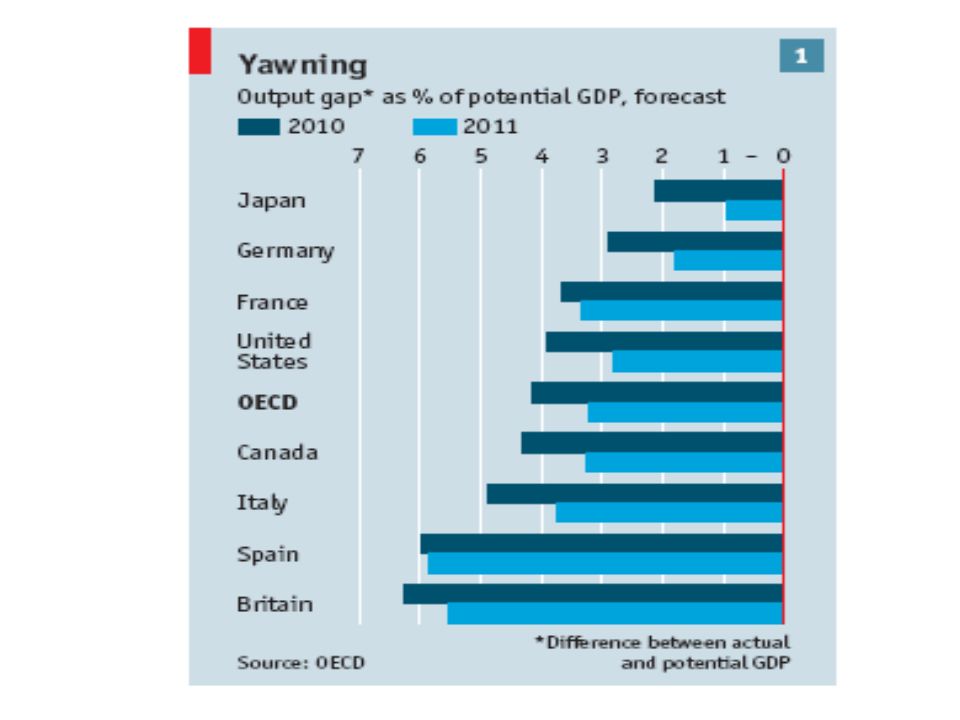
Differenza tra crescita effettiva e crescita potenziale Problema dell'accesso al credito: le banche danno meno finanziamenti alle imprese inibendo lo sviluppo.

81
La Crescita Dal 1998-2008, la crescita nel Pil dei paesi G7 era in media del 2,5% all'anno. Oggi, il tasso di crescita potenziale per i prossimi 10 anni è stimato esssere solo dell'1,7%. Conseguenze: bassi investimenti, aumento disoccupazione e crescita debito. Quindi ulteriore diminuzione della capacità di crescita nel breve e lungo periodo. Rischio Lost Decade.

82
Strategie per uscire dalla crisi: Dubbi sulle le riforme Paesi ricchi fanno troppo affidamento sulla domanda estera come fonte di crescita. Cattiva gestione tramite politica fiscale austera che blocca i consumi interni. C è poca attenzione verso le riforme strutturali volte alla riduzione del debito, a stimolare la crescita ed a evitare di rendere l'alto tasso disoccupazione strutturale.

83
Le Soluzioni Riduzione del debito pubblico. Migliore allocazione del credito e stimolare investimenti. Serve una riorganizzazione piu ampia delle economie per rilanciare la produttività. Più formazione, più aiuto per i disoccupati in modo che possano trovare un lavoro. Più flessibilità nel mercato di lavoro.

84
Le Soluzioni I governi dovrebbero prendere le distanze dallingerenza negli affari delle aziende Stimolare e favorire ricerca e sviluppo La crescita di produttività più veloce per neutralizzare i problemi demografici

85
In Conclusione Il prossimo decennio per i paesi ricchi/avanzati sarà un periodo difficile. I paesi dovrebbero mettere in pratica le soluzioni proposte. I paesi ricchi hanno bisogno di una riorganizzazione piu ampia delle loro economie; oltre alla riduzione del debito pubblico ci sono altre priorità.

86
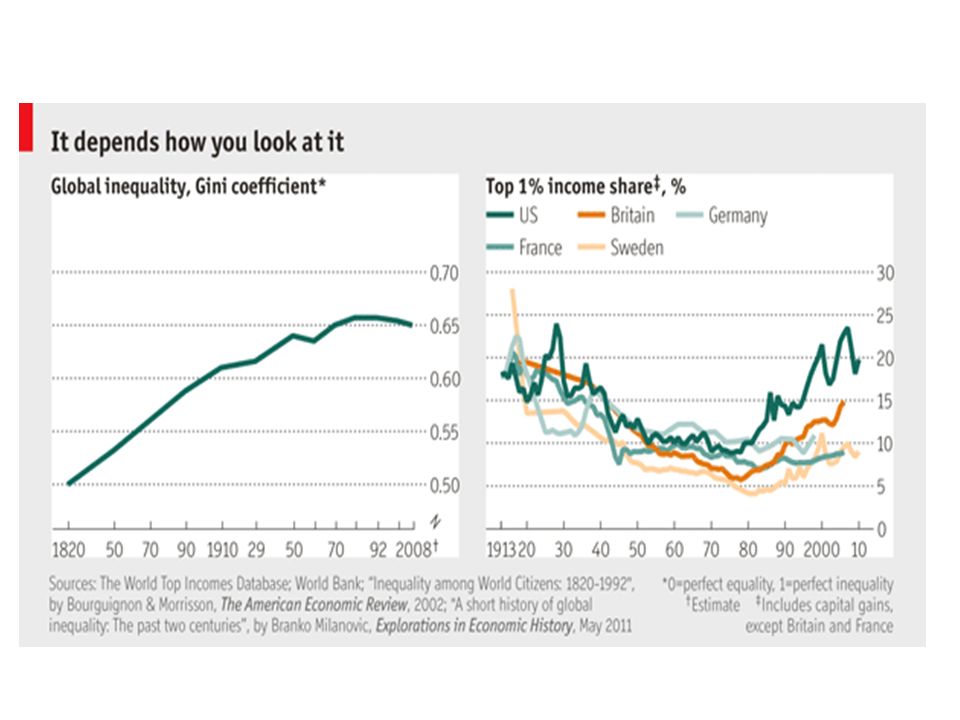
Special report: The world economy the Economist 13 oct 2012The world economy For richer, for poorer Growing inequality is one of the biggest social, economic and political challenges of our time. But it is not inevitable, says Zanny Minton Beddoes

Presentazioni simili


 Brussels, 26 settembre 2013.>")


>")
