Scaricare la presentazione
La presentazione è in caricamento. Aspetta per favore

1
Relazioni Sole-Terra…
… verso una meteorologia spaziale Maurizio Candidi Istituto di Fisica dello Spazio Interplanetario – IFSI Istituto Nazionale di AstroFisica - INAF

2
TELECOMUNICAZIONI COMMERCIALI
Joe Allen: This collage of newspaper articles about the failure of Galaxy-4 in May 1998, was assembled by Dan Baker and Joe Allen. The disturbed space environment at the time of the outage was described by Baker, Allen, Kanekal, and Reeves in the paper “Disturbed Space Environment May Have Been Related to Pager Satellite Failure”, EOS, Transactions of the American Geophysical Union, Vol 79, No 40, 6 October 1998. This event and the high solar activity with consequences at Earth and in geospace were the subject of papers given at sessions of the ISCS Workshop and in the COSPAR General Assembly in summer 1998 in Nagoya, Japan. Also, they were extensively discussed at the meeting in Taipei, ROC, of sessions of the Western Pacific Regional AGU meeting after COSPAR. The S-RAMP Steering Committee decided to make the period April-May 1998 a “Special Study Interval” and to invite concerted analysis of phenomena recorded at that time. This period will be a topic of presentations at the “First S-RAMP Conference” in Sapporo, Japan during the first week of October Please see the S-RAMP website (managed by Marissa Jarvis) and Dan Baker’s Tutorial slides/videos for presentation there. TELECOMUNICAZIONI COMMERCIALI MA ANCHE RETI PER BANCOMAT E CARTE DI CREDITO
 and Dan Baker’s Tutorial slides/videos for presentation there. TELECOMUNICAZIONI COMMERCIALI. MA ANCHE RETI PER BANCOMAT E CARTE DI CREDITO.")
3
QUEL MATCH NASCOSTO TRA TERRA E SOLE
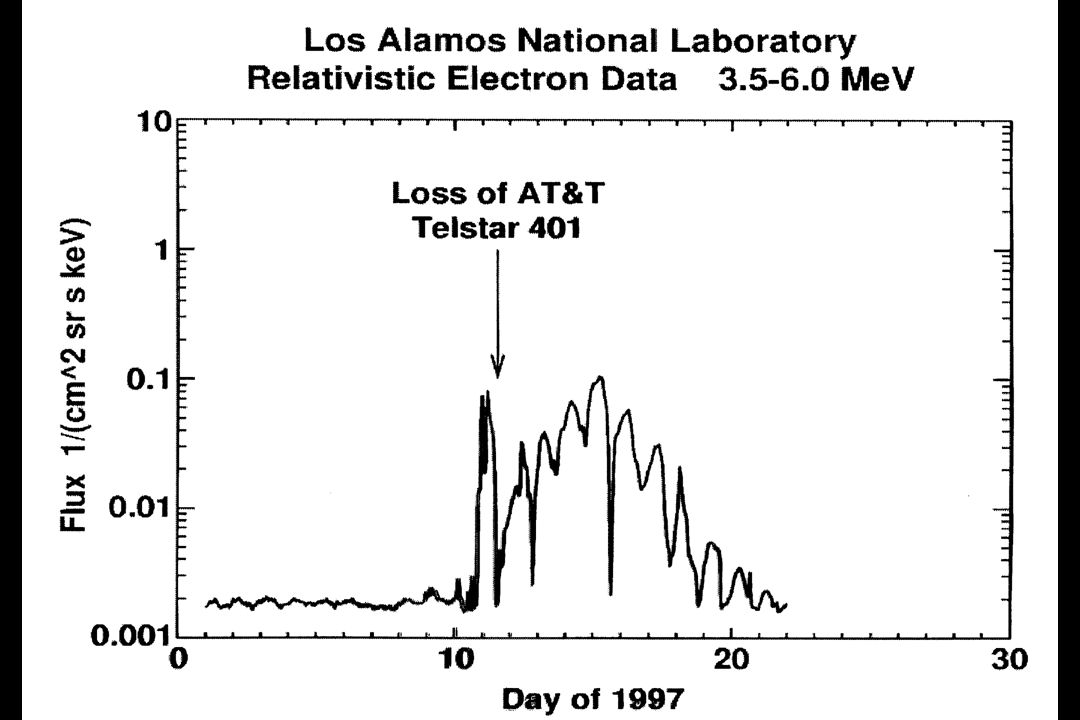
NEW YORK Dimenticate i libri di fantascienza: questa e la cronaca vera del match di pugilato interspaziale tra il Sole e la Terra seguito in diretta, e con qualche brivido, dagli astrofisici della NASA. Gong iniziale: 10 gennaio. Alle 17 il satellite Soho, con cui NASA e Agenzia Spaziale Europea studiano la meteorologia dello spazio, registra una immensa eruzione di particelle dalla corona solare. "Fratello Sole si è svegliato" commentano scherzosamente (e in segreto) gli scienziati dei due continenti, senza rendersi conto della portata dell'esplosione. Invece, una nube magnetica spessa 50 milioni di chilometri comincia da quell'istante a percorrere i 150 milioni di chilometri che separano la stella dal suo pianeta. La Terra viene colpita due volte. "Il classico uno-due della boxe", spiega la NASA nella conferenza stampa al termine della "partita". All'alba del 10 gennaio la tempesta magnetica si infrange sul polo sud a un milione di migliaia all'ora, mettendo in tilt tutti i sistemi di comunicazione e proseguendo per lo spazio interplanetario. Inaspettato e particolarmente violento, il secondo pugno solare arriva l'11 gennaio. Una massa di "elettroni killer" dalla potenza distruttiva maggiore dei raggi X si abbatte sulla Terra, come hanno potuto constatare trenta stazioni di controllo e venti satelliti. Uno di essi, il Telstar 401, nuovo di zecca, mandato in orbita appena tre anni fà dall'At&t e costato 300 miliardi di lire, si azzittisce improvvisamente, lasciando mezza America senza programmi TV. Non si sveglia più, l'At&t ora lo considera "morto". Per fortuna la stazione russa Mir e in orbita troppo bassa per subire gli effetti del pugno magnetico solare. Ma ciò non toglie che la povera Terra, come era prevedibile, perda ai punti il match di boxe.
 gli scienziati dei due continenti, senza rendersi conto della portata dell esplosione. Invece, una nube magnetica spessa 50 milioni di chilometri comincia da quell istante a percorrere i 150 milioni di chilometri che separano la stella dal suo pianeta. La Terra viene colpita due volte. Il classico uno-due della boxe , spiega la NASA nella conferenza stampa al termine della partita . All alba del 10 gennaio la tempesta magnetica si infrange sul polo sud a un milione di migliaia all ora, mettendo in tilt tutti i sistemi di comunicazione e proseguendo per lo spazio interplanetario. Inaspettato e particolarmente violento, il secondo pugno solare arriva l 11 gennaio. Una massa di elettroni killer dalla potenza distruttiva maggiore dei raggi X si abbatte sulla Terra, come hanno potuto constatare trenta stazioni di controllo e venti satelliti. Uno di essi, il Telstar 401, nuovo di zecca, mandato in orbita appena tre anni fà dall At&t e costato 300 miliardi di lire, si azzittisce improvvisamente, lasciando mezza America senza programmi TV. Non si sveglia più, l At&t ora lo considera morto . Per fortuna la stazione russa Mir e in orbita troppo bassa per subire gli effetti del pugno magnetico solare. Ma ciò non toglie che la povera Terra, come era prevedibile, perda ai punti il match di boxe.")
4
Joe Allen: According to Herb Sauer, a PhD candidate at the University of Iowa at this time, he was the first one to look at the record of returned Geiger counter values from Explorer-2. He saw the regular pattern of off-scale periods and commented that they had to be a result of system saturation when the satellite was in critical high counting regions, not a loss of signal due to bad transmissions. Later others looked at the records and agreed. Over the auroral zone and South Atlantic Anomaly, the sensor was exposed to so much radiation it saturated. This scene was a recreation involving the top persons from the department who worked on this experiment. From the left end of the table, going clockwise, they are: Carl McIlwane, James Van Allen, George Ludwig, and Ernest Ray. They posed for a commissioned painting of the scene. This image is from a photograph of the painting. The painting was given to Mrs. Mary Ray by NSF.

5
LA METEOROLOGIA SPAZIALE
Stage Tor Vergata, Roma, 11 Marzo 2009 LA METEOROLOGIA SPAZIALE Argomento della presentazione Origine del fenomeno sul Sole Caratteristiche del vento solare Interazione con il campo magnetico terrestre Magnetosfera Effetti nello spazio e a terra

6
LA CORONA SOLARE La corona solare ha una luminosità molto ridotta e generalmente non è visibile a causa della luminosità del disco; appare alla vista durante le eclissi totali di Sole, come quella qui mostrata. Questi eventi sporadici sono stati usati per studi sulla corona solare, fino a quando non c’è stata la possibilità di osservare con continuità la corona durante eclissi artificiali, mediante coronografi su veicoli spaziali come SOHO, il SOlar and Heliospheric Observatory dell’ESA. Eclisse del

7
Eclipse and LASCO-C2 coronagraph images
Questa immagine risulta dalla composizione di osservazioni dello strumento LASCO di SOHO e di una eclisse. Mostra chiaramente che la corona è organizzata dal campo magnetico solare, con grande complessità alla base, dove i campi sono molto intensi, e con struttura via via più semplice man mano che ci si allontana dalla superficie, con una diminuzione dell’intensità del campo magnetico e una predominanza del moto del plasma, della sua energia cinetica. Eclipse and LASCO-C2 coronagraph images processed and merged by Serge Koutchmy

8
An optical telescope as a Cosmic Ray detector!
The huge solar mass ejection on July 14, 2000, observed by LASCO-C3. The “snow shower” is due to particles, accelerated to extremely high speeds during the ejection. They penetrate the instrument walls and let the CCD scintillate.

9
There is an endless discussion about the relation between CMEs and flares.
A solar flare, as observed by TRACE

10
CMEs are, at times, spectacular events!
La caratteristica di maggior rilievo per lo “space weather” è la CME (Coronal Mass Ejection”. E’ una emissione di massa da una regione specifica di plasma denso che emerge con velocità superiore a quella normale, e trasporta strutture di campo magnetico. A unique observation by LASCO-C2. Note the helical structure of the prominence filaments!

11
La corona solare è un plasma
Un plasma è un gas che ha una temperatura tale, alla densità alla quale si trova, da essere fortemente ionizzato E’ quindi una miscela di elettroni e ioni positivi L’universo è, in proporzione estrema, composto da materia allo stato di plasma, c’è chi dice al 99,99%. Nei corpi freddi come la Terra e gli altri pianeti questo non è vero, anche se vi sono zone nell’alta atmosfera terrestre, come la ionosfera, che è costituita da plasma di densità dell’ordine del 1% della densità dei neutri. Quindi la ionosfera è un plasma debolmente ionizzato La corona solare, e il vento solare che origina da essa, sono invece completamente ionizzati. Le particelle cariche sentono la forza di Lorentz, e quindi il comportamento del plasma è fortemente influenzato dai campi magnetici. Campi magnetici intensi determinano il moto del plasma; campi deboli sono invece influenzati dal plasma. I due sono comunque fortemente legati l’uno all’altro.

12
Le equazioni che governano lo “space weather”: MHD (MagnetoHydroDynamics)
Le equazioni di Maxwell L’equazione del moto del plasma L’equazione di induzione

13
Effetti MHD Plasma e campo magnetico sono strettamente legati dalla forza di Lorentz e si comportano in modo correlato ed autoconsistente Il campo magnetico è congelato nel plasma se la densità di energia del plasma è maggiore di quella del campo (corona e vento solare) Il plasma viaggia lungo le linee di forza del campo magnetico, quando la densità di energia del plasma è minore di quella del campo magnetico (Superficie del Sole e magnetosfera) E’ importante il fenomeno della riconnessione del campo magnetico in vari posti nel sistema Sole-Terra (Flares, Magnetopausa, Coda geomagnetica)
 Il plasma viaggia lungo le linee di forza del campo magnetico, quando la densità di energia del plasma è minore di quella del campo magnetico (Superficie del Sole e magnetosfera) E’ importante il fenomeno della riconnessione del campo magnetico in vari posti nel sistema Sole-Terra (Flares, Magnetopausa, Coda geomagnetica)")
14
MODELLO DI BRILLAMENTO SOLARE:
Campo magnetico emergente da macchie, plasma solare che si muove lungo le linee di forza, evoluzione del campo magnetico sotto l’effetto della pressione del plasma. Due caratteristiche notevoli: Riconnessione: responsabile del riscaldamento del plasma Campi magnetici elicoidali: che compariranno più avanti in relazione alle polarità del campo magnetico interplanetario

15
Speed profiles of the slow solar wind,
Parker, 1963 Helios at 60 Rs 60 Speed profiles of the slow solar wind, as determined from „leaves in the wind“ Sheeley et al., 1997 Note: coherent outward flow starts only at about 3 Rs, .The profile is consistent with in-situ speed profiles obtained between 60 and 210 Rs.

16
The solar activity cycle
The magnetic flux at the solar surface varies quasi-periodically in the 11-year solar cycle. Minimum X-rays Magnetic flux The short-wave radiation varies strongly through the activity cycle: from a factor 2 in the UV (<100 nm) up to a factor 100 in X-rays.
 up to a factor 100 in X-rays.")
17
Joe Allen: This is a figure that has grown in utility over the last 3 solar cycles since it was prepared from hand-tabulated values (IAGA Bulletin 22). Yellow trace is annual values of the smoothed sunspot number from (we won’t know the value for 2000 for 9 months). Red are number of days per year for with Ap daily average magnetic activity index 40 or greater. Magnetic storms are distributed differently than sunspot numbers. Peaks in storm numbers may happen on the rising side of the sunspot cycle, at maximum, or (always) on the declining side of the cycle. Some magnetic storm groups during a sunspot cycle are bimodal, some trimodal, and one is essentially unimodal after an early plateau. Computing the Ap* indices from the 3-hourly ap values gives fewer events per year (not shown) because some storms last more than one day. However, the Ap* values are greater than any Ap in a given storm about 7/8ths of the time. Separation of geomagnetic storms at thresholds of 40, 60, 80, and 100 reveals that the larger storms follow the same time distribution as the smaller ones. However, the storms having 40<=Ap*<=60 are mainly the multi-day recurrent magnetic storms of the declining side of the solar cycle. Tabulation of the number of satellite anomalies per year shows that they follow the magnetic storm cycle both from year to year and seasonally within each year. This is not particularly true for the TDRS-1 satellite as explained on that slide. Joule heating of the upper atmosphere by the currents that produce the magnetic storm variations causes increased satellite drag, which is not considered an “anomaly”, but which may vary along with the anomaly counts for some satellites.
. Yellow trace is annual values of the smoothed sunspot number from (we won’t know the value for 2000 for 9 months). Red are number of days per year for with Ap daily average magnetic activity index 40 or greater. Magnetic storms are distributed differently than sunspot numbers. Peaks in storm numbers may happen on the rising side of the sunspot cycle, at maximum, or (always) on the declining side of the cycle. Some magnetic storm groups during a sunspot cycle are bimodal, some trimodal, and one is essentially unimodal after an early plateau. Computing the Ap* indices from the 3-hourly ap values gives fewer events per year (not shown) because some storms last more than one day. However, the Ap* values are greater than any Ap in a given storm about 7/8ths of the time. Separation of geomagnetic storms at thresholds of 40, 60, 80, and 100 reveals that the larger storms follow the same time distribution as the smaller ones. However, the storms having 40<=Ap*<=60 are mainly the multi-day recurrent magnetic storms of the declining side of the solar cycle. Tabulation of the number of satellite anomalies per year shows that they follow the magnetic storm cycle both from year to year and seasonally within each year. This is not particularly true for the TDRS-1 satellite as explained on that slide. Joule heating of the upper atmosphere by the currents that produce the magnetic storm variations causes increased satellite drag, which is not considered an anomaly , but which may vary along with the anomaly counts for some satellites.")
18
La Terra è immersa nell’atmosfera estesa del Sole, protetta dal suo campo magnetico e dalla sua atmosfera. Dal Sole emergono onde elettromagnetiche e flussi di particelle cariche (vento solare); queste ultime investono la Terra con il suo campo magnetico e generano complessi fenomeni che possono rappresentare un pericolo per i sistemi tecnologici e per la vita umana.
; queste ultime investono la Terra con il suo campo magnetico e generano complessi fenomeni che possono rappresentare un pericolo per i sistemi tecnologici e per la vita umana.")
19
Perturbazione magnetica che si propaga dal Sole;
dov’è la Terra? Seguiamo lo zoom. La Terra rappresenta un ostacolo minuscolo nel flusso del vento solare, come un piccolo sasso nella piena del fiume.

22
La riconnessione magnetica è favorita quando la polarità dei campi che si incontrano è opposta. Il campo magnetico terrestre, alla separazione con lo IMF, presenta polarità positiva, con una componente verticale diretta verso Nord. Quando quindi si presenta un IMF con una componente verticale negativa, verso Sud, si hanno le migliori condizioni per la riconnessione fra IMF e campo terrestre. Si formano in particolare due punti neutri. Come detto, lo IMF è modulato con strutture a “flux rope”, nelle quali campi positivi sono seguiti da campi negativi, o viceversa. IMF

23
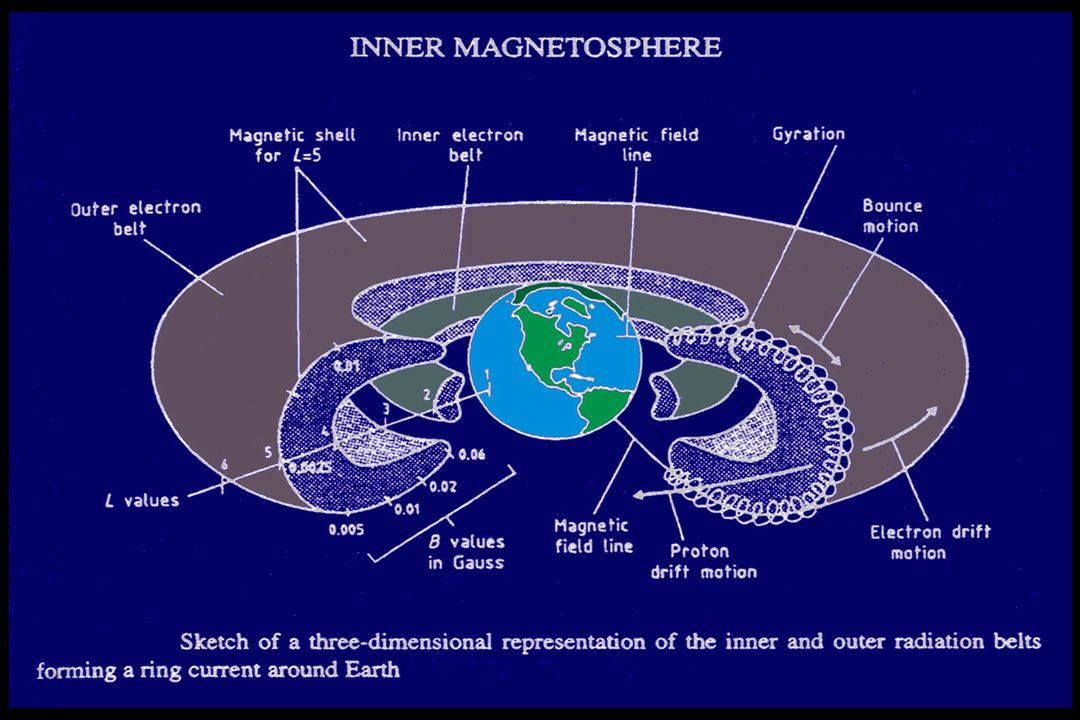
LA MAGNETOSFERA TERRESTRE
Il flusso del plasma del vento solare incontra l’ostacolo del campo magnetico terrestre, intenso rispetto alla densità di energia del vento solare, e gli gira attorno formando una cavità, la “magnetosfera”, dalla quale è escluso, in linea di principio. All’interno della magnetosfera il plasma interno segue moti di convezione dominati dalla struttura del campo elettrico e magnetico terrestre. Si formano correnti elettriche di varia natura, alla magnetopausa, ad anello nelle fasce di radiazione, allineate al campo nelle regioni polari e lungo l’ovale aurorale nella ionosfera polare, attraverso la coda.

24
Istituto di Fisica dello Spazio Interplanetario – CNR
-E•J 0 JB JB Vediamo ora quali sono le conseguenze su grande scala di questo modello. IMF e campo geom. si riconnettono al punto subsolare la curvatura del campo magnetico in questo punto è tale da accelerare il plasma convertendo energia magnetica in energia cinetica. Poiche al di fuori della regione di diffusione vale la MHD plasma e campo si muovono insieme la linea appena riconnessa tende a distendersi mentre è trascinata dal vento solare in direzione della coda geomagnetica. Si ha anche che in condizioni stazionarie le linee di campo sono equipotenziali e il campo E=UxB verrà trasferito anch alla polar cap dove darà origine a un moto in direzione antisolare del plasma ionosferico. I tubi di flusso si accumulerranno dunque nella coda geomagnetica dove un altro processo di riconnessione darà origin ad una linea di campo molto tirata che tenderà a tornare verso Terra chiudendo il ciclo. Istituto di Fisica dello Spazio Interplanetario – CNR

27
J. Burch

28
Bartels’ musical diagrams of the geomagnetic index kp. ..
Note the regular “M-regions”. They are due to high speed streams, i.e. products of the inactive sun.

33
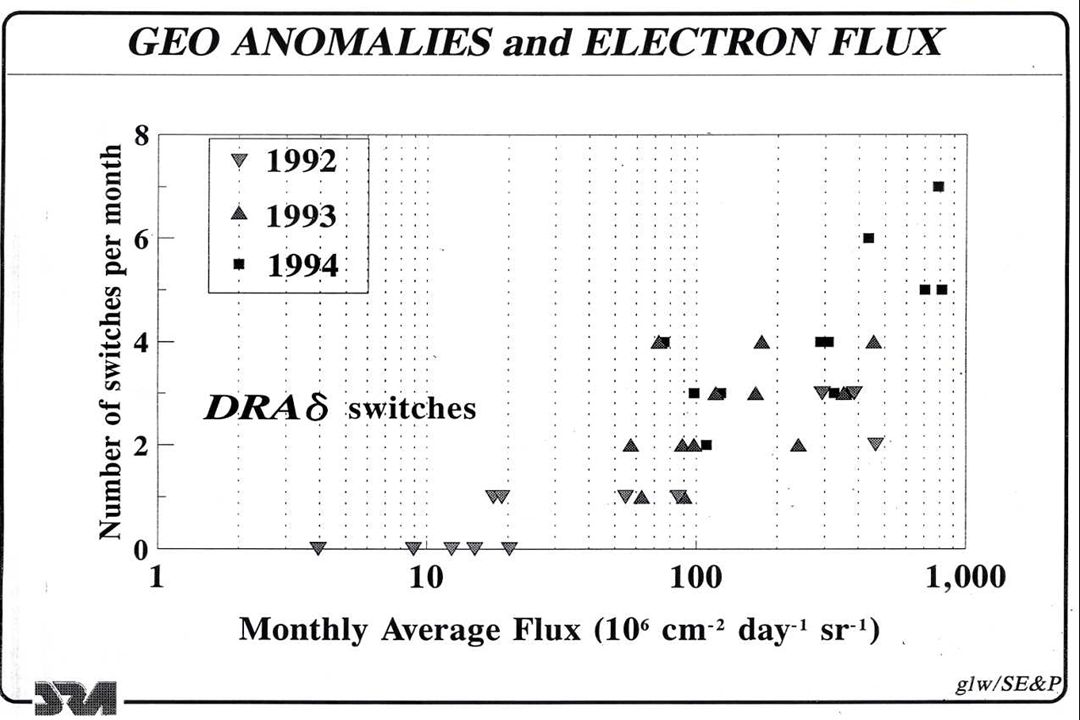
Joe Allen: Phantom Command (PC) is the descriptive name given to the type of anomaly in which a satellite instrument “turns on” when it should be “off”, or the reverse, as if a command was received out of the planned sequence from some phantom ground controller. Such anomalies may be only a nuisance to satellite operators, or they may impair the operation of systems vital to satellite function. They are often seen clustered in sectors of a GEO satellite orbit, such as the “midnight-to-dawn” region (see following slides). Also, they are often clustered bi-modally by season, with the peak happening in the days before and after each equinox. One aerospace engineer reported a GEO satellite that had its anomalies clustered in the hours neares the dawn and dusk meridian passage. However, they were also clustered by season. It turned out that the satellite had significant thermal electron emission from the large sunlit surface of a continually Earth-pointing main antenna. When the satellite was near dawn and dusk, the antenna was self-shadowing and created a condition in which differential surface charging could occur in the presence of lower energy surplus electrons. The distribution of geomagnetic storms as monitored by the Kp or Ap index shows similar equinoctial peaks to those of the PC satellite anomalies, and represent times when surplus electrons are present. EFFECTS on SATELLITES PHANTOM COMMANDS: Differential Surface Charging changes ground reference; charging and arcing affects vulnerable circuits. PROTON EVENTS: Coronal Mass Ejections send streams of high-energy protons, alpha particles and heavier ions Earthward. POWER PANEL OUTPUT LOSS - high energy protons damage active elements of solar power panels. SINGLE EVENT UPSETS (SEUs): Internal Charge Penetration - high energy ions. Protons or heavier ions burn tracks through chips or change internal charge. BULK CHARGING (Deep Dielectric) - Energetic electrons (Ee>1MeV) charge surface or interior dielectrics faster than discharge processes until arcs to lower potential may damage vulnerable circuit or part Magnetic Storms & Substorms affect Navigation Satellites in outer trapping region (half-geostationary altitude). Ambient fields & currents disturb frequency/time standards. Drag affects orbits.
 is the descriptive name given to the type of anomaly in which a satellite instrument turns on when it should be off , or the reverse, as if a command was received out of the planned sequence from some phantom ground controller. Such anomalies may be only a nuisance to satellite operators, or they may impair the operation of systems vital to satellite function. They are often seen clustered in sectors of a GEO satellite orbit, such as the midnight-to-dawn region (see following slides). Also, they are often clustered bi-modally by season, with the peak happening in the days before and after each equinox. One aerospace engineer reported a GEO satellite that had its anomalies clustered in the hours neares the dawn and dusk meridian passage. However, they were also clustered by season. It turned out that the satellite had significant thermal electron emission from the large sunlit surface of a continually Earth-pointing main antenna. When the satellite was near dawn and dusk, the antenna was self-shadowing and created a condition in which differential surface charging could occur in the presence of lower energy surplus electrons. The distribution of geomagnetic storms as monitored by the Kp or Ap index shows similar equinoctial peaks to those of the PC satellite anomalies, and represent times when surplus electrons are present. EFFECTS on SATELLITES. PHANTOM COMMANDS: Differential Surface Charging changes ground reference; charging and arcing affects vulnerable circuits. PROTON EVENTS: Coronal Mass Ejections send streams of high-energy protons, alpha particles and heavier ions Earthward. POWER PANEL OUTPUT LOSS - high energy protons damage active elements of solar power panels. SINGLE EVENT UPSETS (SEUs): Internal Charge Penetration - high energy ions. Protons or heavier ions burn tracks through chips or change internal charge. BULK CHARGING (Deep Dielectric) - Energetic electrons (Ee>1MeV) charge surface or interior dielectrics faster than discharge processes until arcs to lower potential may damage vulnerable circuit or part. Magnetic Storms & Substorms affect Navigation Satellites in outer trapping region (half-geostationary altitude). Ambient fields & currents disturb frequency/time standards. Drag affects orbits.")
34
ACTIVITY in GEOSPACE: What Causes Problems ?
Joe Allen: In order for activity observed on/at the Sun to cause problems for a satellite in interplanetary space, or orbiting Earth inside the magnetosphere, and for technology and humans on Earth or in space, some physical wave or object must reach them from the Sun. These may include: Electromagnetic radiation – light, X-rays, and other wavelengths emitted by the Sun. Energetic particles, especially protons, alphas, and heavier ions from CMEs that expand outward from the Sun in a cloud that eventually may engulf the magnetosphere (or may only slightly graze it or miss it altogether). Successive streams may join together and can form a shock wave that scoops up other plasma in its course. Geomagnetic storms are disturbances at Earth in the otherwise regular daily variations of the geomagnetic field measured by a worldwide array of ground-based magnetic observatories. Such storms arise when a large cloud of electrons penetrate the magnetosphere. They are carried tailward by the broken geomagnetic field lines that merged with the IMS. In the tail, they are injected toward Earth around the midnight meridian in a mass near the equatorial plane. Depending on the sign of their electrical charge, the injected particles are deflected by the geomagnetic field and form a circle of moving charge around Earth (the “ring current”). The dynamic interaction of moving energetic particles and geomagnetic field and induced potentials causes field-aligned currents to flow spiraling down from the equatorial zone at geostationary altitude along field lines to the polar regions where the incoming particles may collide with atmospheric atoms (mainly Oxygen and Nitrogen) and produce the visible aurora, or may rebound for another circuit. Counterpart streams of protons and heavier ions flow in opposite directions from the electrons because of their positive charge. At an altitude of some 100 km, the field-aligned electrons move in E-W flow patterns in the auroral zone, forming the “auroral electrojets”. Polar region magnetic observatories on Earth’s surface record large excursions, especially in H, that vary in amplitude and direction depending on where the station is relative to the overhead current system. These are high latitude disturbances are Auroral Substorms. The equatorial ring current produces a global depression in the H-component of the geomagnetic field. The amplitude of these changes in the geomagnetic field is described and quantified by a variety of magnetic activity indices. Killer Electrons of energy > 2 MeV are recorded by GOES SEM sensors and other geostationary monitoring satellites usually after a the first 24 hours of a recurrent geomagnetic storm. Such increases at GEO altitude may be of two to five orders of magnitude. They can persist for days to weeks, sometimes interrupted for about 24-hours by another low-level magnetic storm. Exposure to these persistent high levels of energetic electrons is associated with satellite bulk charging and consequent arcing which can damage vital satellite elements. ACTIVITY in GEOSPACE: What Causes Problems ? Electromagnetic Radiation: Flare X-rays and UV affect ionosphere/communications. Energetic particles (ions) form shock wave, move magnetosphere inside GEO, enhance radiation belts, and cause geomagnetic storms & substorms. Geomagnetic storm disturbed fields & current systems, surface charging. Auroral Substorm current systems and fields affect satellites directly. Killer Electrons: increase at GEO after low level magnetic storm, last for weeks.
. Successive streams may join together and can form a shock wave that scoops up other plasma in its course. Geomagnetic storms are disturbances at Earth in the otherwise regular daily variations of the geomagnetic field measured by a worldwide array of ground-based magnetic observatories. Such storms arise when a large cloud of electrons penetrate the magnetosphere. They are carried tailward by the broken geomagnetic field lines that merged with the IMS. In the tail, they are injected toward Earth around the midnight meridian in a mass near the equatorial plane. Depending on the sign of their electrical charge, the injected particles are deflected by the geomagnetic field and form a circle of moving charge around Earth (the ring current ). The dynamic interaction of moving energetic particles and geomagnetic field and induced potentials causes field-aligned currents to flow spiraling down from the equatorial zone at geostationary altitude along field lines to the polar regions where the incoming particles may collide with atmospheric atoms (mainly Oxygen and Nitrogen) and produce the visible aurora, or may rebound for another circuit. Counterpart streams of protons and heavier ions flow in opposite directions from the electrons because of their positive charge. At an altitude of some 100 km, the field-aligned electrons move in E-W flow patterns in the auroral zone, forming the auroral electrojets . Polar region magnetic observatories on Earth’s surface record large excursions, especially in H, that vary in amplitude and direction depending on where the station is relative to the overhead current system. These are high latitude disturbances are Auroral Substorms. The equatorial ring current produces a global depression in the H-component of the geomagnetic field. The amplitude of these changes in the geomagnetic field is described and quantified by a variety of magnetic activity indices. Killer Electrons of energy > 2 MeV are recorded by GOES SEM sensors and other geostationary monitoring satellites usually after a the first 24 hours of a recurrent geomagnetic storm. Such increases at GEO altitude may be of two to five orders of magnitude. They can persist for days to weeks, sometimes interrupted for about 24-hours by another low-level magnetic storm. Exposure to these persistent high levels of energetic electrons is associated with satellite bulk charging and consequent arcing which can damage vital satellite elements. ACTIVITY in GEOSPACE: What Causes Problems Electromagnetic Radiation: Flare X-rays and UV affect ionosphere/communications. Energetic particles (ions) form shock wave, move magnetosphere inside GEO, enhance radiation belts, and cause geomagnetic storms & substorms. Geomagnetic storm disturbed fields & current systems, surface charging. Auroral Substorm current systems and fields affect satellites directly. Killer Electrons: increase at GEO after low level magnetic storm, last for weeks.")
35
Joe Allen: Marsha Korose, USAF-OSA, sent a PowerPoint Briefing used “For the Colonels and Generals” to tell them about what disturbed space conditions can do to satellites in orbit. This figure shows several types of damage that can result from different types of solar activity (or galactic cosmic rays). This does not address the hazard to ground-based, ship or airborne units, nor to humans in orbit or flying at high altitude. It also does not address the effect of space environment disturbances on telecommunications, changes in the geomagnetic field that can disorient satellites, and specific failure modes. OSA also sponsored compilation of listings of satellite anomalies by Harry Koons, et al. (Aerospace Corp.) Harry and others have published a number of publically available reports on satellite anomalies, spacecraft anomaly reports, and similar topics.
. This does not address the hazard to ground-based, ship or airborne units, nor to humans in orbit or flying at high altitude. It also does not address the effect of space environment disturbances on telecommunications, changes in the geomagnetic field that can disorient satellites, and specific failure modes. OSA also sponsored compilation of listings of satellite anomalies by Harry Koons, et al. (Aerospace Corp.) Harry and others have published a number of publically available reports on satellite anomalies, spacecraft anomaly reports, and similar topics.")
37
Joe Allen: After the comments on the previous two slides were written, a colleague from the Satellite Anomalies group talked to me about the October 2000, S-RAMP meeting in Sapporo, Japan. While discussing early days of “Space Weather” studies, I mentioned having seen a figure like the one in this slide. My colleague thought the description sounded familiar and found this in his collection (as a negative). He scanned it and ed it to me for use in this presentation. I believe this to be a later version of the one I first saw in August 1972, and that anomalies on other satellites have been added. The slide shows the distribution in satellite local time of anomalies on different GEO spacecraft. Most are clustered in the midnight to dawn sector. I suspect they were associated with injection of thermal electrons from the magnetotail during geomagnetic storms or auroral substorms. Anomaly events near noon and in the evening hours are more likely due to encounters with energetic protons. At the COSPAR Colloquium in Wanli, Taipei, Taiwan, Joe Fennel (Aerospace Corp) confirmed that he authored this figure in the early 1970’s. His first version, the one I saw in Boulder, was for the DSCS anomalies. This was an early project for Joe at Aerospace Corporation.
. He scanned it and ed it to me for use in this presentation. I believe this to be a later version of the one I first saw in August 1972, and that anomalies on other satellites have been added. The slide shows the distribution in satellite local time of anomalies on different GEO spacecraft. Most are clustered in the midnight to dawn sector. I suspect they were associated with injection of thermal electrons from the magnetotail during geomagnetic storms or auroral substorms. Anomaly events near noon and in the evening hours are more likely due to encounters with energetic protons. At the COSPAR Colloquium in Wanli, Taipei, Taiwan, Joe Fennel (Aerospace Corp) confirmed that he authored this figure in the early 1970’s. His first version, the one I saw in Boulder, was for the DSCS anomalies. This was an early project for Joe at Aerospace Corporation.")
38
Joe Allen: In summer 1995, John Freeman (Rice University) visited with NGDC STP Division staff and presented the Rice Magnetospheric Specification Model. Dan Wilkinson combined it with the clock diagram display of GOES anomalies and produced this figure. It shows in equatorial plane cross section the early phase of electron injection during a substorm and the drifting toward dawn meridian superposed on the map of anomaly events.
 visited with NGDC STP Division staff and presented the Rice Magnetospheric Specification Model. Dan Wilkinson combined it with the clock diagram display of GOES anomalies and produced this figure. It shows in equatorial plane cross section the early phase of electron injection during a substorm and the drifting toward dawn meridian superposed on the map of anomaly events.")
40
Gli effetti sull’ambiente terrestre sono generati principalmente dalle tempeste geomagnetiche, risultanti da disturbi nel vento solare, e dall’aumento del flusso di particelle energetiche e di radiazione elettromagnetica.

41
Joe Allen: These LEO satellite anomalies illustrate a mapping of the South Atlantic Anomaly (SAA) and, to a lesser extent, the auroral zone belts.
 and, to a lesser extent, the auroral zone belts.")
42
Joe Allen: Dan Wilkinson (NGDC-STP) and Herb Sauer (SEL-ret) worked together on several projects involving NOAA SEM data. One of their efforts was to process a month of NOAA-10 energetic particle measurements into different energy levels and orientations during each orbit. Dan prepared a graphic to show the energy count of each energy level and wrote the software to project it in color-coded regions over a map of the continents. The NOAA inclined polar orbit does not take it over the poles, so there are data gaps above each polar region. However, the auroral zone and South Atlantic Anomaly region are well shown. During the disturbed days of March, the SAA effectively joined to the southern auroral zone region. Superposed on this activity display are numbered triangles corresponding to locations of LEO satellite NOAA-11when it experienced anomalies. These anomalies happened over a span of months (88/09 – 90/08) and not just during the activity period in March However, the positions of most of the anomaly markers suggests some involvement with exposure of the satellite and its instruments to enhanced populations of trapped electrons. Dan’s demonstration file of the particle data runs on a PC and can be operated in a video mode to show the growing and shifting particle population during the active interval. It does not show satellite anomalies. Please contact Dan and/or Herb if you have further interest in this.
 and Herb Sauer (SEL-ret) worked together on several projects involving NOAA SEM data. One of their efforts was to process a month of NOAA-10 energetic particle measurements into different energy levels and orientations during each orbit. Dan prepared a graphic to show the energy count of each energy level and wrote the software to project it in color-coded regions over a map of the continents. The NOAA inclined polar orbit does not take it over the poles, so there are data gaps above each polar region. However, the auroral zone and South Atlantic Anomaly region are well shown. During the disturbed days of March, the SAA effectively joined to the southern auroral zone region. Superposed on this activity display are numbered triangles corresponding to locations of LEO satellite NOAA-11when it experienced anomalies. These anomalies happened over a span of months (88/09 – 90/08) and not just during the activity period in March However, the positions of most of the anomaly markers suggests some involvement with exposure of the satellite and its instruments to enhanced populations of trapped electrons. Dan’s demonstration file of the particle data runs on a PC and can be operated in a video mode to show the growing and shifting particle population during the active interval. It does not show satellite anomalies. Please contact Dan and/or Herb if you have further interest in this.")
43
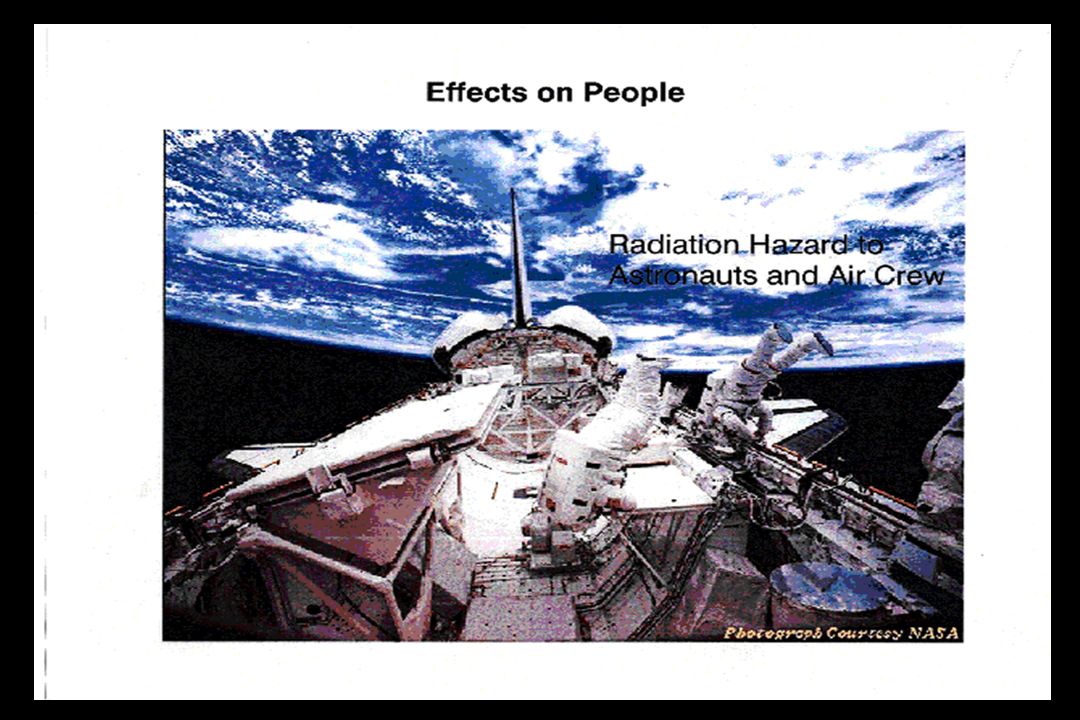
Effects on Humans All ground-based effects are important for impact on humans. High altitude aircraft radiation effects and all airborne technology effects are impact on humans. Astronauts directly affected by high energy protons and heavier ions.

45
Effetti sui satelliti artificiali:
Caricamento elettrico superficiale dovuto a plasma di bassa energia; SEU (eventi singoli di disturbo) dovuti a particelle di alta energia; Frenamento aerodinamico variabile con modifica delle orbite basse
 dovuti a particelle di alta energia; Frenamento aerodinamico variabile con modifica delle orbite basse.")
47
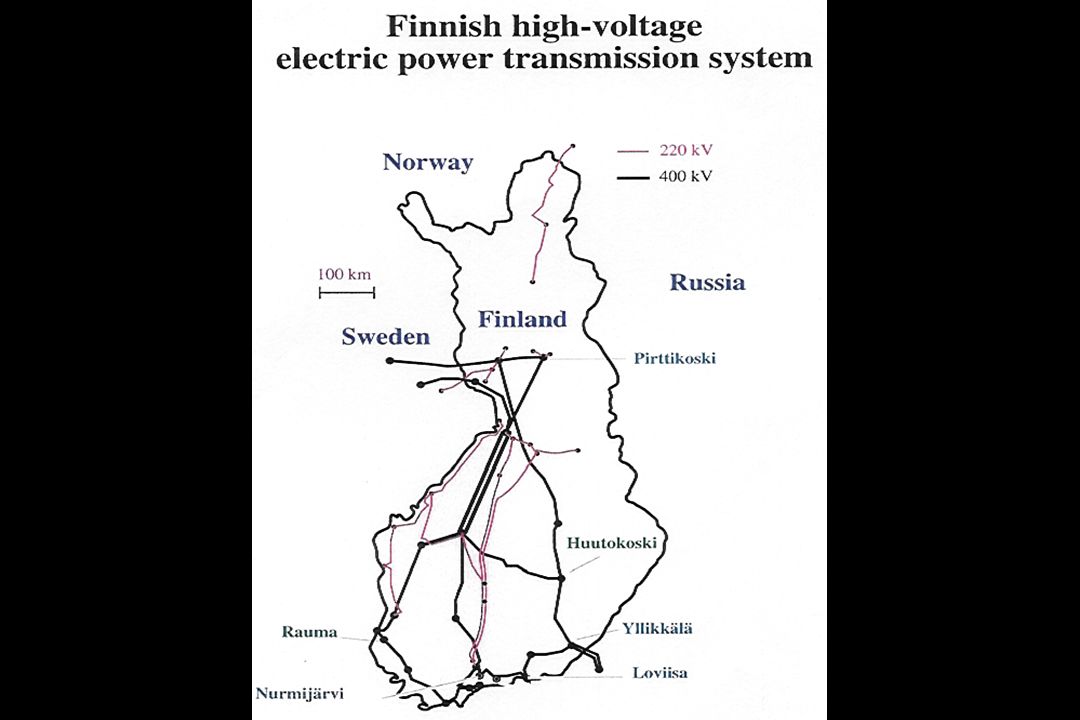
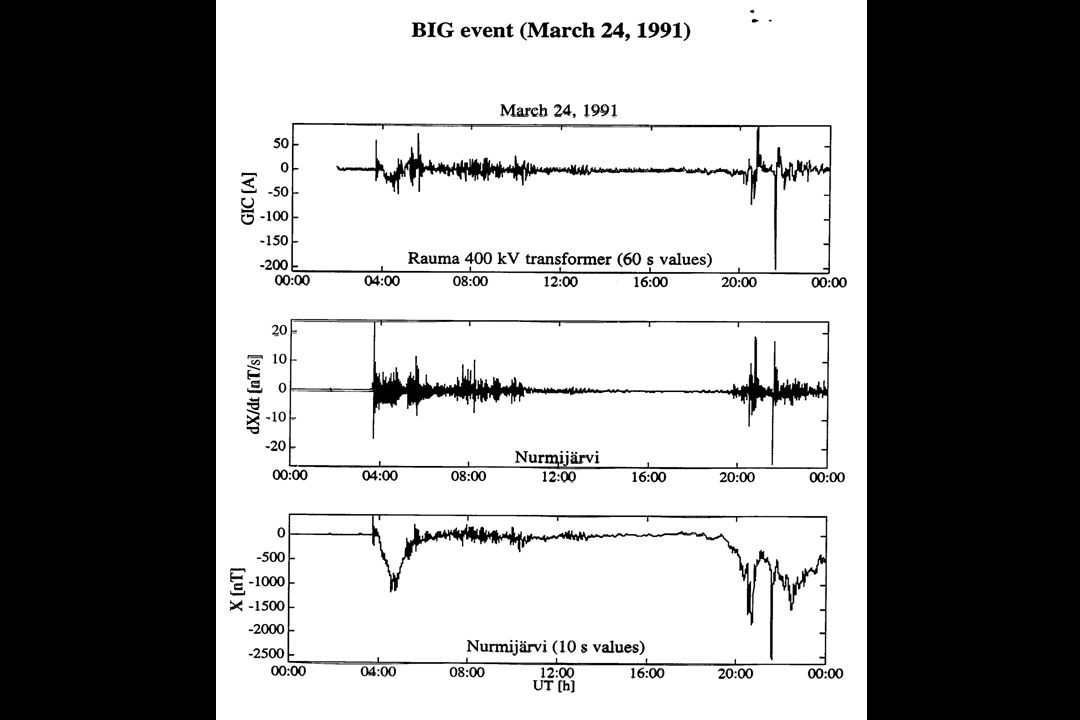
Correnti Geomagneticamente Indotte (GICs)
Intense correnti ionosferiche possono generarsi ad alta latitudine durante le tempeste geomagnetiche. Queste inducono correnti simili a terra ad esempio nei cavi per la distribuzione della energia elettrica o negli oleodotti.

51
Il programma internazionale ILWS (International Living With a Star; Convivere con una stella) mira a coordinare tutte le attività di studio e ricerca sul Sole, sul vento solare, sulla magnetosfera terrestre, sulla ionosfera e sugli effetti sui sistemi tecnologici umani a terra e nello spazio, condotte da vari paesi
 mira a coordinare tutte le attività di studio e ricerca sul Sole, sul vento solare, sulla magnetosfera terrestre, sulla ionosfera e sugli effetti sui sistemi tecnologici umani a terra e nello spazio, condotte da vari paesi")
52
Living With a Star

53
Climate and Weather of the Sun-Earth System
CAWSES Climate and Weather of the Sun-Earth System A SCOSTEP Program Il programma CAWSES: lo SCOSTEP (Scientific Committee for Solar Terrestrial Physics) propone il programma quadriennale di studio dello space weather.
 propone il programma quadriennale di studio dello space weather.")
54
Timeline of Significant STP Discoveries and Programs of the 20th Century

55
Italian activities in Solar terrestrial physics
Ground observations of the Sun (optical and radio telescopes) Space observations of the Sun ( SOHO) Solar wind observations (WIND, ULYSSES, CLUSTER) Observations of the Earth magnetosphere (CLUSTER) Ground observations of the Earth ionosphere (ionosondes, riometers, all-sky cameras, SuperDARN radars) Ground magnetic field measurements (observatories) Cosmic ray monitors Theory and data analysis
 Space observations of the Sun ( SOHO) Solar wind observations (WIND, ULYSSES, CLUSTER) Observations of the Earth magnetosphere (CLUSTER) Ground observations of the Earth ionosphere (ionosondes, riometers, all-sky cameras, SuperDARN radars) Ground magnetic field measurements (observatories) Cosmic ray monitors. Theory and data analysis.")
56
Grazie dell’attenzione

57
seen as a quick-motion movie
The same CME, seen as a quick-motion movie Two small comets are evaporating near the sun. A few hours later a huge ejection occurs. Coincidence? A unique observation by LASCO-C2. Note the helical structure of the prominence filaments!

58
Spectacular, right?

59
Space Weather prediction: practical exercise...
A very fast halo CME on June 5, 2000. We predicted a strong geomagnetic storm for June 7/8. We were right!

60
The sun as a “ballerina”, according to Alfvén, 1977.

61
The originally sharp front separating streams of different speed
widens because of stream-stream interactions. By about 1 AU all solar wind has been “processed” this way. That marks the border between Inner and Outer heliosphere. Scheme of the radial evolution of a CIR

62
The curvature depends strongly on the solar wind speed
The “Parker spiral”. The curvature depends strongly on the solar wind speed In case fast wind follows slow wind, a corotating interaction region (CIR) forms, where the plasma is compressed and deflected
 forms, where the plasma is compressed and deflected.")
63
Effects of the energy transfer
Field Dipolarization Aurorae Particle energization Currents Intensification

64
La densità di energia trasportata dal vento solare è un milionesimo di quella trasportata dalla radiazione elettromagnetica. La superficie sulla quale viene raccolta però è molto maggiore, dato che l’ostacolo rappresentato dalla magnetosfera ha dimensioni lineari dell’ordine di 50 raggi terrestri. Quindi l’energia che il vento solare deposita sul sistema è solo mille volte inferiore. Una frazione di questa energia sfugge verso la coda, ma il resto viene convogliata a terra, Se il trasporto di questa energia è dovuto alle particelle, queste sono costrette a muoversi lungo le linee di forza del campo magnetico e quindi l’energia viene convogliata verso le regioni polari, con un fattore di concentrazione che rispecchia il rapporto fra i campi magnetici delle regioni da cui le particelle provengono e quello a poche centinaia di Km di altezza; questo rapporto può essere anche Tutto ciò per dire che il flusso di energia trasportata dal vento solare, che finisce sulle regioni polari, può essere sostanziale in rapporto al flusso di energia che vi giunge per illuminazione diretta. La parte della regione polare che le particelle raggiungono ha una forma ad anello, attorno al polo magnetico, che varia di raggio al variare della attività geomagnetica; questo ovale aurorale quindi giace attorno alle latitudini di 80° per bassa attività, e può scendere fino a medie latitudini magnetiche per attività elevata.

65
Joe Allen: This slide was prepared by Dan Wilkinson in to show the location in orbit of different types of anomalies experienced by NOAA’s Geostationary Operational Environmental Satellite (GOES) –4 and –5. Phantom Commands are clearly clustered in the midnight to dawn sector. Identification of the type of satellite anomaly is often difficult and can only be inferred, so it is helpful to have a record of the time and location in orbit of anomalies of each type. Single Event Upsets (SEU) are “penetration” events in which high energy charged particles (protons, alphas, or heavier ions) enter a chip and “burn” a destructive track or deposit charge that changes the contents of chip memory. Random Part Failures (RPF) are those rarer events when a component on a satellite fails and, if the satellite is to keep operating, its controllers must switch operations to a redundant component. The figure in this slide mimics one for USAF DSCS satellites shown to Joe Allen in August 1972 by Wayne LeJeune (TRW) during a visit to Boulder. A sudden catastrophic failure of a satellite when Wayne was in Boulder resulted in call from California to check out conditions. This was during the event that NASA christened the “Anomalous Large Proton Event”, although it later was fitted into a relatively continuous spectrum of event amplitudes. Wayne came to Joe Allen’s office at NGDC and showed him a clock-face diagram of DSCS satellite anomalies. It looked much like the GOES plot seen here.
 –4 and –5. Phantom Commands are clearly clustered in the midnight to dawn sector. Identification of the type of satellite anomaly is often difficult and can only be inferred, so it is helpful to have a record of the time and location in orbit of anomalies of each type. Single Event Upsets (SEU) are penetration events in which high energy charged particles (protons, alphas, or heavier ions) enter a chip and burn a destructive track or deposit charge that changes the contents of chip memory. Random Part Failures (RPF) are those rarer events when a component on a satellite fails and, if the satellite is to keep operating, its controllers must switch operations to a redundant component. The figure in this slide mimics one for USAF DSCS satellites shown to Joe Allen in August 1972 by Wayne LeJeune (TRW) during a visit to Boulder. A sudden catastrophic failure of a satellite when Wayne was in Boulder resulted in call from California to check out conditions. This was during the event that NASA christened the Anomalous Large Proton Event , although it later was fitted into a relatively continuous spectrum of event amplitudes. Wayne came to Joe Allen’s office at NGDC and showed him a clock-face diagram of DSCS satellite anomalies. It looked much like the GOES plot seen here.")
66
Radiation Belts and the ISS

67
Effetti sugli esseri umani nello spazio

68
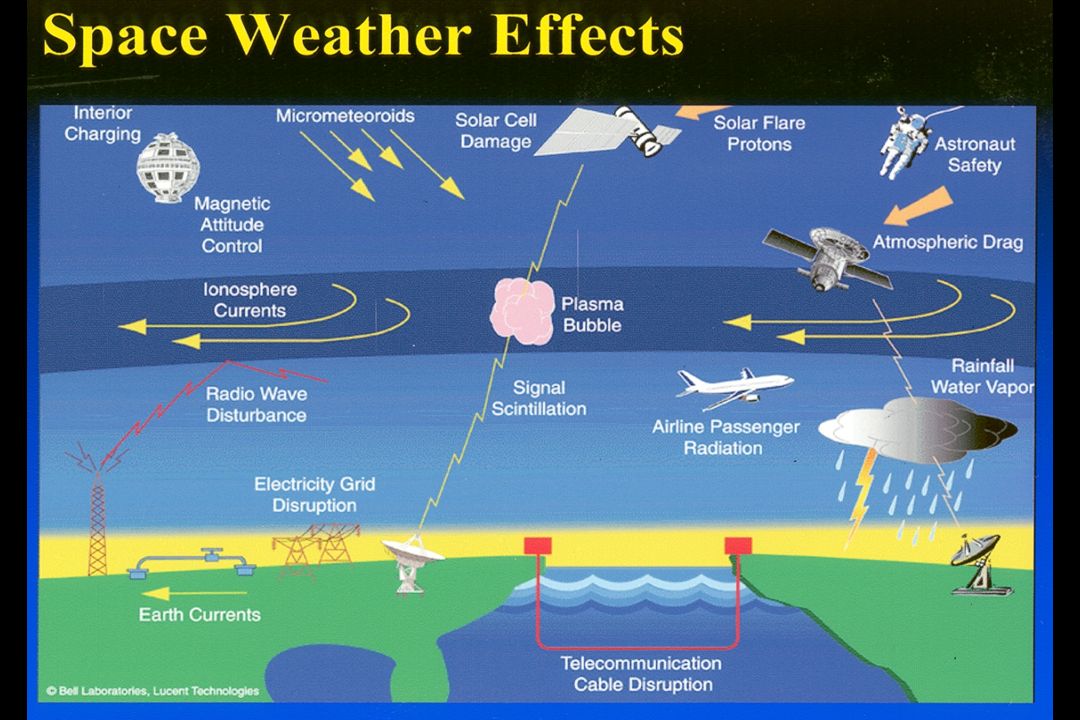
Effetti sui sistemi sociali
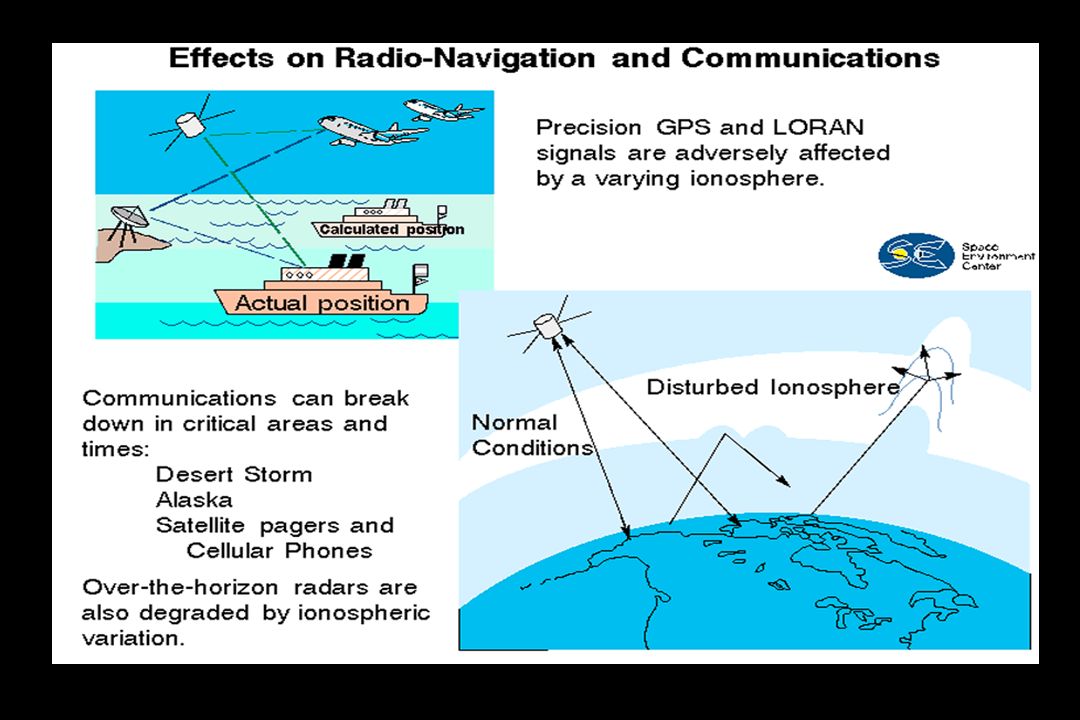
Corrosione delle tubature di gas o petrolio Scintillazione del segnale elettromagnetico Perturbazione delle telecomunicazioni via cavo Radiazione a cui sono sottoposti i passeggeri negli aerei Perturbazione o rottura delle reti elettriche Perturbazioni delle onde radio Malfunzionamenti di satelliti artificiali

69
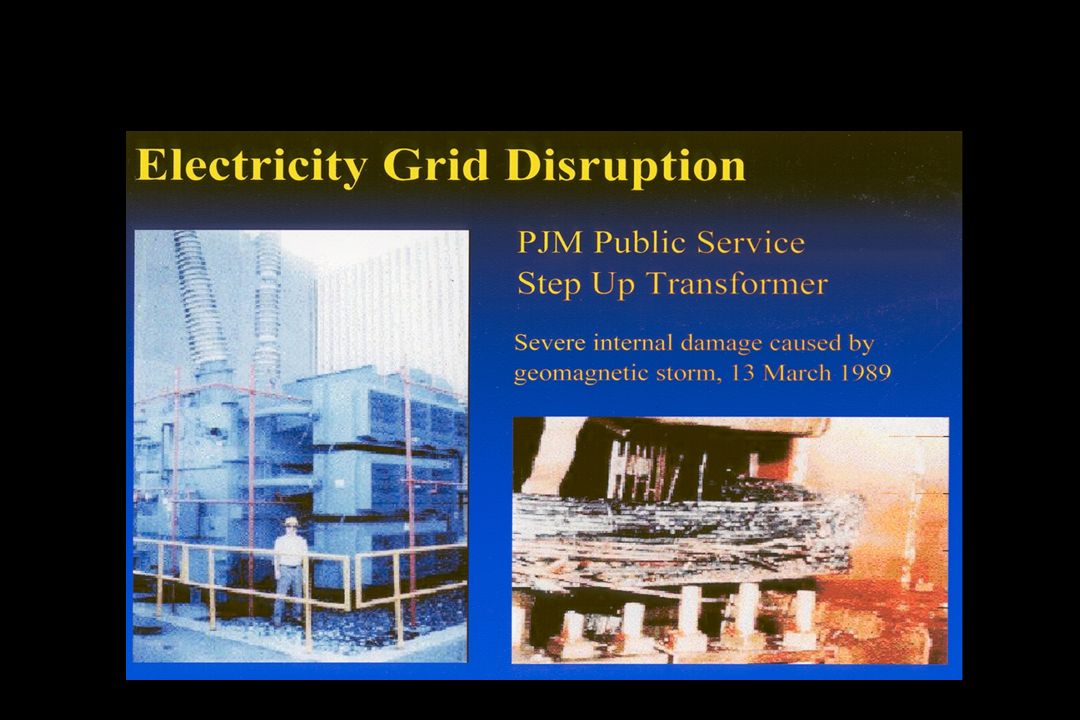
Effetti delle tempeste spaziali
science.nasa.gov/ssl/pad/sppb/ Le tempeste spaziali possono essere dannose per le reti di energia elettrica sulla superficie della terra. Una grande tempesta spaziale nel 1989 indusse correnti elettriche che causarono gravi guasti nel sistema di distribuzione dell’energia elettrica del Quebec. Ciò impedì a 6 milioni di persone nel Canada e negli Stati Uniti di avere elettricità per oltre 9 ore.

70
Pagine web Previsioni per oggi http://helios.gsfc.nasa.gov/
Previsioni per oggi

Presentazioni simili


>")


>")


