Scaricare la presentazione
La presentazione è in caricamento. Aspetta per favore

1
L’Unione Europea e il processo decisionale La funzione statistica europea: Eurostat La sorveglianza macroeconomica Domande, discussione Marco Pellegrino

2
Stati membri dell’Unione europea L’Unione europea: 500 milioni di abitanti, 28 paesi Paesi candidati e potenziali candidati

3
I trattati – base per una cooperazione democratica e fondata sul diritto (anno di entrata in vigore) Comunità europea del carbone e dell’acciaio Trattati di Roma: Comunità economica europea Comunità europea dell’energia atomica (EURATOM) Atto unico europeo: nasce il Mercato unico Trattato sull’Unione europea - Maastricht Trattato di Amsterdam 1952 1958 1987 1993 1999 2003 Trattato di Nizza 2009 Trattato di Lisbona
 Comunità europea del carbone e dell’acciaio Trattati di Roma: Comunità economica europea Comunità europea dell’energia atomica (EURATOM) Atto unico europeo: nasce il Mercato unico Trattato sull’Unione europea - Maastricht Trattato di Amsterdam Trattato di Nizza 2009 Trattato di Lisbona")
4
Allargamento: da 6 a 28 paesi

5
La popolazione dell’UE rispetto al resto del mondo Popolazione in milioni (2015)
")
6
La ricchezza dell’UE e del resto del mondo Dimensione dell’economia: Prodotto interno lordo 2013 in bilioni di euro La ricchezza media: Prodotto interno lordo pro capite, 2013

7
Com’è speso il denaro dell’UE Bilancio totale dell’UE nel 2015 EU budget: € 145.3 miliardi di euro (1.02 % del reddito nazionale lordo) Europa globale: inclusi gli aiuti per lo sviluppo 6 % Altro, amministrazione 6 % Crescita intelligente e inclusiva: posti di lavoro, competitività, sviluppo regionale 46 % Sicurezza e cittadinanza, giustizia 2 % Crescita sostenibile – risorse naturali: agricoltura, ambiente 40 %
 Europa globale: inclusi gli aiuti per lo sviluppo 6 % Altro, amministrazione 6 % Crescita intelligente e inclusiva: posti di lavoro, competitività, sviluppo regionale 46 % Sicurezza e cittadinanza, giustizia 2 % Crescita sostenibile – risorse naturali: agricoltura, ambiente 40 %")
8
Le istituzioni dell’UE Parlamento europeo Corte di giustizia Corte dei conti Comitato economico e sociale Comitato delle regioni Consiglio dei ministri (Consiglio dell’UE) Commissione europea Banca europea per gli investimenti Banca centrale europea Agenzie Consiglio europeo (vertice)
 Commissione europea Banca europea per gli investimenti Banca centrale europea Agenzie Consiglio europeo (vertice)")
9
Il processo legislativo nell’UE Cittadini, gruppi d’interesse, esperti: dibattito e consultazione Commissione: prepara una proposta formale Parlamento e Consiglio dei ministri: decidono insieme Autorità nazionali o locali: attuazione Commissione e Corte di giustizia: controllano l’attuazione

10
L’Unione Europea in cifre L’UE: schede informative http://europa.eu/abc/euslides/index_it.htm http://europa.eu/abc/euslides/index_it.htm Europe 2020 http://ec.europa.eu/europe2020/index_en.htm http://ec.europa.eu/europe2020/index_en.htm

11
Walter Rader macher 11 European Statistical System – Sistema Statistico Europeo Eurostat Our aims are: To be the public authority for European Statistics and verify data used for administrative purposes To provide the high-quality statistical information needed to design, implement, monitor and evaluate EU policies To develop and promote standards, methods and procedures that allow the cost effective production and dissemination of comparable and reliable statistics throughout the EU and beyond To steer the European Statistical System, strengthen cooperation among its partners, and ensure its leading role in official statistics world wide Working method:ESS working groups, task-forces, committees International work sessions

12
Eurostat: http://ec.europa.eu/eurostathttp://ec.europa.eu/eurostat 12

13
http://itunes.apple.com/us/app/country-profile/id490077702?mt=8 https://play.google.com/store/apps/developer?id=Eurostat http://www.androidzoom.com/android_applications/tools/eurostat-country-profiles_bxmbh.html # EU_Eurostat App per telefonia mobile

14
Eurostat The European System of Accounts http://ec.europa.eu/eurostat/statistics-explained/index.php/Main_Page

15
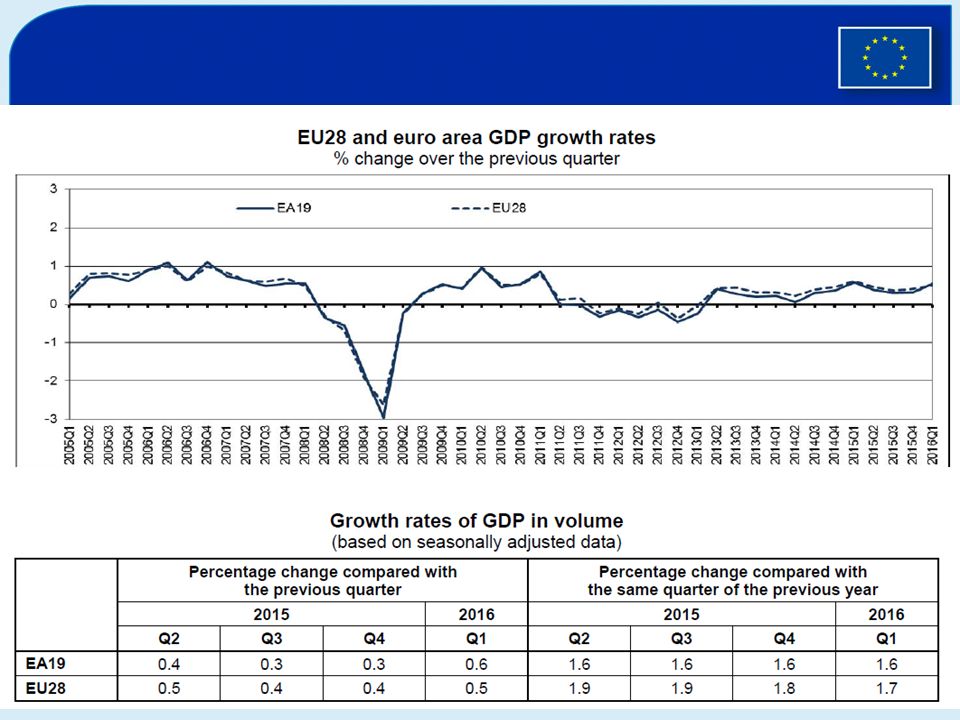
Recently published http://ec.europa.eu/eurostat/publications/recently-published http://ec.europa.eu/eurostat/publications/recently-published Statistics explained http://ec.europa.eu/eurostat/statistics-explained/index.php/Main_Page http://ec.europa.eu/eurostat/statistics- explained/index.php/National_accounts_and_GDP http://ec.europa.eu/eurostat/statistics-explained/index.php/Main_Page http://ec.europa.eu/eurostat/statistics- explained/index.php/National_accounts_and_GDP http://ec.europa.eu/eurostat/news/earlier-release-of-european-gdp-growth-rates Manual on Government Deficit and Debt http://ec.europa.eu/eurostat/documents/3859598/7203647/KS-GQ-16-001-EN- N.pdf/5cfae6dd-29d8-4487-80ac-37f76cd1f012 http://ec.europa.eu/eurostat/documents/3859598/7203647/KS-GQ-16-001-EN- N.pdf/5cfae6dd-29d8-4487-80ac-37f76cd1f012 Basic figures on the EU – first quarter 2016 http://ec.europa.eu/eurostat/documents/4031688/7191586/KS-GL-16-001-EN- N.pdf/ccb90103-2ea6-48b4-9390-a75613f4897e http://ec.europa.eu/eurostat/documents/4031688/7191586/KS-GL-16-001-EN- N.pdf/ccb90103-2ea6-48b4-9390-a75613f4897e

16
More than 60% of the NUTS 2 regions of the European Union (EU) recorded a decrease of at least 0.5 percentage points in their regional unemployment rate in 2015 compared with 2014. However, regional unemployment rates continued to vary widely across the EU regions, with the lowest rates recorded in the German regions of Freiburg and Niederbayern (both 2.5%), Oberbayern and Oberpfalz (both 2.7%), followed by Praha in the Czech Republic (2.8%). At the opposite end of the scale, the highest unemployment rates were registered in Melilla (34.0%) and Andalucía (31.5%) in Spain, Dytiki Makedonia (30.7%) in Greece, Canarias and Extremadura (both 29.1%) in Spain. Eurostat News release
, Oberbayern and Oberpfalz (both 2.7%), followed by Praha in the Czech Republic (2.8%). At the opposite end of the scale, the highest unemployment rates were registered in Melilla (34.0%) and Andalucía (31.5%) in Spain, Dytiki Makedonia (30.7%) in Greece, Canarias and Extremadura (both 29.1%) in Spain. Eurostat News release.")
17
Eurostat Il Sistema Europeo dei Conti (SEC/ESA) Il nuovo SNA (prec. 1993)SNA Il nuovo ESA 2010 (prec. 1995) Aggiornamento metodologico che riflette i cambiamenti economici e le necessità degli utilizzatori
SNA Il nuovo ESA 2010 (prec. 1995) Aggiornamento metodologico che riflette i cambiamenti economici e le necessità degli utilizzatori.")
18
Eurostat Il ruolo dell’ESA nella UE Regolamento Bilancio UE (risorse proprie) Politica fiscale: deficit e debito in rapporto al pil Fondi Strutturali: pil regionale Macroeconomic Imbalance Procedure (MIP)
 Politica fiscale: deficit e debito in rapporto al pil Fondi Strutturali: pil regionale Macroeconomic Imbalance Procedure (MIP)")
19
PIL – prodotto interno lordo Valore monetario totale dei beni e servizi prodotti in un Paese da parte di operatori economici residenti e non residenti nel corso di un periodo di tempo. Beni e servizi destinati al consumo dell'acquirente finale, agli investimenti privati e pubblici, alle esportazioni nette (esportazioni totali meno importazioni totali). Non viene quindi conteggiata la produzione destinata ai consumi intermedi di beni e servizi consumati e trasformati nel processo produttivo per ottenere nuovi beni e servizi.
. Non viene quindi conteggiata la produzione destinata ai consumi intermedi di beni e servizi consumati e trasformati nel processo produttivo per ottenere nuovi beni e servizi..")
20
GDP – Gross Domestic ProductGross Domestic Product Production approach: Gross value added = gross value of output – value of intermediate consumption Income approach: GDP = compensation of employees + gross operating surplus + gross mixed income + taxes less subsidies on production and imports Expenditure approach: GDP (Y) is the sum of consumption (C), investment (I), government spending (G) and net exports (X – M). Y=C+G+I+(X-M) Y+M=C+G+I+X
 Y+M=C+G+I+X.")
21
http://ec.europa.eu/eurostat/statistics-explained/index.php/Preliminary_GDP_flash_estimate_in_30_days_for_Europe 21

23
Davvero il PIL è così importante? Rapporto Stiglitz (Economic Performance and Social Progress) Gross domestic product (GDP) is the most widely used measure of economic activity. There are international standards for its calculation, and much thought has gone into its statistical and conceptual bases. But GDP mainly measures market production, though it has often been treated as if it were a measure of economic well-being. Conflating the two can lead to misleading indications about how well-off people are and entail the wrong policy decisions. http://www.stiglitz-sen-fitoussi.fr/en/index.htmhttp://www.stiglitz-sen-fitoussi.fr/en/index.htm (2009)
 Gross domestic product (GDP) is the most widely used measure of economic activity. There are international standards for its calculation, and much thought has gone into its statistical and conceptual bases. But GDP mainly measures market production, though it has often been treated as if it were a measure of economic well-being. Conflating the two can lead to misleading indications about how well-off people are and entail the wrong policy decisions. (2009).")
24
Alcune raccomandazioni Dalla produzione al benessere 1.Guardare al reddito, al consumo e alla ricchezza, non solo alla produzione 2.Dare piu’ importanza alla distribuzione del reddito, e al settore Famiglie 3.Ampliare la misurare di attività non di mercato 4.Dare importanza a misure oggettive e soggettive del benessere 5.Sostenibilità ambientale. “Dashboard” di indicatori 6.Le indagini statistiche dovrebbero valutare vari aspetti della qualità della vita, e queste informazioni dovrebbero essere utilizzate nell’impostare le politiche nei vari campi

25
Economic policy surveillance in the European Union Macroeconomic Imbalances Scoreboard Alert Mechanism Report Annual Growth Survey

26
Excessive Deficit Procedure (EDP) 26 Treaty on the European Union (Maastricht, 7 February 1992) Article 126: Excessive Deficit Procedure Protocol on the Excessive Deficit Procedure
 26 Treaty on the European Union (Maastricht, 7 February 1992) Article 126: Excessive Deficit Procedure Protocol on the Excessive Deficit Procedure")
27
Protocol on the excessive deficit procedure 27 Article 1 The reference values referred to in Article 126 of this Treaty: -3% for the ratio of the planned/actual government deficit -60% for the ratio of government debt Article 2 Government means general government = central and regional/local gov. and social security funds Deficit means net borrowing Debt means total gross debt at nominal value outstanding at the year’s end and consolidated

28
Protocol on the excessive deficit procedure (2) 28 Article 3 The Member States shall report their planned and actual deficits and the levels of their debt promptly and regularly to the Commission Article 4 The statistical data to be used for the application of this Protocol shall be provided by the Commission
 28 Article 3 The Member States shall report their planned and actual deficits and the levels of their debt promptly and regularly to the Commission Article 4 The statistical data to be used for the application of this Protocol shall be provided by the Commission")
29
Macroeconomic surveillance 29 Excessive Imbalance Procedure Scoreboard: a set of indicators for an early detection pf external and internal imbalances Alert Mechanism: thresholds defined for each indicators, but not a mechanical interpretation (country-specific qualitative analysis) Stability and Growth Pact Reinforced in 2011: Six-pack, Two-pack
 Stability and Growth Pact Reinforced in 2011: Six-pack, Two-pack")
30
EU Stability and Growth Pact 30 Resolution by all parties to implement a process of multilateral budgetary surveillance Regular surveillance to provide early warning if budget deficits diverge from the agreed medium-term target (preventive arm) Corrective procedure which requires Member States to act to address excessive budget deficits and, if necessary, allow the Council to impose sanctions (corrective arm)
 Corrective procedure which requires Member States to act to address excessive budget deficits and, if necessary, allow the Council to impose sanctions (corrective arm)")
31
31

32
Alert Mechanism Report (AMR) (Scoreboard and thresholds) November Programme countries their own enhanced surveillance No problem Procedure stops In-Depth Reviews (IDRs) Commission prepares in-depth country reviews, using a wide set of indicators and analytical tools March No problem Procedure stops Imbalances Recommendations integrated under European Semester May Excessive imbalances Recommendations and Specific Monitoring or Corrective Action Plan Ccontinuous monitoring 32 The Macroeconomic Imbalances Procedure (MIP) at a glance
 (Scoreboard and thresholds) November Programme countries their own enhanced surveillance No problem Procedure stops In-Depth Reviews (IDRs) Commission prepares in-depth country reviews, using a wide set of indicators and analytical tools March No problem Procedure stops Imbalances Recommendations integrated under European Semester May Excessive imbalances Recommendations and Specific Monitoring or Corrective Action Plan Ccontinuous monitoring 32 The Macroeconomic Imbalances Procedure (MIP) at a glance")
33
The scope of the scoreboard + auxiliary indicators and auxiliary social indicators (no thresholds) 33 External positions: current accounts, net international investment positions Competitiveness developments : real effective exchange rates, unit labour costs Export performance: export market shares Private sector indebtedness: credit, debt Public sector indebtedness Assets markets: housing Financial sector developments: financial sector liabilities Unemployment EXTERNAL IMBALANCES INTERNAL IMBALANCES
 33 External positions: current accounts, net international investment positions Competitiveness developments : real effective exchange rates, unit labour costs Export performance: export market shares Private sector indebtedness: credit, debt Public sector indebtedness Assets markets: housing Financial sector developments: financial sector liabilities Unemployment EXTERNAL IMBALANCES INTERNAL IMBALANCES")
34
MIP Scoreboard 2014 34 http://ec.europa.eu/economy_finance/economic_governance/macroeconomic_imbalance_procedure/ mip_scoreboard/index_en.htm

35
Auxiliary indicators 35

36
36 Auxiliary indicators (2)
")
37
Renewed commitment to complementary structural reforms in the EU 37 Making the Single Market in goods & services a priority The Digital Single Market: essential for jobs, growth and innovation A resilient Energy Union with a forward-looking climate change policy Ensuring an EU regulatory framework supportive of jobs, growth & investment AT EU LEVEL AT MEMBER STATE LEVEL Improving labour market dynamics Pursuing pension reforms Modernising social protection Improving the flexibility of product & services markets Creating better conditions for business investment Strengthening the quality of R&D investment Boosting the efficiency of public administration

38
The Annual Growth Survey: Focus on jobs, growth and investment 38 INVESTMENT FISCAL RESPONSIBILITY STRUCTURAL REFORMS

39
Spring 2016 EU Economic Forecasts 39 Spring 2016 European Economic Forecast (3 May 2016)Spring 2016 European Economic Forecast Economic growth in Europe is expected to remain modest as key trading partners' performance has slowed and some of the so far supportive factors start to wane. GDP growth in the EU: from 2.0% last year to 1.8% in 2016 before reaching 1.9% in 2017 Very accommodative monetary policy has set the scene for a pick-up in investment by making access to funding easier and cheaper. Fiscal policy in the euro area is expected to be supportive of growth this year. But although oil prices fell again in early 2016 and prolonged the boost to real disposable incomes, the strength of this support should gradually fade as the oil price rebounds. Similarly, although euro area exports are still benefiting somewhat from the euro’s past depreciation, the currency’s recent rise could make the euro area more susceptible to the effects of slower external growth. Vice-President Valdis Dombrovskis, responsible for the Euro and Social Dialogue, said: "The economic recovery in Europe continues but the global context is less conducive than it was. Future growth will increasingly depend on the opportunities we create for ourselves. That means stepping up our structural reform efforts to address long-standing problems in many countries – high levels of public and private debt, vulnerabilities in the financial sector or declining competitiveness. A decisive policy action to reform and modernise our economies is the only way to ensure strong and sustainable growth, more jobs and good social conditions for our people."

40
Marco.Pellegrino@ec.europa.eu
41
Alcune riflessioni Previsioni di primavera pubblicate dalla Commissione: crescita leggera. Molti paesi in squilibrio. La Commissione, nell'ambito del MIP (Macroeconomic Imbalances Procedure) ha predisposto una «in-depth review» degli squilibri per 17 paesi, tra cui Italia, Francia, Germania, UK, Spagna, formulando alcune raccomandazioni. Rendere il sistema fiscale più equo ed efficiente. Le politiche fiscali durante la crisi sono state meno espansive, e sicuramente meno eque, di quanto si poteva (le imposte meno recessive sembrano essere quelle sulla casa, mentre le più recessive sono quelle sul lavoro). Migliorare la qualità della spesa pubblica. I paesi con più ampi margini di manovra fiscale dovrebbero adottare misure per incoraggiare la domanda interna. In tempi di bassa inflazione, la ripresa e il riequilibrio si allontanano e diventano più difficili.
 ha predisposto una «in-depth review» degli squilibri per 17 paesi, tra cui Italia, Francia, Germania, UK, Spagna, formulando alcune raccomandazioni. Rendere il sistema fiscale più equo ed efficiente. Le politiche fiscali durante la crisi sono state meno espansive, e sicuramente meno eque, di quanto si poteva (le imposte meno recessive sembrano essere quelle sulla casa, mentre le più recessive sono quelle sul lavoro). Migliorare la qualità della spesa pubblica. I paesi con più ampi margini di manovra fiscale dovrebbero adottare misure per incoraggiare la domanda interna. In tempi di bassa inflazione, la ripresa e il riequilibrio si allontanano e diventano più difficili..")
42
Real GDP growth, 2004-2014 (% change compared with the previous year)
")
43
Eurostat 43

44
Alcune riflessioni (2) Il «quantitative easing» è utile, ma da solo non basta. Effetto sul cambio (anticipato dai mercati) Effetto sui tassi di interesse (già bassissimi) Problema per l’Europa: la cinghia di trasmissione della politica monetaria all'economia reale è meno efficiente che negli USA Negli Usa: grandi aziende finanziate all’80% sul mercato finanziario. In Italia: piccole-medie imprese che ricevono l'80-90% del credito dalle banche. E’ necessario che le banche riducano i tassi e aumentino le erogazioni. All’Europa manca la seconda freccia: quella dei bilanci espansivi. USA: deficit federale passato dal 2,8% del 2007 al 12,4% del 2009. In Europa, invece, i bilanci statali si muovono nella direzione opposta.
 Effetto sui tassi di interesse (già bassissimi) Problema per l’Europa: la cinghia di trasmissione della politica monetaria all economia reale è meno efficiente che negli USA Negli Usa: grandi aziende finanziate all’80% sul mercato finanziario. In Italia: piccole-medie imprese che ricevono l 80-90% del credito dalle banche. E’ necessario che le banche riducano i tassi e aumentino le erogazioni. All’Europa manca la seconda freccia: quella dei bilanci espansivi. USA: deficit federale passato dal 2,8% del 2007 al 12,4% del In Europa, invece, i bilanci statali si muovono nella direzione opposta..")
45
45

46
Austerità: un nome, tanti significati L’austerità «stupida» L’austerità «conflittuale» L’austerità «espansiva» L’austerità del «buon governo» L’austerità «obbligata» Politica economica esile e finanza pubblica pesante (Romagnoli) Il momento giusto per l'austerità al Tesoro è l'espansione, non la recessione (J.M. Keynes, lettera al Presidente degli Stati Uniti Franklin D. Roosevelt, 1937) 46
 46.")
47
Keynes: The Return of the Master 47 J M Keynes understood better than most that the self-regulating market economy is a dangerous fiction. Has the crash of 2008 vindicated him? "At research seminars, people don't take Keynesian theorising seriously anymore; the audience starts to whisper and giggle to one another". So declared Robert Lucas of the University of Chicago, writing in 1980. At the time, Lucas was arguably the world's most influential macroeconomist; the influence of John Maynard Keynes, the British economist whose theory of recessions dominated economic policy for a generation after the Second World War, seemed to be virtually at an end. But Keynes, it turns out, is having the last giggle. Lucas's "rational expectations" theory has shown itself to be completely useless in the current world crisis. Not only does it offer no guide for action, but it more or less asserts that market economies cannot possibly experience the kind of problems they are, in fact, experiencing. Keynesian economics, on the other hand, which was created precisely to make sense of times like these, looks better than ever. Keynes: ”La nostra critica alla teoria economica classica accettata è consistita non tanto nel trovare difetti nella sua analisi quanto nell’indicare che le sue ipotesi implicite sono mai o quasi mai soddisfatte, con il risultato che essa non può risolvere i problemi economici attuali” (1936)
.")
48
EUTOPIA: Proposte per una moneta internazionale 48

49
[...] Sarebbe vano attendersi che "il tempo sia galantuomo": nel senso che colui il quale abbia visto giusto goda almeno la sterile soddisfazione di vedersene darne atto. Nella più recente politica economica [...] è infatti possibile rilevare un grado notevole di trasformismo, in forza del quale, ad un certo momento, tutti hanno detto o dicono le stesse cose. [...] Chi aveva tempestivamente fornito una indicazione valida, ma rimasta inascoltata, viene ora scavalcato dal vociare dei ritardatari che apportano ai raggiunti convincimenti un fervore a volte ingenuo, a volte arrogante. [...] Keynes aveva chiaramente posto in rilievo questa sequenza, osservando che "le idee che funzionari di stato e uomini politici e persino agitatori applicano agli avvenimenti correnti" sono, consapevolmente o meno, desunte dalle indicazioni "di qualche scribacchino accademico" di anni addietro. Federico Caffè, Un’economia in ritardo, Boringhieri, Torino, 1976
![[...] Sarebbe vano attendersi che il tempo sia galantuomo : nel senso che colui il quale abbia visto giusto goda almeno la sterile soddisfazione di vedersene darne atto.](http://images.slideplayer.it/36/10660842/slides/slide_49.jpg "Nella più recente politica economica [...] è infatti possibile rilevare un grado notevole di trasformismo, in forza del quale, ad un certo momento, tutti hanno detto o dicono le stesse cose. [...] Chi aveva tempestivamente fornito una indicazione valida, ma rimasta inascoltata, viene ora scavalcato dal vociare dei ritardatari che apportano ai raggiunti convincimenti un fervore a volte ingenuo, a volte arrogante. [...] Keynes aveva chiaramente posto in rilievo questa sequenza, osservando che le idee che funzionari di stato e uomini politici e persino agitatori applicano agli avvenimenti correnti sono, consapevolmente o meno, desunte dalle indicazioni di qualche scribacchino accademico di anni addietro. Federico Caffè, Un’economia in ritardo, Boringhieri, Torino,")
Presentazioni simili