Scaricare la presentazione
La presentazione è in caricamento. Aspetta per favore

1
Cyclone climatology - Cyclones and environment - Cyclone identification procedure - Storm tracks - NAO and North Atlantic storm track - Observed trend in the Mediterranean region - future scenarios - preliminary results from a new dataset

2
Cyclones and the environment

3
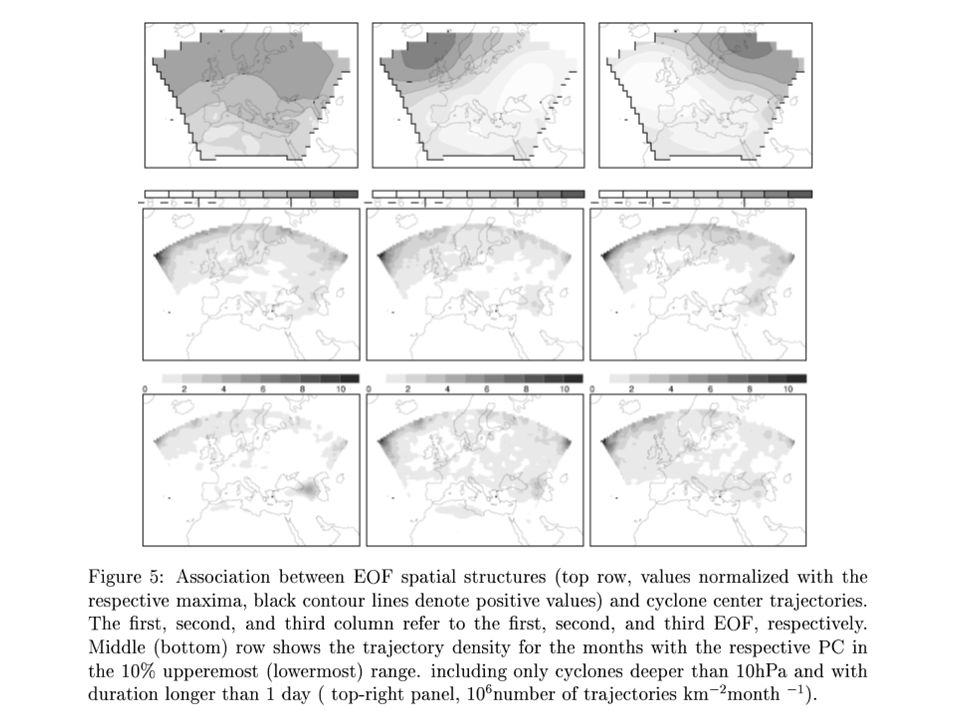
Most frequent location (elliptic area) of a cyclone in case of heavy rain in some western Mediterranean regions (isolated dot): From left to right and from up to down the locations here considered are a) SE France, b) Corsica, c) North Italy, d) Catalonia, e) Balearics, f) Sardinia, g) Valencia and h) Algeria, (from Jansà et al. 2001b). Cyclones and precipitation
. Cyclones and precipitation.")
4
Figure 6.9 Maps of the lagged correlation with the value in the point indicated by the dot for the 500hpa synoptic scale filtered geopotential height. This point is selected as a maximum of explained variance of the precipitation field associated to the EOF describing a moisture transport from western to eastern Mediterranean areas. The maps are meant to describe of the evolution of the cyclonic disturbances associated with such transport (From Fernandez et al. 2002)
.")
5
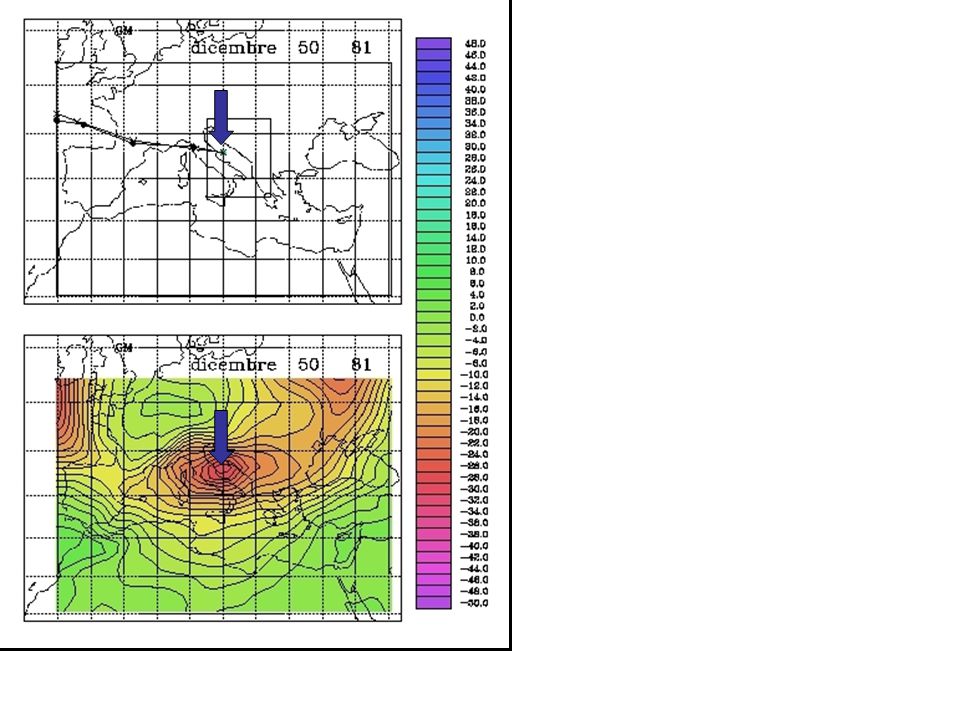
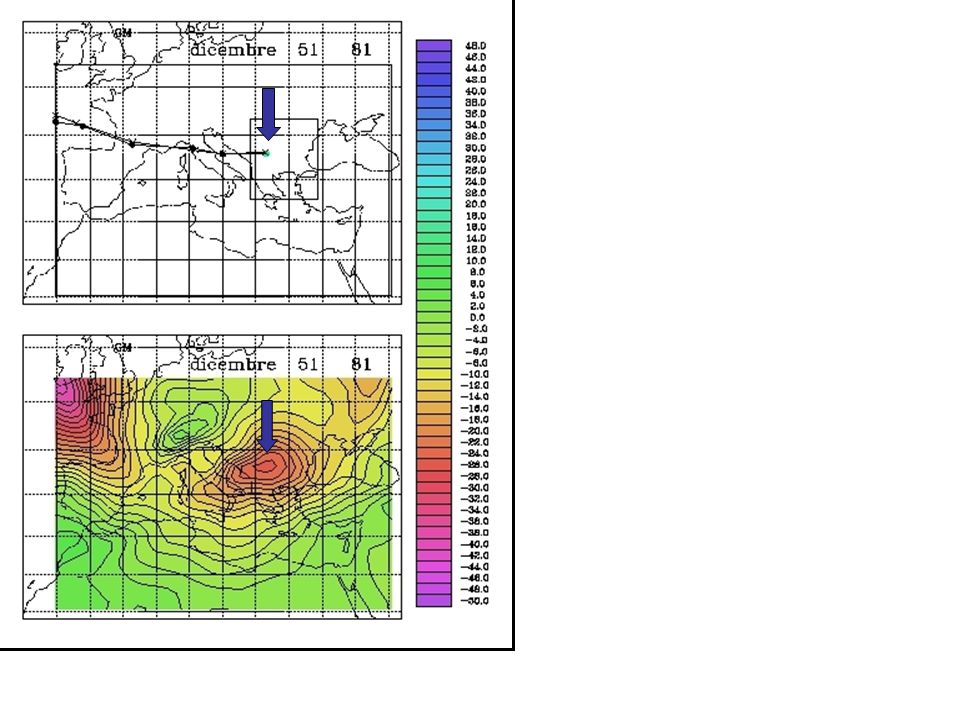
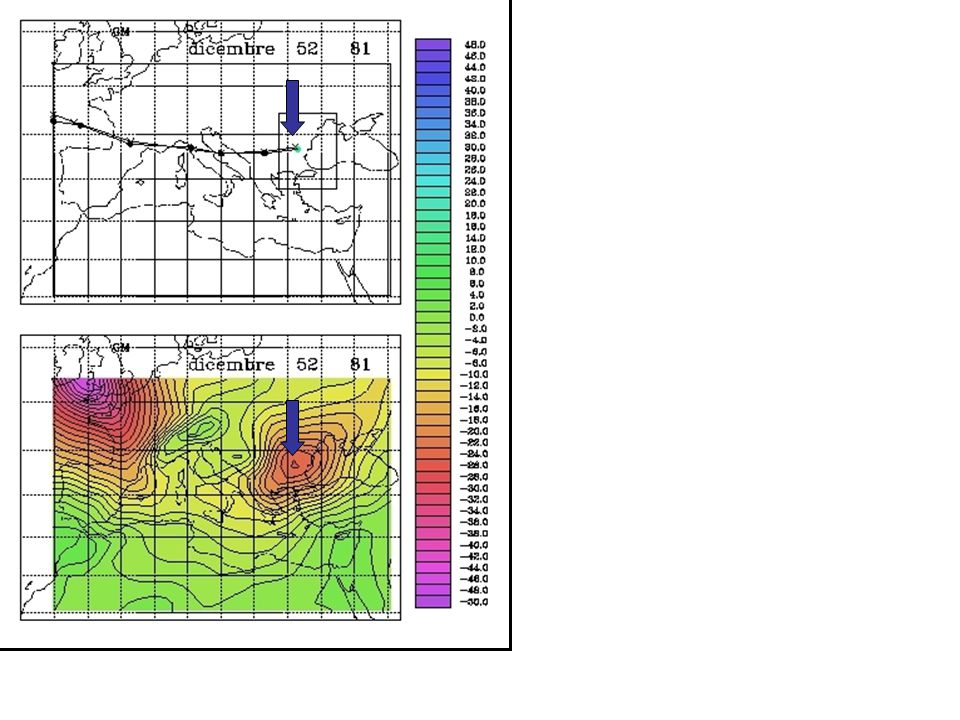
11 Evolution of the gph1000 field producing the storm surge in Venice. Panels a to e show the gph1000 composites (in hPa according to the greyscale bar) with a time lag of -48h, -24h, 0h, +24h, +48h with respect to the time of the surge peak. This situation is associated to a main minimum south of the Alps at the time of maximum surge (panel c). The composites are based on events with a peak surge value higher than 70 cm. (from Lionello, 2005) Cyclones and storm surge
 with a time lag of -48h, -24h, 0h, +24h, +48h with respect to the time of the surge peak. This situation is associated to a main minimum south of the Alps at the time of maximum surge (panel c). The composites are based on events with a peak surge value higher than 70 cm. (from Lionello, 2005) Cyclones and storm surge.")
6
Synoptic patterns associated with extreme significant wave height in different regions of the Mediterranean Sea: a) Tyrrenian b) Adriatic c) Balearic d) Ionian e) Levantine basin (from Lionello et al. 2006) Cyclones and ocean waves
 Cyclones and ocean waves.")
7
Identification of cyclones

8
Lagrange visual

9
SLP FIELD LOCAL MINIMA LOW PRESSURE SYSTEMS

15
Eulerian visual

16
GPH500: instantaneous field on 1st nov 1966 GPH500: HPF field (High Pass filtered field) on 1st nov 1966 HIGH PASS FILTER
 on 1st nov 1966 HIGH PASS FILTER")
17
HPF standard deviation Atlantic storm track

18
An example: Cyclones and NAO

19
NAO indexSLP AzoresSLP Iceland High NAO Index HPF st.dev composite Low NAO Index HPF st.dev composite Storm track variability associated with NAO extremes

20
HPF st.dev composite High-Low NAO Index GPH500 composite High-Low NAO Index Storm track variability pattern NAO dipole

21
high NAO index: storm trajectories composite low NAO index: storm trajectories composite How are individual storms related to the storm track variability pattern ? Only cyclones deeper than 100m

22
high NAO index: storm trajectories composite low NAO index: storm trajectories composite Distribution of cyclone according to depth How are individual storms related to the storm track variability pattern ? Only cyclones deeper than 100m threshold Number per month

23
Mediterranean region: present trends

24
Time series of average cyclone density (in units of percentage of systems/25 degree latitude squared) in winter (DJF) at boxes including nine grid points in the western Mediterranean centred at 10°W 40°N (western Mediterranean, left panel) and in the eastern Mediterranean centred at 35°W 35°N (eastern Levantine basin, right panel). The dashed lines denote the respective linear trends, in red, a smoothed curve is plotted using a Gaussian filter with a standard deviation of 3 years(After Bhend, 2005).
..")
25
Decadal relative changes in DJFM cyclone numbers, aggregated within 9ºx9º, and 10ºx10º grid boxes, for (a) ERA-40, and (b) NCEP/NCAR data, respectively. The solid (dashed) contours encircle areas with increasing (decreasing) storm numbers, during the 1959-2000 period. Boxes with significant trends, at less than the 10% level, are marked with, for positive, and with , for negative trends. [from Trigo, 2005]
 contours encircle areas with increasing (decreasing) storm numbers, during the period. Boxes with significant trends, at less than the 10% level, are marked with, for positive, and with , for negative trends. [from Trigo, 2005].")
26
Mediterranean region: future scenarios

27
Global simulation: 30-year long time slice experiment, IS92 scenario, 2xCO2 concentration

28
CUMULATED DISTRIBUTION CO2 CTR ERA CTR-CO2 CTR-ERA 40 15 T STUDENT’s 35 1535 2 CO2 presents a smaller number of cyclones From Lionello et al. 2002 CYCLONES in the Mediterranean region according to ECHAM (T106) 30-year long time slice experiment (2XCO 2 ) carried out at DMI Student’s t-test for ERA-15 vs CTR (solid line) and CO2 vs CTR (dashed line). Values above the horizontal pink line indicate that the 2 distributions can be considered different with a 95% confidence level.
 30-year long time slice experiment (2XCO 2 ) carried out at DMI Student’s t-test for ERA-15 vs CTR (solid line) and CO2 vs CTR (dashed line). Values above the horizontal pink line indicate that the 2 distributions can be considered different with a 95% confidence level..")
29
The MW-test is non parametric, meaning that it only requires that the deviations of two samples denoted as X i, i = 1,...,N X and Y j, j = 1,...,N Y, from the relative mean X i − and Y j − have the same distribution without assumption on its shape. The values X i and Y j assumed by the variable in the two samples are set in decreasing order and the rank R X of X is defined as the sum of the positions of the relative values in this list. Note that the higher rank corresponds to the sample with the lower values. It can be proven that the dimensionless variable has a gaussian distribution, with zero mean and unit variance if N X and N Y are large enough, which is true in this study in which 30 years are available. Practically, values of S X higher(lower) than +/ − 1.645 (shown by the horizontal lines in the right panels of figs.2 and of following similar figures) allows to conclude that the values X i are significantly lower/higher than Y j with a 95% confidence level. Mann-Whitney test
 than +/ − (shown by the horizontal lines in the right panels of figs.2 and of following similar figures) allows to conclude that the values X i are significantly lower/higher than Y j with a 95% confidence level. Mann-Whitney test.")
30
Top panel: Cumulative distribution, that is the average number of cyclones per year (y-axis) exceeding a given threshold (x- axis) for the CTR (dotted line), CO2 (dashed line), and ERA-15 (solid line) scenarios. Middle panel: Ranks of the CTR (dotted line) vs ERA-15 (solid line) data. The 2 distributions are different with a 95% confidence level for the depth values where the ranks of CTR and CO2 lie outside the range between the 2 thin horizontal dashed and solid lines, respectively. Bottom panel: As in Midde panel, but CTR (dotted line) vs CO2 (dashed line) is shown
 vs ERA-15 (solid line) data. The 2 distributions are different with a 95% confidence level for the depth values where the ranks of CTR and CO2 lie outside the range between the 2 thin horizontal dashed and solid lines, respectively. Bottom panel: As in Midde panel, but CTR (dotted line) vs CO2 (dashed line) is shown.")
31
EXTREME CYCLONES “TAIL” OF THE CUMULATED DISTRIBUTION scenariomax 100-year ERA CO252.1 64.2 3.4 44.6 53.1 3.3 CTR49.8 57.4 2.5 CO2 CTR ERA 3555 2 100-year 50.1 2.4 49.7 3.2 54.0 2.3 Strictly inside Med. region From Lionello et al. 2002

32
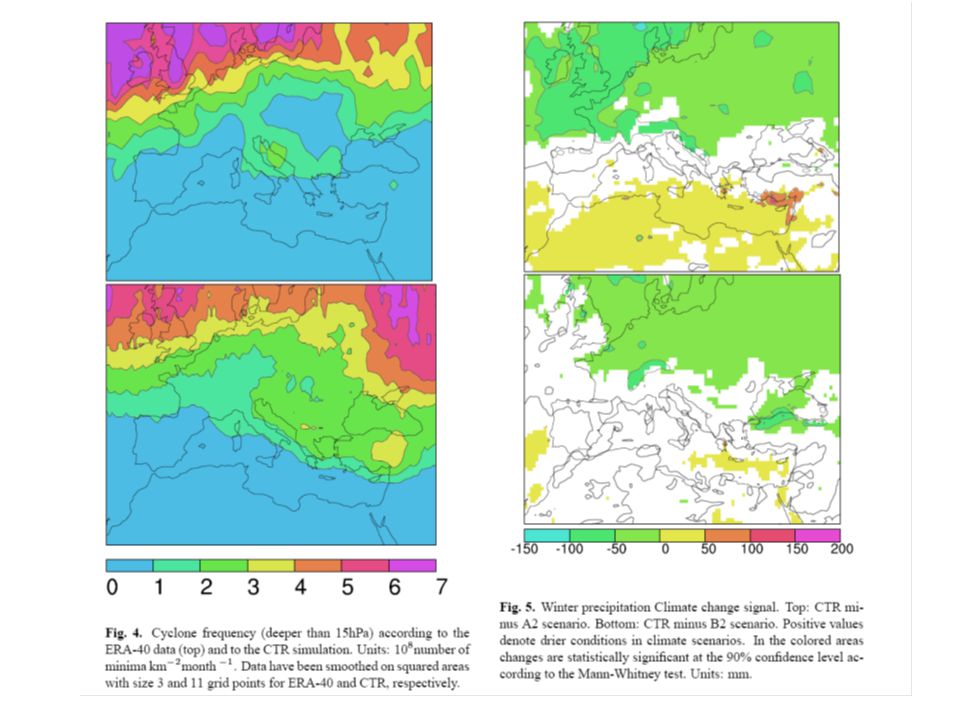
Analysis of cyclones in future scenario simulations carried out with the RegCM regional climate model at ICTP (Trieste, Italy) including the whole Mediterranean region. The simulations considers the A2 and B2 scenario beside a control (1960- 1990) simulation.
 simulation..")
33
RegCM experiment design Global Model: Hadley Centre HadAMH –Dx = 1.25 lat x 1.875 lon –SST from HadCM3 run –Coupled sulfur model Regional model: ICTP RegCM –Dx = 50 km –SST, GHG and sulfate from HadAMH –aerosol effects Simulation periods –1961-1990 : Reference run –2071-2100 : Scenario run Scenarios: A2, B2 Giorgi, F., X. Bi and J.S. Pal, 2004 a and b

34
Left panel: Average standard deviation (hPa) of the band-pass filtered (1 and 7-day cut off frequencies) SLP (Sea Level Pressure) field in the CTR simulation. Right panel: Average density of the cyclone centre trajectories in the CTR simulation

35
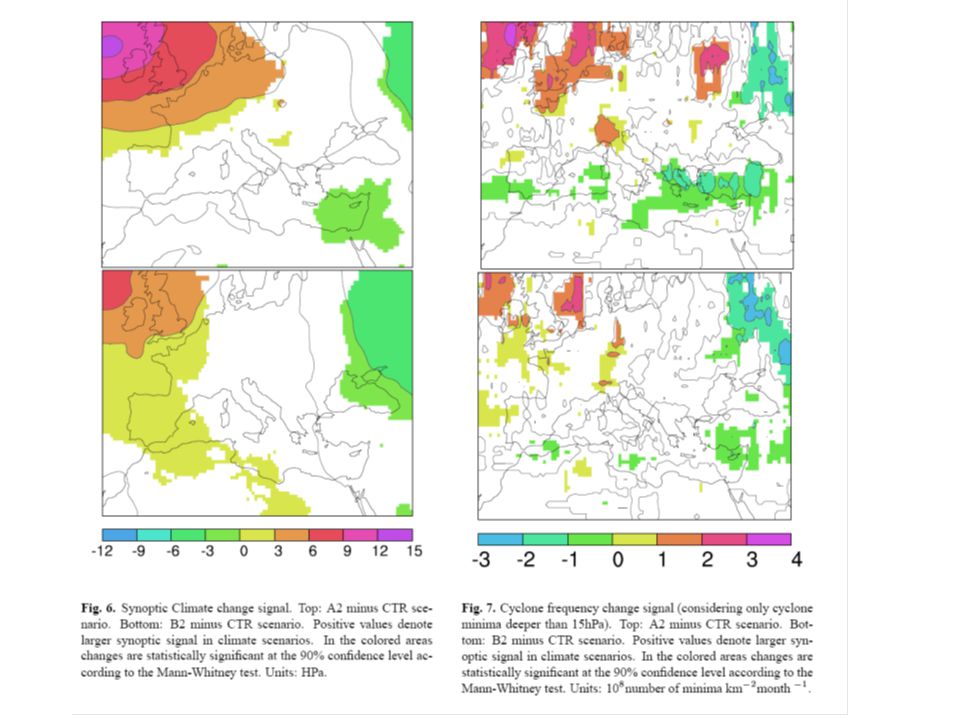
Average standard deviation of the band-pass filtered SLP field: differences A2-CTR (left) and B2-CTR (right). Positive values mean higher values in scenario simulations than in CTR. Differences are statistically significant in the coloured areas

36
JANFEBMARAPR MAYJUNJULAUG SEP OCTNOVDEC

37
JANFEBMARAPR MAYJUNJULAUG SEP OCTNOVDEC

38
Top-left panel: annual cycle of synoptic signal over the whole area. Middle-left panel: annual cycle of cyclone frequency Bottom-left Panel: annual cycle of synoptic signal normalized with the number of cyclones. Calendar months on the x-axis. The vertical bars are the respective standard deviation. Black, grey and dashed line refer to A2,B2, and CTR respectively. The right panels shows the results of the relative MW test. The horizontal lines mark the limit for the 95% confidence level.

39
Annual cycle of the monthly frequency of cyclones (left column) and MW test statistics (right column). Calendar months on the x-axis. Top and bottom rows consider cyclones with a maximum depth larger than 10hPa and 20hPa, respectively. Black, grey and dashed line refer to A2,B2, and CTR respectively

40
annual cycle of depth corresponding to the 50-year return time.

42
NEA RUS SCA CEM

43
annual cycle of synoptic signal (top panels, values in hPa), overall number of cyclones (middle panel, a 5hPa threshold has been used), number cyclone deeper than 20hPA (bottom panel) and respective MW test statistics (right column)} NEA region:
, overall number of cyclones (middle panel, a 5hPa threshold has been used), number cyclone deeper than 20hPA (bottom panel) and respective MW test statistics (right column)} NEA region:")
44
annual cycle of synoptic signal (top panels, values in hPa), overall number of cyclones (middle panel, a 5hPa threshold has been used), number cyclone deeper than 20hPA (bottom panel) and respective MW test statistics (right column)} CEM region:
, overall number of cyclones (middle panel, a 5hPa threshold has been used), number cyclone deeper than 20hPA (bottom panel) and respective MW test statistics (right column)} CEM region:")
45
the synoptic variability and the cyclone statistics in the SLP data produced by regional climate simulation for present day conditions (1961-1990) and future conditions (2071-2100) under forcing from the A2 and B2 IPCC emission scenarios have been analysed
 and future conditions ( ) under forcing from the A2 and B2 IPCC emission scenarios have been analysed")
46
The leading signal is found in the North European Atlantic region, where the synoptic signal in the A2 and B2 scenario simulations is significantly stronger from January to March and weaker during August than in the CTR simulation. These changes in the A2 and B2 runs compared to CTR are not reflected in the overall number of cyclones, which decreases for most of months, but are consistent with changes in intense cyclones, whose number decreases in August and September, and changes in the intensity of extremes, which increases in November and December.

47
For the rest of the European region the scenario simulations tend to produce a weaker synoptic signal than the CTR. An exception to this finding is July over Russia, where the signal is stronger in the scenario runs. The overall number of cyclones tendentially decreases everywhere, except for the Mediterranean in summer. Changes of extremes are rather noisy and are mostly suggestive of somewhat weaker extremes (with the exception of the NEA region).
..")
48
In summary, this study suggests that a winter intensification of cyclonic activity over northern and northeastern Europe and an attenuation of events over southern and eastern Europe are the general features to be expected in future climate conditions. These changes appears to be consistent with trends already detected during the second half of the 20th century.

54
Attività primo anno - Analisi statistica dei dati della rianalisi ERA-40 ECMWF di pressione a livello del mare e geopotenziale. - Classificazione dei cicloni mediterranei in base al loro percorso, all'intensità, alle caratteristiche fisiche e ai meccanismi di formazione. - Valutazione della variabilità e della presenza di tendenze nei cicloni delle varie classi identificate. - Analisi della possibile influenza delle principali strutture di circolazione globale sulla dinamica dei cicloni mediterranei: studio del legame tra NAO, SENA, SCAN, EA, EAWR e variabilità dei cicloni appartenenti alle varie classi, tramite analisi di correlazione, tecniche di analisi multivariata e di analisi spettrale. - Analisi statistica dei dati di scenari climatici globali forniti da ICTP, Trieste, eseguita con la medesima metodologia utilizzata per la rianalisi ERA-40. - Valutazione dell'impatto del cambiamento climatico globale sulla dinamica delle varie classi di cicloni mediterranei. -Calcolo dei campi di onde marine e di livello del mare (prima parte).
..")
55
Attività secondo anno - Calcolo dei campi di onde marine e livello del mare (seconda parte). - Identificazione di eventi estremi di precipitazione, onde marine e inondazioni costiere, verificatisi nel periodo coperto dai dati della rianalisi ERA-40. I dati saranno forniti da stazioni meteo, mareografiche, boe ondametriche e altimetri satellitari. - Analisi dei meccanismi che hanno determinato l'eccezionalità di tali eventi, tramite la valutazione del legame con la dinamica della circolazione su scala regionale. - Analisi delle strutture di circolazione responsabili degli eventi estremi e della dipendenza di questi ultimi dall'ubicazione e dall'intensità dell'evento. - Valutazione della possibilità di stabilire un legame tra strutture di circolazione atmosferiche a larga scala e alta probabilità di accadimento di eventi intensi. - Applicazione delle precedenti tecniche per valutare la probabilità di accadimento di eventi con valore superiore a prefissati valori di soglia.

56
Al termine dei due anni di attività previsti dal progetto saranno realizzati i prodotti di seguito elencati. - Mappe del numero di eventi di ciclogenesi manifestatisi nella regione mediterranea - Mappa del percorso dei cicloni, nella rianalisi negli scenari climatici futuri - Grafici rappresentativi della distribuzione statistica dei cicloni in funzione della loro intensità. - Realizzazione di un archivio in cui verranno riportati dati relativi ai cicloni dell'area mediterranea, ordinati cronologicamente, identificati in base all'analisi dei dati ERA40. - Realizzazione di un archivio degli eventi di acqua alta a Venezia - Realizzazione di un archivio di eventi di tempeste di onde marine - Produzione di grafici che evidenzino la presenza di tendenze nel numero di cicloni delle diverse classi. - Produzione di grafici che evidenzino la presenza di tendenze nel numero di eventi estremi di piogge intense, surge e tempeste di onde. -Realizzazione di mappe delle strutture di circolazione su larga scala cui i cicloni mediterranei sono associati

57
Il progetto si propone la stesura di due relazioni: - Da cosa è determinata la variabilità dell'attività ciclonica su scala regionale nell'area mediterranea? Qual è il suo legame con le strutture di circolazione atmosferica su larga scala? Analisi degli ultimi 50 anni e tentativi di valutazione del loro comportamento per scenari climatici futuri. - Qual è il legame tra eventi meteorologici estremi e/o intensi responsabili per precipitazioni, inondazioni, mareggiate, tempeste marine e l'attività ciclonica nell'area mediterranea? Quali sono i meccanismi coinvolti? Analisi degli ultimi 50 anni e valutazione del loro comportamento per scenari climatici futuri.

Presentazioni simili


 devices receive FDA approval annually 3500 medium-risk (class II) products are approved for marketing.>")


 proposed that the flux-based indicators should be included in the.>")
