Scaricare la presentazione
La presentazione è in caricamento. Aspetta per favore

1
Scenari di penetrazione dell’auto elettrica
Romeo Danielis, Andrea Rusich, Eva Valeri DEAMS, Università degli Studi di Trieste

2
Sommario Emissioni di CO2
Una stima dei costi privati e sociali per l’Italia Simulazioni Il mercato dell’auto elettrica e ibrida Analisi della domanda e di scenari alternativi per l’Italia

3
Auto elettrica: diversi gradi di elettrificazione

4
Quale automobile inquina di meno? A livello globale? A livello locale?

5
Uno studio per l’Austrialia
Ford Falcon: class-E sedan, the 4-litre, 6-cylinder, 1800 kg Ford Fiesta ECOnetic : 1.6 litre, inline 4 cylinder, diesel Sharma, R., Manzie, C., Bessede, M., Brear, M.J., Crawford, M.H. (2012), “Conventional, hybrid and electric vehicles for Australian driving conditions – Part 1: Technical and financial analysis”, Transportation Research Part C, 25, pp
, Conventional, hybrid and electric vehicles for Australian driving conditions – Part 1: Technical and financial analysis , Transportation Research Part C, 25, pp")
6
Emissioni lifecycle di CO2: energy mix australiano
In Classe-E le convenzionali (CV) sono inferiori alle elettriche (BEV), in Classe-E vale l’incontrario Tutte le Classe-E emettono molto di più di quelle in classe B: downsizing
 sono inferiori alle elettriche (BEV), in Classe-E vale l’incontrario. Tutte le Classe-E emettono molto di più di quelle in classe B: downsizing.")
7
Le emissioni di CO2 dipendono in modo cruciale da come è prodotta l’energia elettrica
Vehicle Model Benchmark Low carbon Class-E CV 61.5 54.1 Mild 56.3 48.8 Parallel 42.5 34.9 Series 41.7 34.1 Plug-in 51.1 23.4 BEV 51.2 20.6 Class-B 26.6 21.8 31.1 12.2 Vehicle life cycle emissions (in tonnes of CO2-e) for different emission intensity, fuel consumption, electricity consumption and tailpipe emission scenarios.
 for different emission intensity, fuel consumption, electricity consumption and tailpipe emission scenarios.")
8
Una stima dei costi privati e ambientali per l’Italia (Working paper SIET)
Costi privati: costo d’acquisto, incentivo, bollo, assicurazione, manutenzione, carburante Costi sociali: emissione di CO2, NOx, SOx, VOC, PM, rumore Consumo energetico: Assunzioni: vari chilometraggi annuali, 5 o 10 anni di uso del veicolo, 80% percorsi urbani

9
Modelli considerati: 7 WV Polo 1.4 comfortline benz.
Ford Fiesta – Ikon 1.4 TDCI Fiat Punto Natural Power 1.4 easy bi-fuel benz-metano Alfa Romeo Mito 1.4t bi-fuel benz-GPL

10
Modelli considerati: 7 Toyota Yaris Hybrid 1.5 Lounge
Peugeot iOn Full Electric Renault Zoe Full Electric, leased batteries

11
Costi privati per 10.000 km per 5 anni
VW Polo (Gasoline) Ford Fiesta (diesel Fiat Punto (bi-fuel CNG) Alfa R. MiTo (bi-fuel LPG) Toyota Yaris (Hybrid) Peugeot iOn (BEV) Renault Zoe (L_BEV) Spesa acquisto veicolo 15.060 14.750 17.250 20.600 17.800 28.318 21.650 Spesa carburante 1.353 838 1.073 1.167 627 194 191 Costo per km 0,27 0,22 0,24 0,26 0,20 0,13 Spesa operativ. annuale 2.715 2.172 2.420 2.595 2.017 1.261 2.206 Costo totale attualizzato 27.402 24.624 28.252 32.398 26.971 34.051 31.677 Ranking 3 1 4 6 2 7 5
 Ford Fiesta. (diesel. Fiat Punto. (bi-fuel CNG) Alfa R. MiTo. (bi-fuel LPG) Toyota Yaris. (Hybrid) Peugeot iOn. (BEV) Renault Zoe. (L_BEV) Spesa acquisto veicolo Spesa carburante Costo per km. 0,27. 0,22. 0,24. 0,26. 0,20. 0,13. Spesa operativ. annuale Costo totale attualizzato Ranking")
12
Costi sociali da inquinamento globale (per 10.000 km per 5 anni)
Table - Global pollution costs for the Green House Gases (CO2) – values in 2010 €. VW Polo (Gasoline) Ford Fiesta (Diesel) Fiat Punto (bi-fuel CNG) Alfa R. MiTo (bi-fuel LPG) Toyota Yaris (Hybrid) Peugeot iOn (BEV) Renault Zoe (L_BEV) WtT GHG 27 29 30 23 171 TtW GHG 159 149 123 136 WtW 186 178 153 160 WtT = Well-to-tank (dal pozzo al serbatoio) TtW = Tank-to-Wheels (dal serbatoio alle ruote) WtW = Well-to-Wheels (dal pozzo alle ruote)
 – values in 2010 €. VW Polo. (Gasoline) Ford Fiesta. (Diesel) Fiat Punto. (bi-fuel CNG) Alfa R. MiTo. (bi-fuel LPG) Toyota Yaris. (Hybrid) Peugeot iOn. (BEV) Renault Zoe. (L_BEV) WtT GHG TtW GHG WtW WtT = Well-to-tank (dal pozzo al serbatoio) TtW = Tank-to-Wheels (dal serbatoio alle ruote) WtW = Well-to-Wheels (dal pozzo alle ruote)")
13
Costi da inquinamento locale
VW Polo (Gasoline) Ford Fiesta (Diesel) Fiat Punto (bi-fuel CNG) Alfa R. MiTo (bi-fuel LPG) Toyota Yaris (Hybrid) Peugeot iOn (BEV) Renault Zoe (L_BEV) WtT NOX 34,3 27,5 8,9 29,6 132,7 WtT PM\ rural 11,8 5,5 5,8 10,1 27,6 WtT PM urban 20,9 9,8 10,4 18,0 49,0 WtT SOX 50,1 41,3 12,6 43,2 157,0 TtW NOX 25,9 77,7 22,5 0,0 TtW PM metrop. 85,4 68,3 TtW PM urban 22,1 TtW PM rural 15,5 12,4 TtW SOX 0,4 WtT = Well-to-tank (dal pozzo al serbatoio) TtW = Tank-to-Wheels (dal serbatoio alle ruote) WtW = Well-to-Wheels (dal pozzo alle ruote)
 Ford Fiesta. (Diesel) Fiat Punto. (bi-fuel CNG) Alfa R. MiTo. (bi-fuel LPG) Toyota Yaris. (Hybrid) Peugeot iOn. (BEV) Renault Zoe. (L_BEV) WtT NOX. 34,3. 27,5. 8,9. 29,6. 132,7. WtT PM\ rural. 11,8. 5,5. 5,8. 10,1. 27,6. WtT PM urban. 20,9. 9,8. 10,4. 18,0. 49,0. WtT SOX. 50,1. 41,3. 12,6. 43,2. 157,0. TtW NOX. 25,9. 77,7. 22,5. 0,0. TtW PM metrop. 85,4. 68,3. TtW PM urban. 22,1. TtW PM rural. 15,5. 12,4. TtW SOX. 0,4. WtT = Well-to-tank (dal pozzo al serbatoio) TtW = Tank-to-Wheels (dal serbatoio alle ruote) WtW = Well-to-Wheels (dal pozzo alle ruote)")
14
Stime: costi sociali da rumore
VW Polo (Gasoline) Ford Fiesta (Diesel) Fiat Punto (bi-fuel CNG) Alfa R. MiTo (bi-fuel LPG) Toyota Yaris (Hybrid) Peugeot iOn (BEV) Renault Zoe (L_BEV) Noise Cost 153 122 15
 Ford Fiesta. (Diesel) Fiat Punto. (bi-fuel CNG) Alfa R. MiTo. (bi-fuel LPG) Toyota Yaris. (Hybrid) Peugeot iOn. (BEV) Renault Zoe. (L_BEV) Noise Cost")
15
Conclusioni Among the 7 cars compared, the diesel Ford Fiesta currently performs the best from the private and social cost as well as energy consumption point of view. From the social point of view, which includes greenhouse gas, local pollution and noise both the Toyota Yaris (Hybrid) and the Alfa R. MiTo (bi-fuel LPG) perform as well as the BEVs, and the absolute difference with the conventional fuel cars is quite small. Given the large number of cars, at city or nation level, however, these differences could make up to million euros. Of course, the BEVs have their strong point in the zero emissions levels in the car use phase, where the health related costs of air pollution are presumably higher. From an energy-saving point of view, with the current mix, the BEVs are the worst performing cars and the Toyota Yaris (Hybrid) is the best performing one.
 and the Alfa R. MiTo (bi-fuel LPG) perform as well as the BEVs, and the absolute difference with the conventional fuel cars is quite small. Given the large number of cars, at city or nation level, however, these differences could make up to million euros. Of course, the BEVs have their strong point in the zero emissions levels in the car use phase, where the health related costs of air pollution are presumably higher. From an energy-saving point of view, with the current mix, the BEVs are the worst performing cars and the Toyota Yaris (Hybrid) is the best performing one.")
16
Il costo totale: scenari di valutazione

17
AUMENTO DELLA DISTANZA MEDIA ANNUA PERCORSA

18
AUMENTO DEL TEMPO DI UTILIZZO DELL’AUTOMOBILE

19
AUMENTO DEL PREZZO DEI CARBURANTI CONVENZIONALI
ASSUNZIONI: 5 anni di utilizzo e km/anno

20
AUMENTO DEL PREZZO DEI CARBURANTI CONVENZIONALI
ASSUNZIONI: 10 anni di utilizzo e km/anno

21
RIDUZIONE DEL COSTO DI PRODUZIONE DELLE BATTERIE
ASSUNZIONI: 5 anni di utilizzo e km/anno

22
RIDUZIONE DEL COSTO DI PRODUZIONE DELLE BATTERIE
ASSUNZIONI: 10 anni di utilizzo e km/anno

23
SUSSIDI ITALIANI 2013 PER AUTO MENO INQUINANTI
ASSUNZIONE: 5 anni di utilizzo

24
SUSSIDI ITALIANI 2013 PER AUTO MENO INQUINANTI
ASSUNZIONE: 10 anni di utilizzo

25
Conclusioni Assuming that a car is kept 5 years, when 5,000 km per year are driven, the diesel Ford Fiesta is the cheapest choice, followed by the gasoline VW Polo. The BEVs are the most expensive. The Hybrid Toyota Yaris becomes the second cheapest car when about 9,000 km per year are driven. The BEVs improve their relative ranking (becoming third and fourth cheapest) when 15,000 or more km per year are driven. Assuming that a car is driven 10,000 km per year are driven, increasing the number of years that a car is kept makes the BEV Peugeot iOn more competitive, thanks to the lower operative costs: it becomes the forth cheapest car. Assuming that a car is kept 5 years, the subsidies enacted by the Italian government improves the relative ranking of the less polluting cars. The Hybrid Toyota Yaris overcomes the diesel Ford Fiesta as the cheapest cars when more than about 12,500 km are driven, with the BEVs becoming competitive when 20,000 km are driven. This trend is obviously reinforced when a car is kept 10 years. If gasoline and diesel prices are increased by 10% and 20%, the relative ranking does not drastically changed assuming that a car is kept 5 years, while the relative cost differences are rather altered when a car is kept 10 years. If, as forecasted by McKinsey, the battery costs decrease from the current 450 €/kWh to 160 €/kWh or to 130 €/kWh, the BEVs would become very competitive. If a car is kept 10 years, they would be the cheapest ones. These results are focused on the financial aspects of a car choice, more specifically on the total (private + social) cost. Of course, they are by no means the only variables that determine the selection of a car: cultural factors, the car appearance and driving style being other important determinants. When the BEVs are considered, “range anxiety”, the use of the car as the first or second car, the existence of a (fast) charging infrastructure, potential favorable parking or access regulations together with environmental attitudes are known as further important co-determinants of the choice of a BEV, together with the financial factors.
 when 15,000 or more km per year are driven. Assuming that a car is driven 10,000 km per year are driven, increasing the number of years that a car is kept makes the BEV Peugeot iOn more competitive, thanks to the lower operative costs: it becomes the forth cheapest car. Assuming that a car is kept 5 years, the subsidies enacted by the Italian government improves the relative ranking of the less polluting cars. The Hybrid Toyota Yaris overcomes the diesel Ford Fiesta as the cheapest cars when more than about 12,500 km are driven, with the BEVs becoming competitive when 20,000 km are driven. This trend is obviously reinforced when a car is kept 10 years. If gasoline and diesel prices are increased by 10% and 20%, the relative ranking does not drastically changed assuming that a car is kept 5 years, while the relative cost differences are rather altered when a car is kept 10 years. If, as forecasted by McKinsey, the battery costs decrease from the current 450 €/kWh to 160 €/kWh or to 130 €/kWh, the BEVs would become very competitive. If a car is kept 10 years, they would be the cheapest ones. These results are focused on the financial aspects of a car choice, more specifically on the total (private + social) cost. Of course, they are by no means the only variables that determine the selection of a car: cultural factors, the car appearance and driving style being other important determinants. When the BEVs are considered, range anxiety , the use of the car as the first or second car, the existence of a (fast) charging infrastructure, potential favorable parking or access regulations together with environmental attitudes are known as further important co-determinants of the choice of a BEV, together with the financial factors.")
26
La situazione attuale nel mondo
Highway capable electric vehicles Hybrid electric vehicles USA As of December 2012, around 27,000 all-electric cars have been sold in the U.S. since 2008 A total of 434,498 hybrid electric vehicles were sold during 2012, and the hybrid market share of total new car sales was 3.0% Francia Since January 2010, more than 14,600 highway-capable all-electric vehicles have been registered through December 2012. Giappone Since July 2009, more than 28,000 all-electric cars have been sold in Japan through December 2012, a market share of 0.16% of total new car sales in the country In May 2012, hybrid sales reached a record market share of 19.7% of new car sales in the country, including kei cars. Norvegia Norway, with 10,005 plug-in electric cars registered through December 2012, a 3.1% market share of passenger car sales in the country. Germania A total of 7,497 electric cars have sold in Germany since January 2010 through December 2012. Netherlands As of December 2012, the fleet of electric cars in the Netherlands reached 6,275 highway-capable plug-in electric passenger vehicles (1%) United Kingdom More than 4,415 electric-drive cars have been registered in the UK through December 2012. Italia Immatricolate 2012: 560 Immatricolate nel 2012: 6,730
 United Kingdom. More than 4,415 electric-drive cars have been registered in the UK through December Italia. Immatricolate 2012: 560. Immatricolate nel 2012: 6,730.")
27
Le immatricolazioni per alimentazione in Italia

28
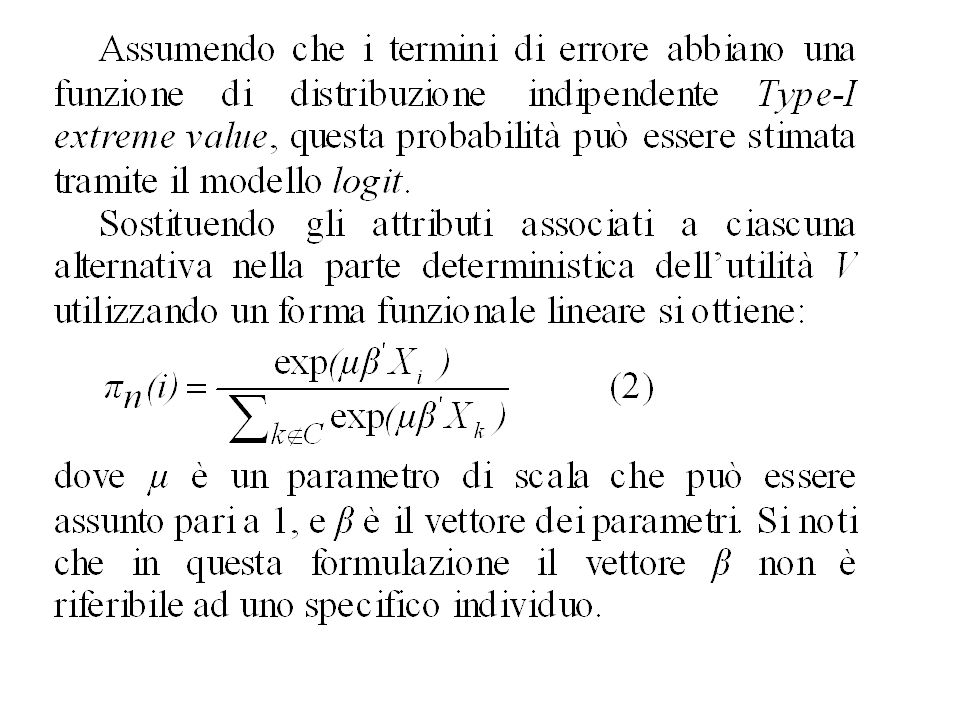
Una stima della domanda per l’Italia tramite interviste dirette sulla scelta ipotetica
Metodologia: indagine di preferenza dichiarata, modello di domanda a scelta discreta (modello logit a parametri causali), simulazione Montecarlo Determinanti del modello: costo del veicolo, costo del carburante (elettricità), autonomia, distanza dal distributore, accelerazione 121 intervistati (FVG; Slovenia, Bologna, Marche)
, simulazione Montecarlo. Determinanti del modello: costo del veicolo, costo del carburante (elettricità), autonomia, distanza dal distributore, accelerazione. 121 intervistati (FVG; Slovenia, Bologna, Marche)")
29
Una stima della domanda per l’Italia tramite interviste dirette sulla scelta ipotetica

30
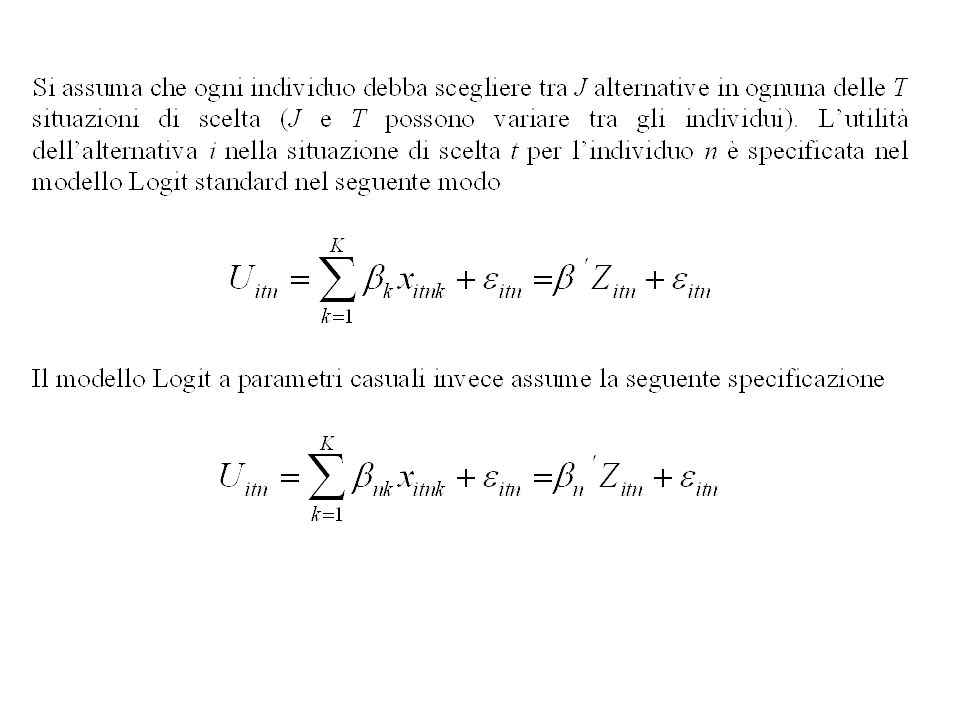
Il modello a scelta discreta di base

32
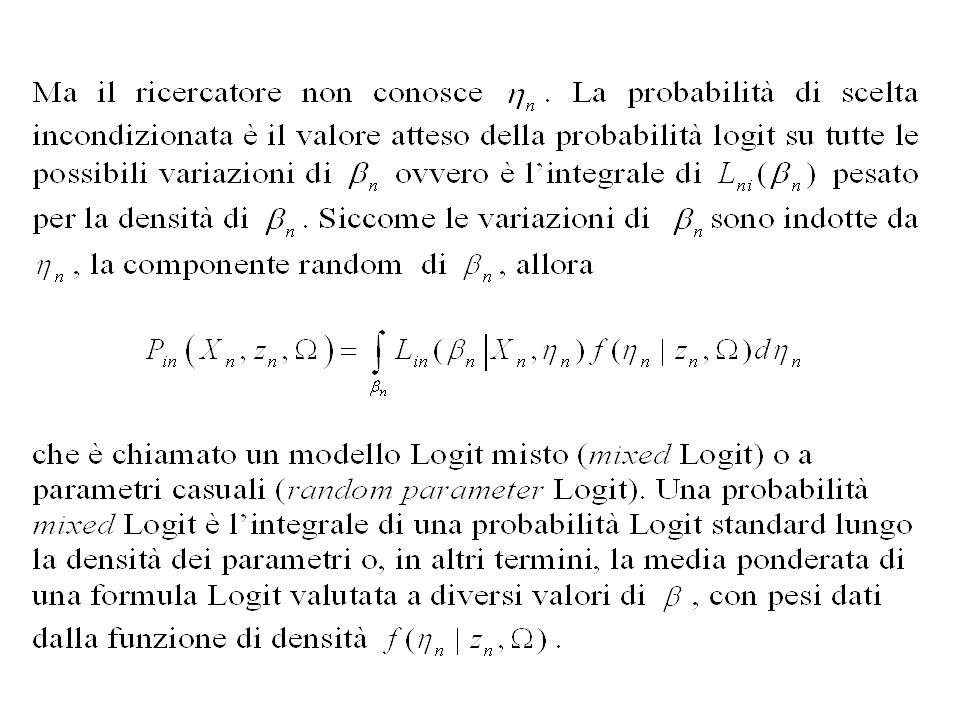
Il modello logit a parametri casuali

36
Lower triangular matrix: the upper off-diagonal elements of the matrix are all zero

37
Matrice di decomposizione di Choleski

39
Soluzione del modello ML

41
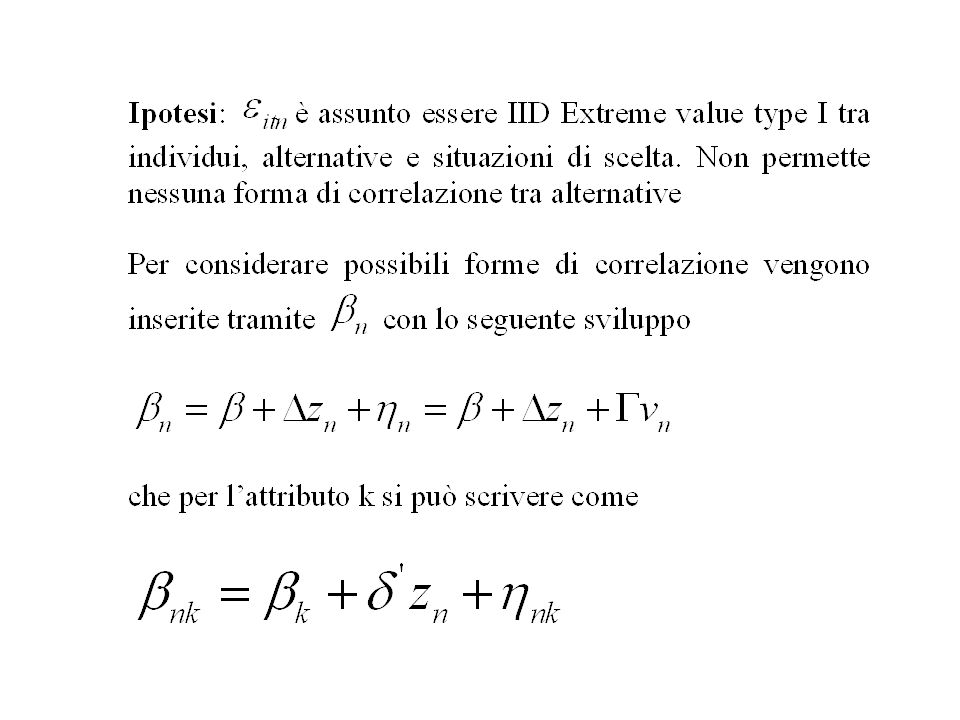
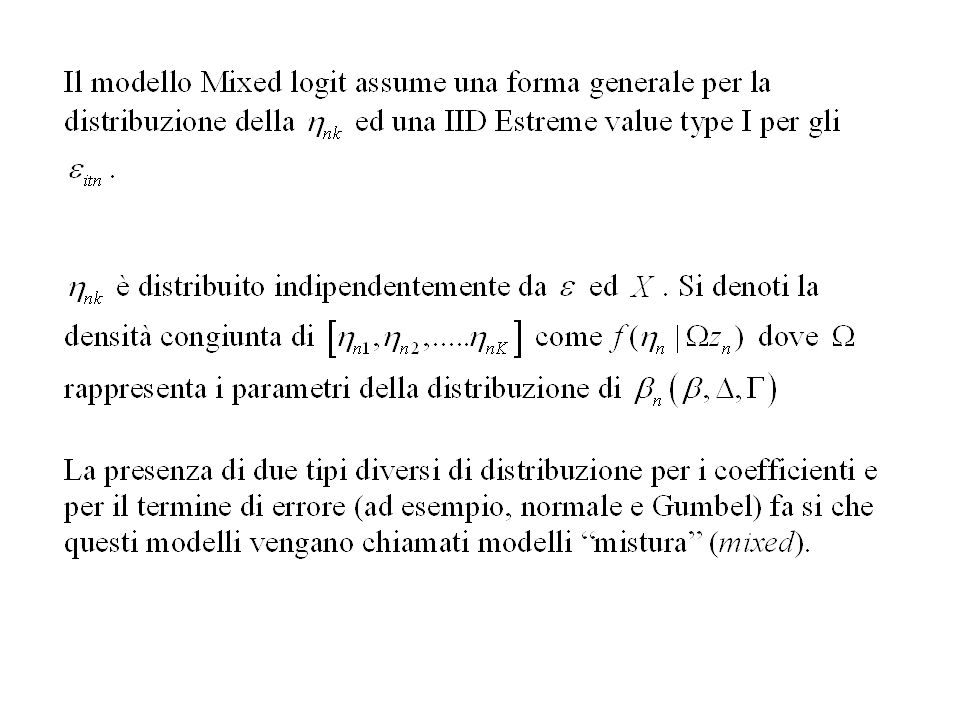
Proprietà del modello RPL o ML
Il modello Mixed logit non ha la proprietà IIA (independence of irrelevant alternatives) Permette diversi rapporti di sostituzione attraverso appropriate specificazioni di della funzione di densità di
 Permette diversi rapporti di sostituzione attraverso appropriate specificazioni di della funzione di densità di.")
42
Stima tramite metodi di simulazione

43
Stima del modello RPL (triangolare vincolata)
Attributi Coeff. t-ratio Prezzo d’acquisto (1000€) -0.540 Costo al km all’anno (1000€) -4.678 Autonomia (1000 km) 4.814 9.365 Distanza dal distributore -0.019 -5.769 Benzina -0.069 -0.231 Accelerazione (sec per 100 km/h) 0.024 0.949 Diesel 0.268 0.763 BI-Metano 0.247 0.757 Bi- GPL 0.377 1.013 Ibrida 0.051 0.155 Elettrica con batt -0.642 -2.242 Spread Triang. PREZZO 0.540 12.639 TsCOSTO 4.678 12.336 TsAUT TsDISTR 0.019 5.769
 Costo al km all’anno (1000€) Autonomia (1000 km) Distanza dal distributore Benzina Accelerazione (sec per 100 km/h) Diesel BI-Metano Bi- GPL Ibrida Elettrica con batt Spread Triang. PREZZO TsCOSTO TsAUT. TsDISTR")
44
Stima del modello RPL (triangolare vincolata)
Coeff. t-ratio Prezzo: Reddito 0.114 2.655 Prezzo: Femmina -0.024 -0.733 Prezzo: N° Auto>=2 0.079 1.849 Prezzo: N° viaggi più 400km>=4 0.025 0.451 Prezzo: Senza Box auto 0.082 2.956 Costo: Reddito 1.277 3.248 Costo: Femmina 0.828 3.094 Costo: N° Auto>=2 -0.731 -1.918 Costo: N° viaggi più 400km>=4 0.427 1.045 Costo: Senza Box auto 0.879 3.599 Autonomia: Reddito -0.566 -1.123 Autonomia: Femmina -2.097 -5.285 Autonomia: N° Auto>=2 0.804 1.526 Autonomia: N° viaggi più 400km>=4 0.309 0.621 Autonomia: Senza Box auto -0.527 -1.699 Adjusted Rho no coeffients: 0,30, osservazioni: 1452 (121 rispondenti per 12 scenari)
")
45
Il modello di simulazione
Input: X = attributi delle 7 automobili Z = socio-economiche Coefficienti: Beta = Media e spread della distribuzione triangolare simmetrica vincolata (media=spread) per le variabili casuali (prezzo d’acquisto, costo annuale al km, autonomia, distanza dal distributore) Per ogni segmento campionario estrazioni casuali dalle distribuzioni (Montecarlo) Confronto tra le utilità sistematiche delle 7 automobili % di volte che un auto è la migliore (utilità sistematica maggiore) % di volte che un auto è la 2° migliore ( 2° utilità sistematica maggiore) % di volte che un auto è la 3° migliore ( 3° utilità sistematica maggiore) Riporto all’universo dei segmento campionari sulla base della loro rappresentatività
 per le variabili casuali (prezzo d’acquisto, costo annuale al km, autonomia, distanza dal distributore) Per ogni segmento campionario estrazioni casuali dalle distribuzioni (Montecarlo) Confronto tra le utilità sistematiche delle 7 automobili. % di volte che un auto è la migliore (utilità sistematica maggiore) % di volte che un auto è la 2° migliore ( 2° utilità sistematica maggiore) % di volte che un auto è la 3° migliore ( 3° utilità sistematica maggiore) Riporto all’universo dei segmento campionari sulla base della loro rappresentatività.")
46
Domanda di mercato ipotetica: status quo
Prezzo Costo di gestione Autonomi a in km Acceleraz. , 0-100 in sec. Distanz a distrib. in km Quota stimata di mercato, (1° scelta) % (2° scelta) % (3° scelta) Benzina 15.060 2.715 900 13 1 0,5 7,3 37,6 Diesel 14.750 2.172 980 15 72,9 17,5 8,2 Metano 17.250 2.420 800 5 14,9 GPL 20.600 2.595 1200 1,4 1,0 16,3 Ibrida 17.800 2.017 1000 18,6 71,6 8,4 Elettrica 28.318 1.261 150 12 6,5 1,9 13,6 Elettrica con batt.nol. 21.650 2.205 210 0,6 1,1
 % (2° scelta) % (3° scelta) Benzina ,5. 7,3. 37,6. Diesel ,9. 17,5. 8,2. Metano ,9. GPL ,4. 1,0. 16,3. Ibrida ,6. 71,6. 8,4. Elettrica ,5. 1,9. 13,6. Elettrica con batt.nol ,6. 1,1.")
47
Domanda di mercato ipotetica: contributo statale
Modello Prezzo base, € Incentivo, € Prezzo scontato, € Quota stimata di mercato, (1° scelta) % (2° scelta) % (3° scelta) Benzina 15.060 - 0,1 0,4 37,6 Diesel 14.750 2.000 12.750 39,4 47,5 11,2 Metano 17.250 1,2 GPL 20.600 0,7 14,1 Ibrida 17.800 3.560 14.240 52 1,3 Elettrica 28.318 5.000 23.318 8,3 3,1 24,6 Elettrica batt.noleg. 21.650 4.330 17.320 9,9 Eberhard and Tarpenning
 % (2° scelta) % (3° scelta) Benzina ,1. 0,4. 37,6. Diesel ,4. 47,5. 11,2. Metano ,2. GPL ,7. 14,1. Ibrida ,3. Elettrica ,3. 3,1. 24,6. Elettrica batt.noleg ,9. Eberhard and Tarpenning.")
48
Quota stimata di mercato,
Domanda di mercato ipotetica: contributo statale e aumento (x3) dell'autonomia dei veicoli elettrici Modello Prezzo, € Autono mia, Km Quota stimata di mercato, (1° scelta) % (2° scelta) % (3° scelta) Benzina 15.060 900 0,1 0,4 19,9 Diesel 12.750 980 39,4 42,4 15,3 Metano 17.250 800 GPL 20.600 1200 1,2 0,6 8 Ibrida 14.240 46,9 51,8 1,1 Elettrica 23.318 360 12,4 4,3 22,0 Elettrica con batt.noleg. 17.320 630 0,5 32,3
 dell autonomia dei veicoli elettrici. Modello. Prezzo, € Autono mia, Km. Quota stimata di mercato, (1° scelta) % (2° scelta) % (3° scelta) Benzina ,1. 0,4. 19,9. Diesel ,4. 42,4. 15,3. Metano GPL ,2. 0,6. 8. Ibrida ,9. 51,8. 1,1. Elettrica ,4. 4,3. 22,0. Elettrica con batt.noleg ,5. 32,3.")
49
Nuovo costo di gestione, € Quota stimata di mercato,
Domanda di mercato ipotetica: contributo e aumento del prezzo dei carburanti fossili Modello Prezzo, € Costo di gestione, € Nuovo costo di gestione, € Quota stimata di mercato, (1° scelta) % (2° scelta) % (3° scelta) Benzina 15.060 2.715 3.258 0,1 0,4 18,3 Diesel 12.750 2.172 2.606 29,9 40,5 14,4 Metano 17.250 2.420 2.904 GPL 20.600 2.595 3.114 0,9 0,5 8,5 Ibrida 14.240 2.017 44,8 43,9 10,8 Elettrica 23.318 1.261 22,8 5,2 18,1 Elettrica con batt.noleg. 17.320 2.205 1,4 9,4 28,7
 % (2° scelta) % (3° scelta) Benzina ,1. 0,4. 18,3. Diesel ,9. 40,5. 14,4. Metano GPL ,9. 0,5. 8,5. Ibrida ,8. 43,9. 10,8. Elettrica ,8. 5,2. 18,1. Elettrica con batt.noleg ,4. 9,4. 28,7.")
50
Quota stimata di mercato,
Domanda di mercato ipotetica: Contributo statale e diminuzione di 5.000€ del prezzo dei VE Modello Prezzo iniziale, € Prezzo finale, € Quota stimata di mercato, (1° scelta) % (2° scelta) % (3° scelta) Benzina 15.060 0,1 0,3 10,3 Diesel 14.750 12.750 33,8 41,7 17,5 Metano 17.250 GPL 20.600 1,2 0,8 11 Ibrida 17.800 14.240 42,5 45 10,2 Elettrica 28.318 18.318 16,8 5,8 21,2 Elettrica con batt.noleg. 21.650 12.320 5,6 6,4 28,4
 % (2° scelta) % (3° scelta) Benzina ,1. 0,3. 10,3. Diesel ,8. 41,7. 17,5. Metano GPL ,2. 0, Ibrida , ,2. Elettrica ,8. 5,8. 21,2. Elettrica con batt.noleg ,6. 6,4. 28,4.")
51
Conclusioni generali Il processo di elettrificazione dei veicoli in corso. La auto ibride conquistano quote crescenti grazie al costo di acquisto contenuto e all’ottima efficienza energetica e ambientale. Le auto elettriche cominciano a diffondersi, soprattutto per un uso urbano. Richiedono però: importanti modifiche nel modo di produrre ed distribuire l’energia elettrica; innovazioni nelle batterie che riducano i costi e permettano autonomie maggiori; la creazione di infrastrutture di ricarica private e pubbliche.

52
Grazie per l’attenzione!
Ricerca predisposta nell’ambito del progetto Electric Car Club (ECC) ( finanziato dalla Regione Autonoma Friuli Venezia Giulia nell'ambito dell'articolo 16 della Legge Regionale n.14 dell'11 agosto 2010 "Concessione di contributi a sostegno della ricerca, dello sviluppo, dell’innovazione e del trasferimento tecnologico per lo sviluppo di sistemi per la mobilità individuale finalizzati alla riduzione di consumi e di emissioni"
 ( finanziato dalla Regione Autonoma Friuli Venezia Giulia nell ambito dell articolo 16 della Legge Regionale n.14 dell 11 agosto 2010 Concessione di contributi a sostegno della ricerca, dello sviluppo, dell’innovazione e del trasferimento tecnologico per lo sviluppo di sistemi per la mobilità individuale finalizzati alla riduzione di consumi e di emissioni")
53
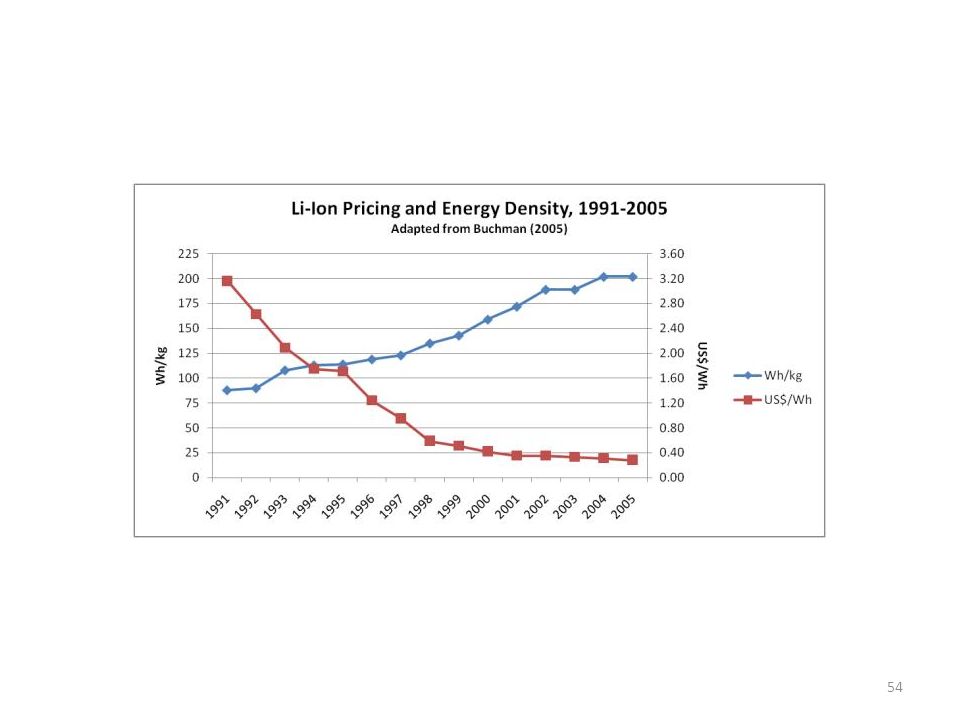
Costo delle batterie (http://www.thegreencarwebsite.co.uk/)
Battery price fall ‘to make EVs cost-effective. The price of batteries for electric and hybrid vehicles will ‘tumble’ over the next decade to the point where alternative powertrains will be as cheap as internal combustion engines, a leading battery maker said at the Reuters Auto Summit this week. According to Reuters, Prabhakar Patil, the chief executive of LG Chem unit Compact Power reports that the price for lithium ion batteries has already fallen by a factor of 14 since the technology was first commercially introduced in the early 1990s. That price tumble will continue Patil told the summit, as the car industry begins to become the biggest user of the technology, overtaking the electronics industry. "It’s been on a pretty steep cost curve and I think we will continue to see costs going down, in fact my internal target is getting it down by a factor of 2 to 4 over the next five to 10 years," Patil said. November 19, 2010 Salt to make EV batteries cheaper and powerful: Electric car batteries using molten salt could be significantly cheaper but offer twice the energy of their lithium-ion counterparts according to Sumitomo Electric Industries. The Japanese electrics firm has teamed up with Kyoto University to produced a sodium-based electrolyte that works at temperatures of only 80 deg Celcius. Previous molten salt systems required operating temperatures of at least 300 deg Celius while the melting point of sodium chloride is 801 deg Celsius, making the batteries expensive to produce and energy-intensive in use. However, with the new breakthrough, scientist think it could allow sodium batteries to go into full production by 2015 at tenth of the cost of current generation lithium ion batteries. March 7, 2011

Presentazioni simili


>")

