Scaricare la presentazione
La presentazione è in caricamento. Aspetta per favore

1
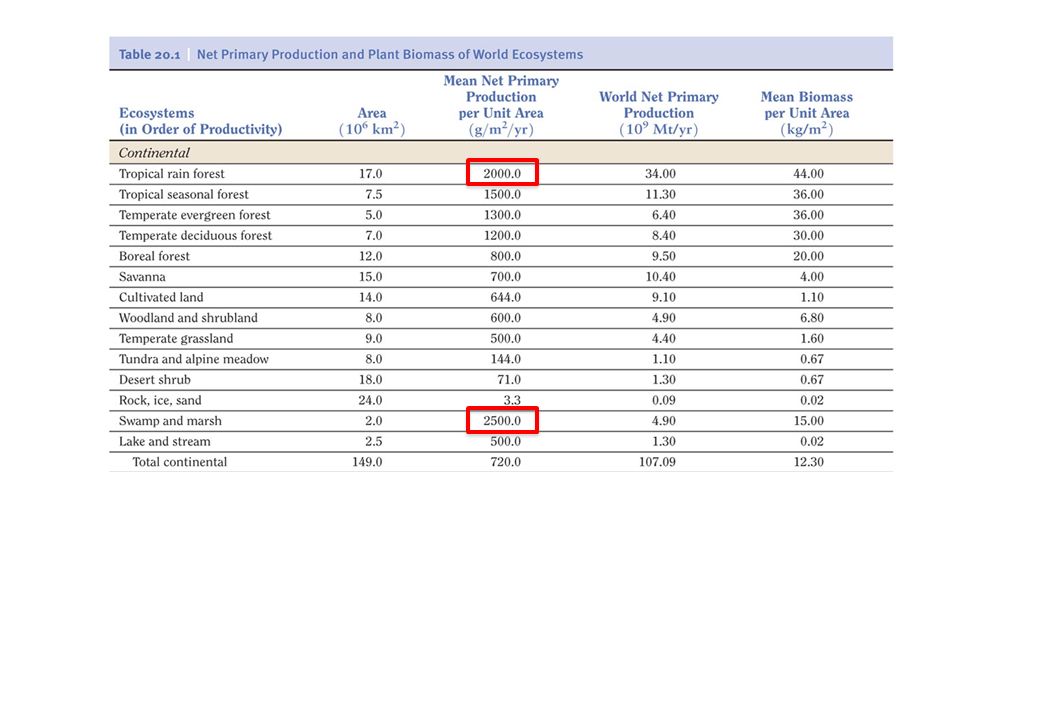
Fattori che limitano la produzione primaria terrestre
Temperatura Precipitazioni Luce Nutrienti

2
Fattori di controllo in ecosistemi terrestri
A variety of environmental factors (climate, radiation) influence productivity Mean annual temperature: higher temp also means longer growing season - both higher rates and more days over which there is photosynthesis
 influence productivity. Mean annual temperature: higher temp also means longer growing season - both higher rates and more days over which there is photosynthesis.")
3
Fattori di controllo in ecosistemi terrestri
The higher the rainfall more water available for transpiration, stoma can remain open and photosynthesis can take place for longer than if drier. Interaction of temperature and moisture; warmer temperature increase evapotranspiration, there increase water demand if not enough water, productivity will be low [explains variability in previous slide] Need both high temperature and high moisture for highest production

4
Fattori di controllo in ecosistemi terrestri
Figure 20.4 AET is combined value of surface evaporation and transpiration - it reflects both the demand and the supply of water to the ecosystem; demand is determined by temperature and solar radiation, whereas supply is a function of precipitation…

5
Fattori di controllo in ecosistemi terrestri
Figure 20.3 Higher temperature correspond to longer photosynthetic periods..

6
Fattori di controllo in ecosistemi terrestri
In addition to climate, the availability of essential nutrients required for plant growth has a direct effect on ecosystem productivity. John Pastor, Uof Min on Blackhawk Island, Wisconsin, clearly show relationship between nitrogen avaiability and aboveground primary productivity

7
La latitudine come fattore di controllo
Il trend è ovunque decrescente: a) prateria e tundra; b) Campi coltivati; c) Laghi
 prateria e tundra; b) Campi coltivati; c) Laghi.")
8
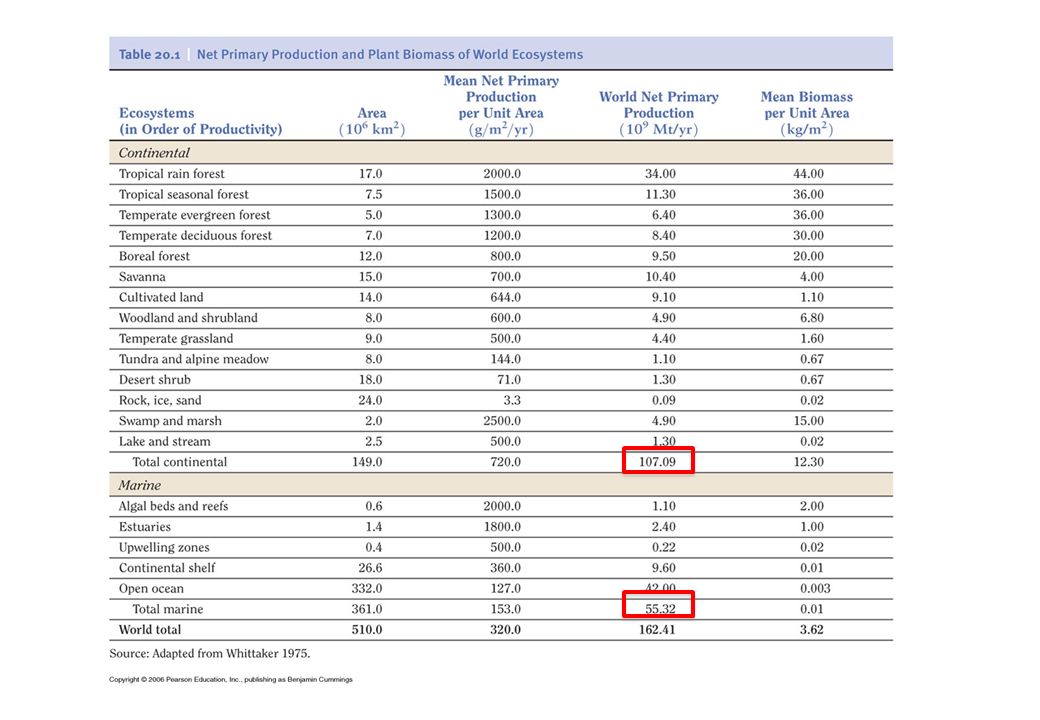
Mappa globale di produttività primaria
Figure 20.5 Highest productivity near equator (high temp, lots of precip), lower away from equator, first because of lower precip, second because of lower temp.
, lower away from equator, first because of lower precip, second because of lower temp.")
13
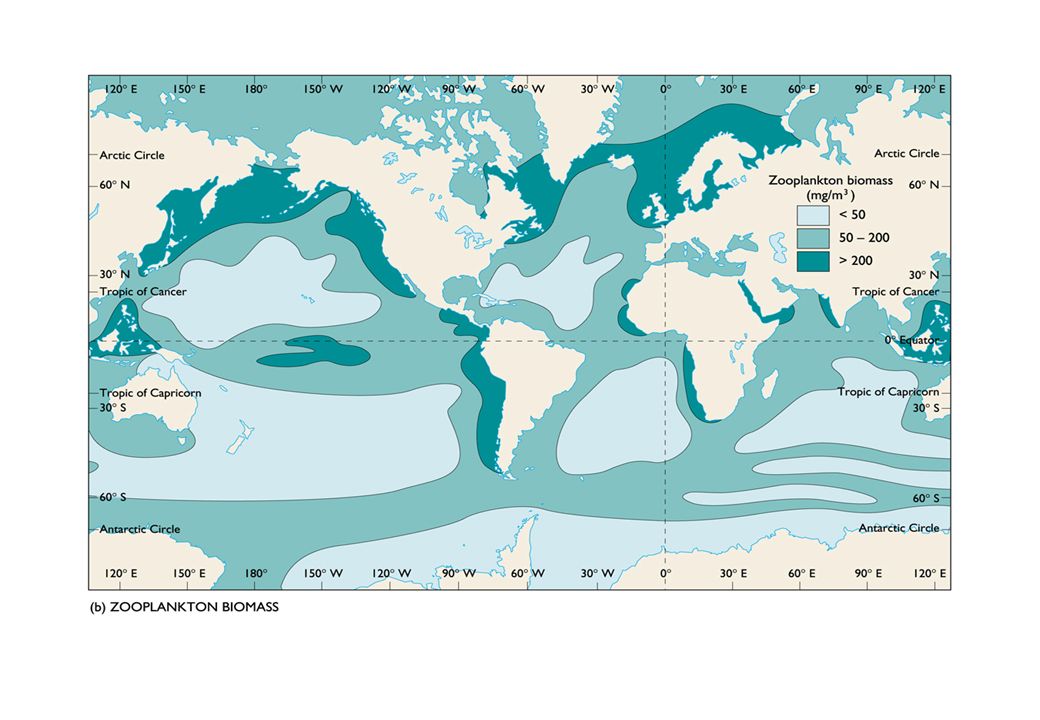
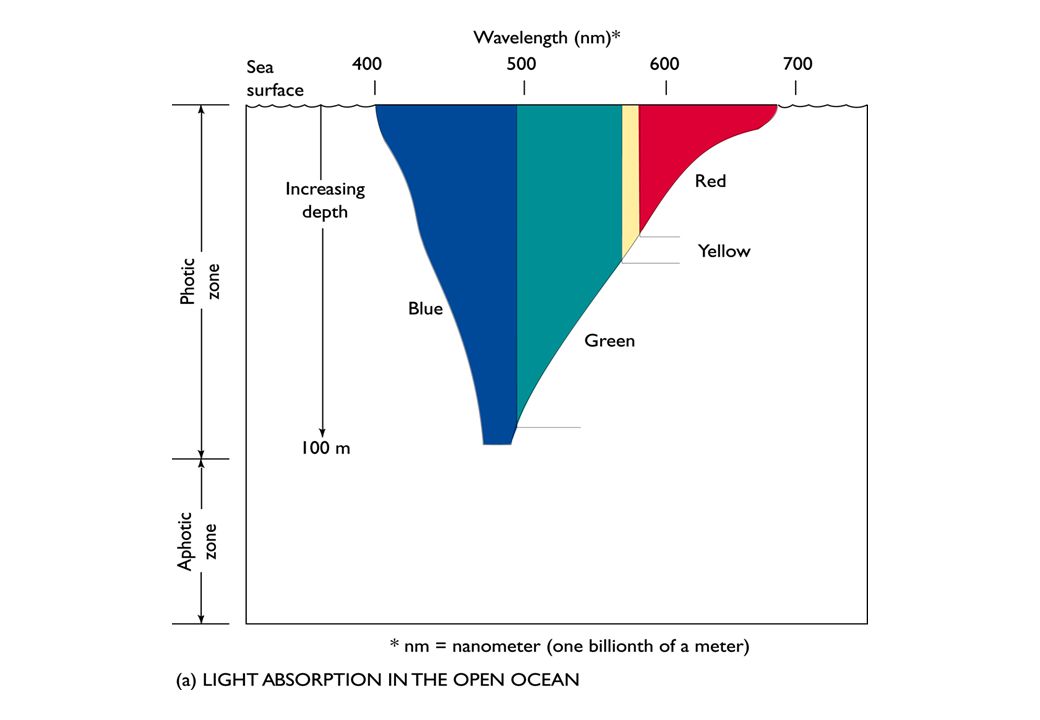
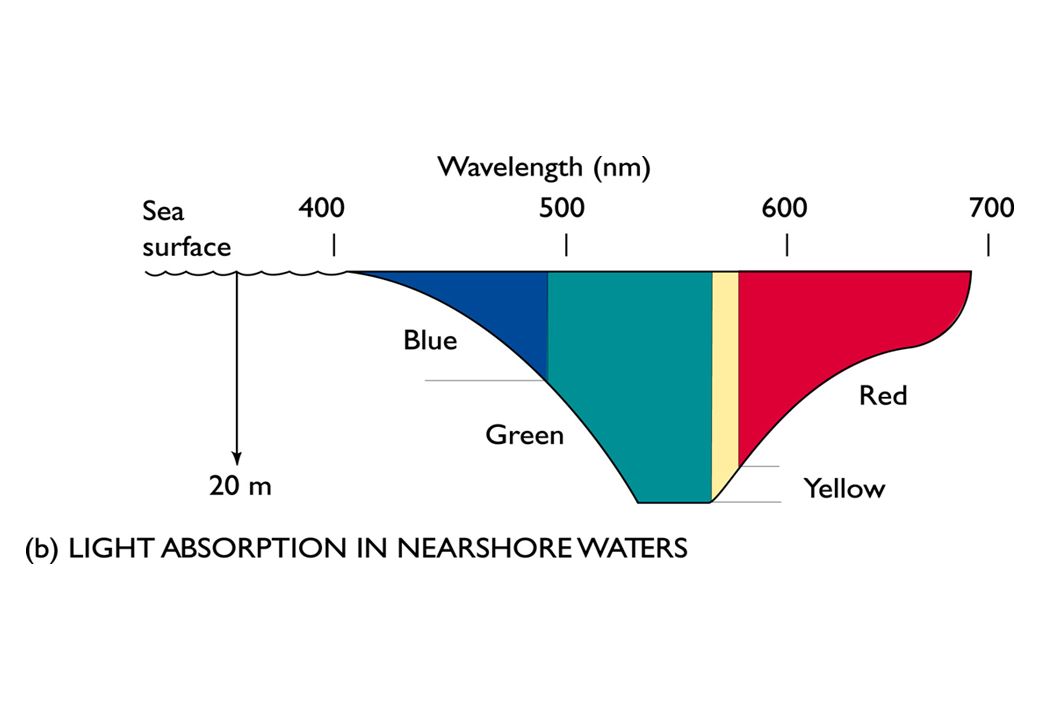
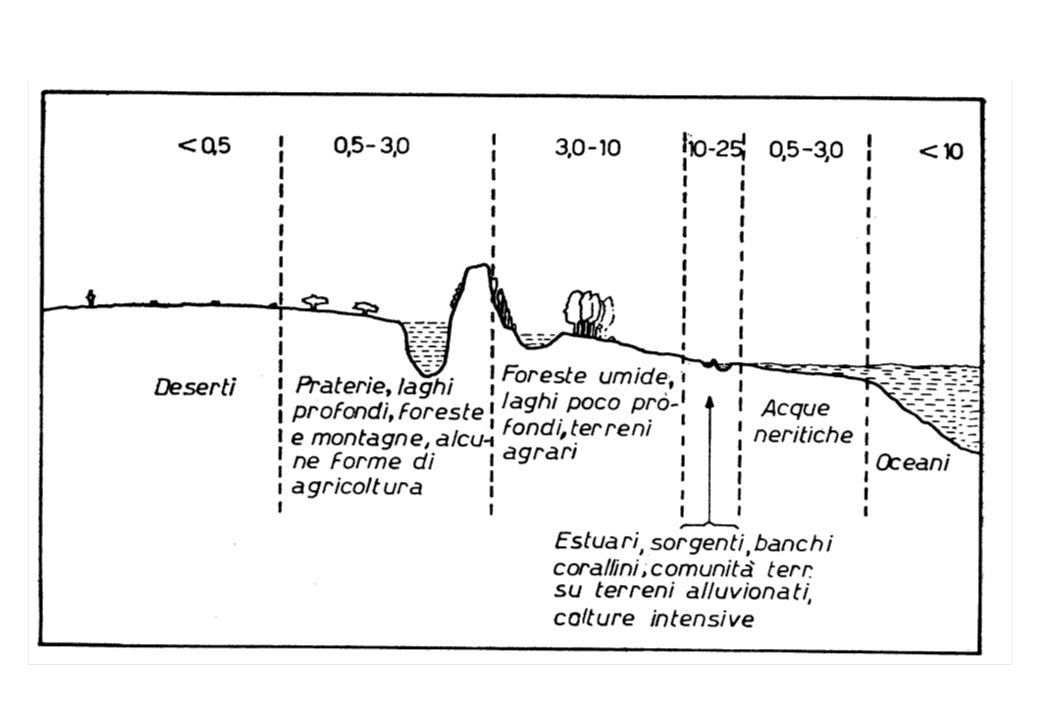
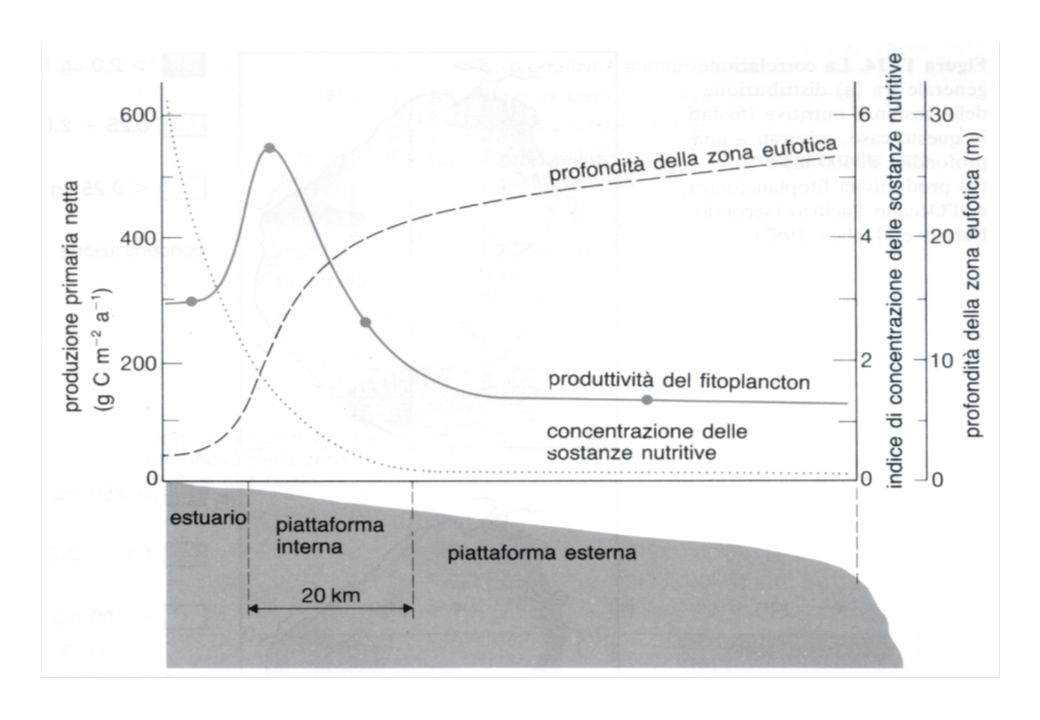
Fattori che limitano la produzione primaria aquatica
Temperatura Precipitazioni Luce Nutrienti

21
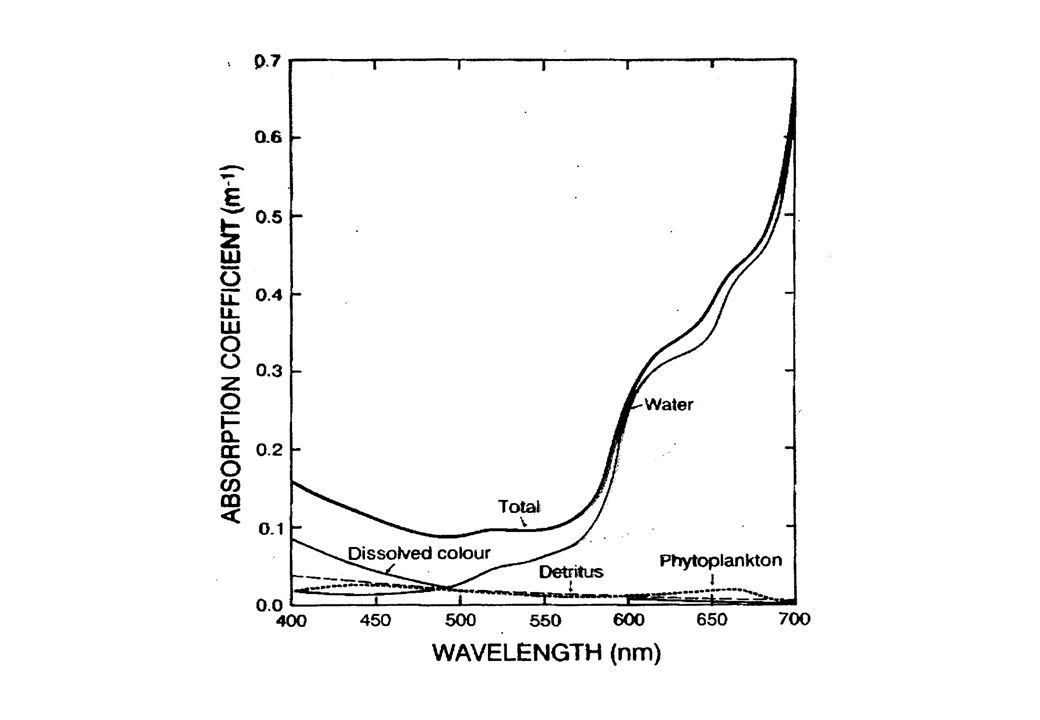
Fattori che limitano la produzione primaria aquatica
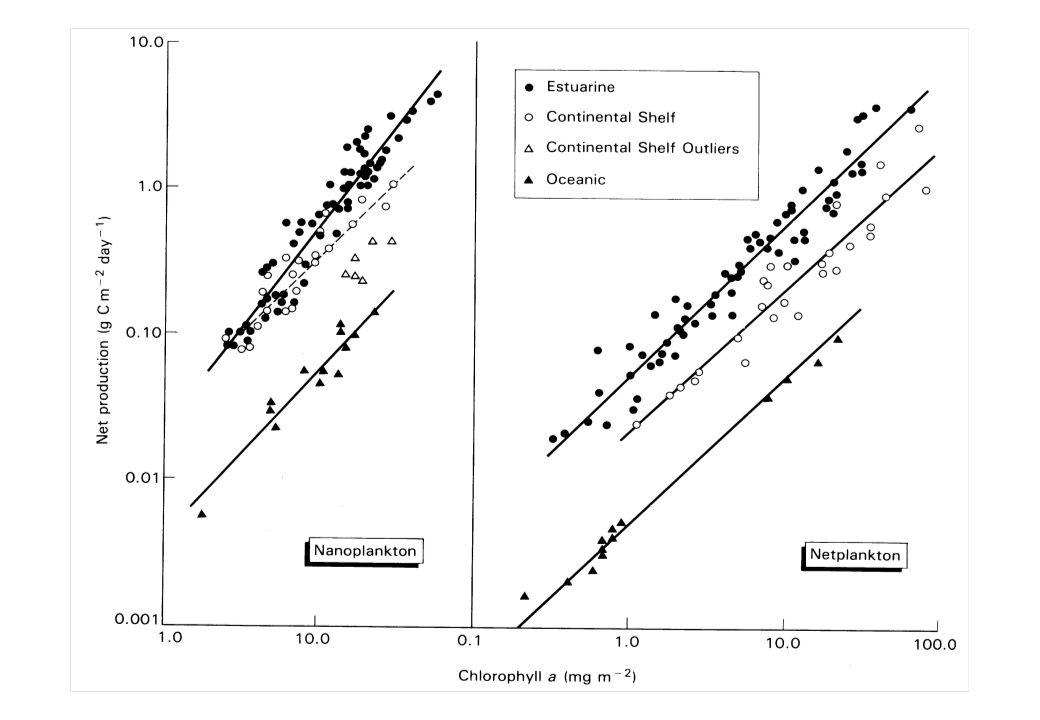
Figure 20.11, nutrient evailability on primary productivity; chlorophyll acts as a proxy for primary production

23
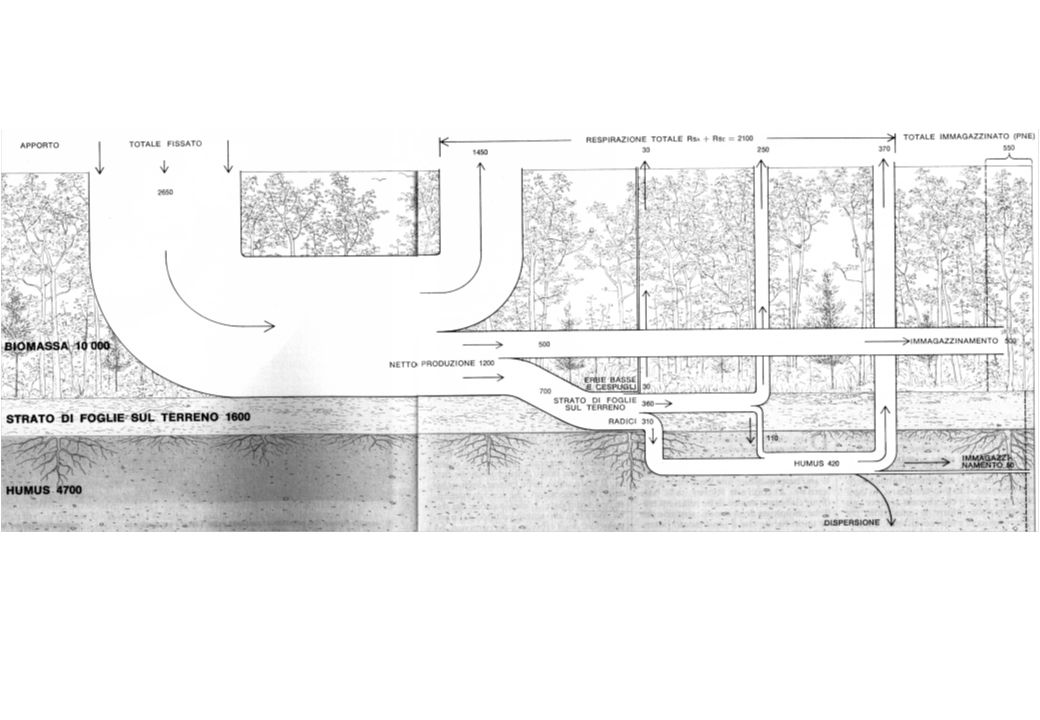
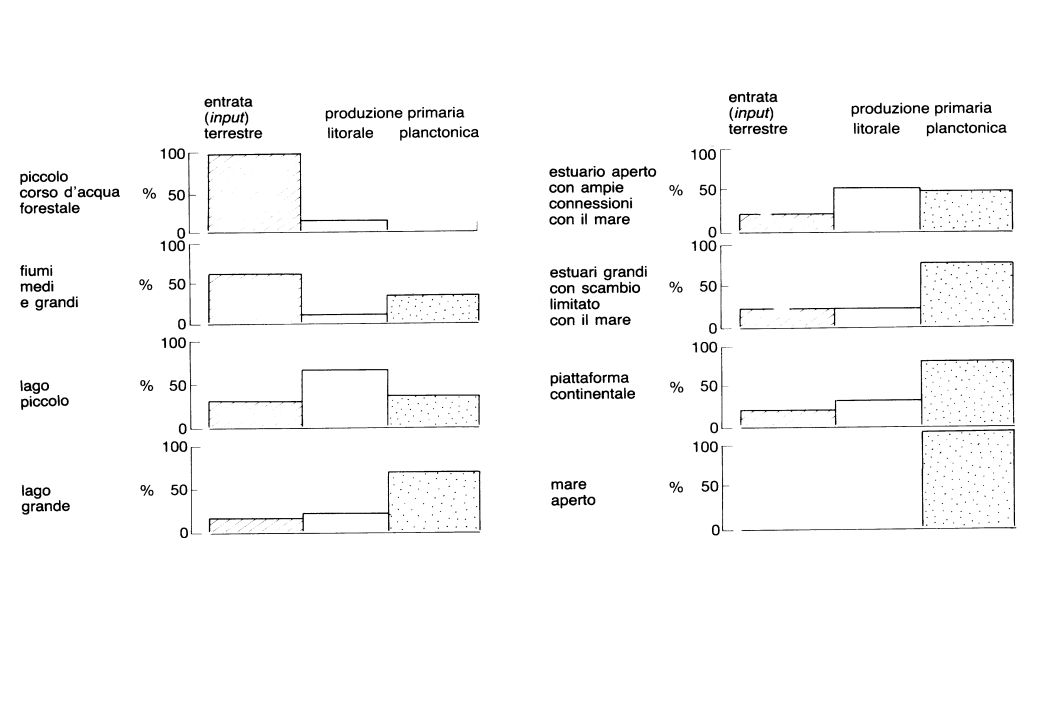
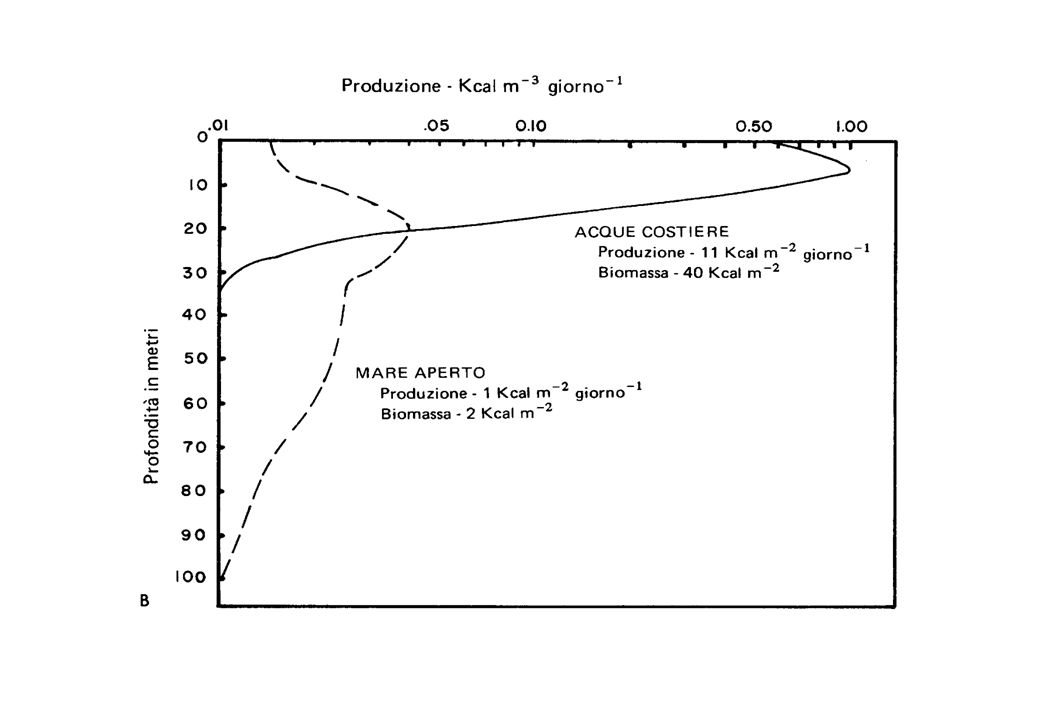
Allocazione dell’energia
Figure 20.12

24
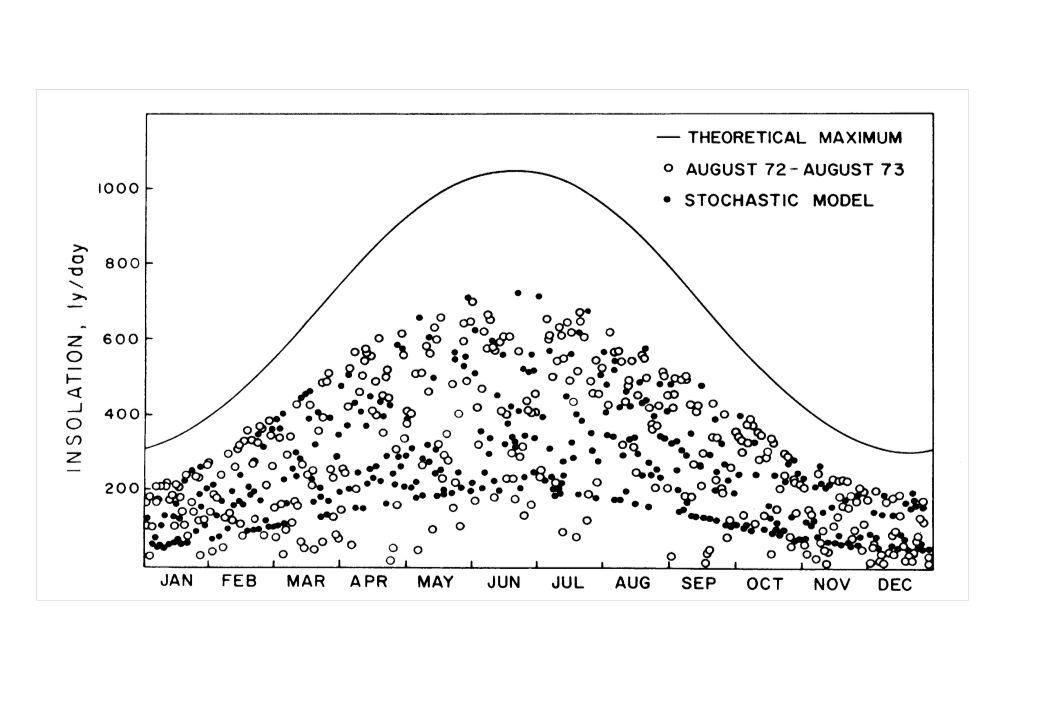
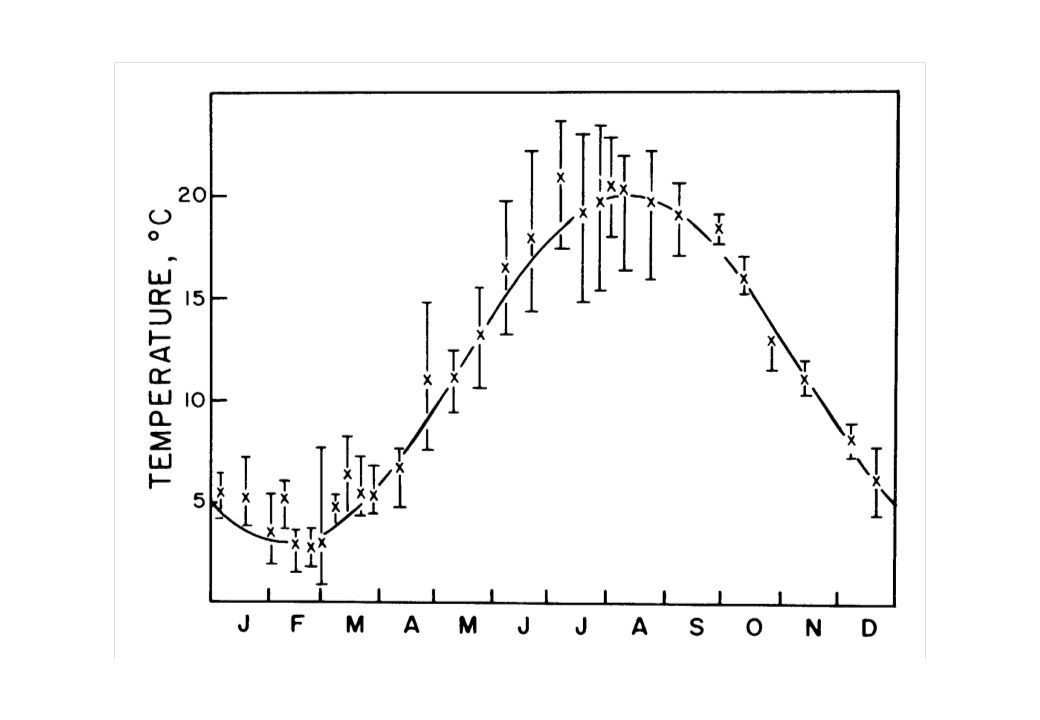
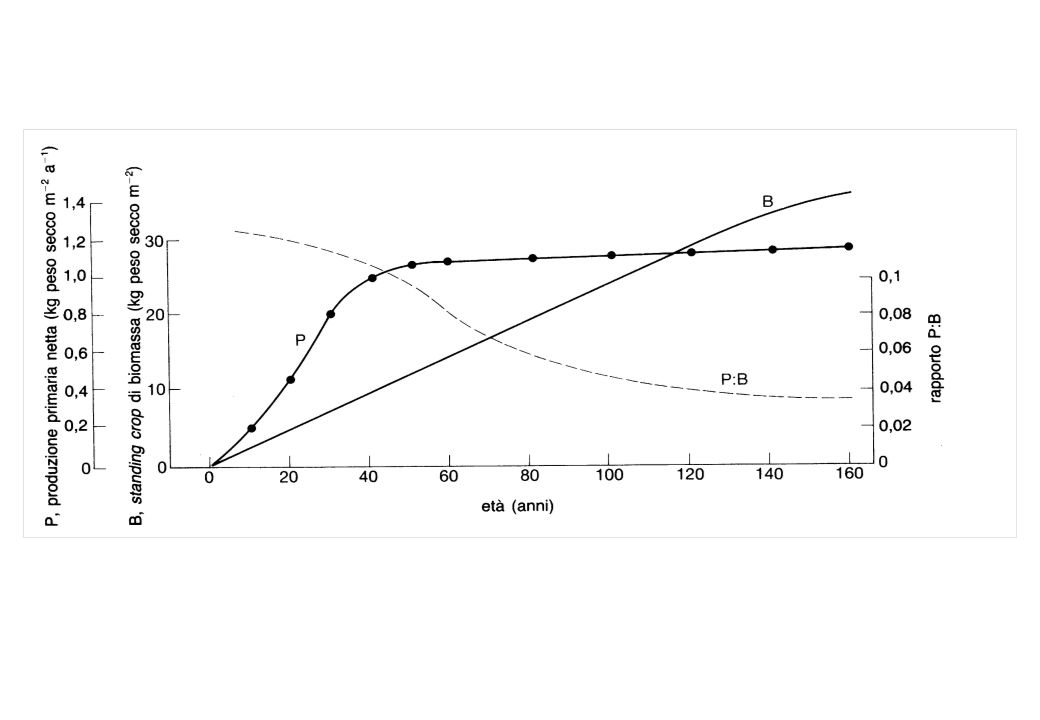
La produzione primaria varia con il tempo
Figure 20.13 Primary production varies with time and age Yields depressed in hot, dry summers

25
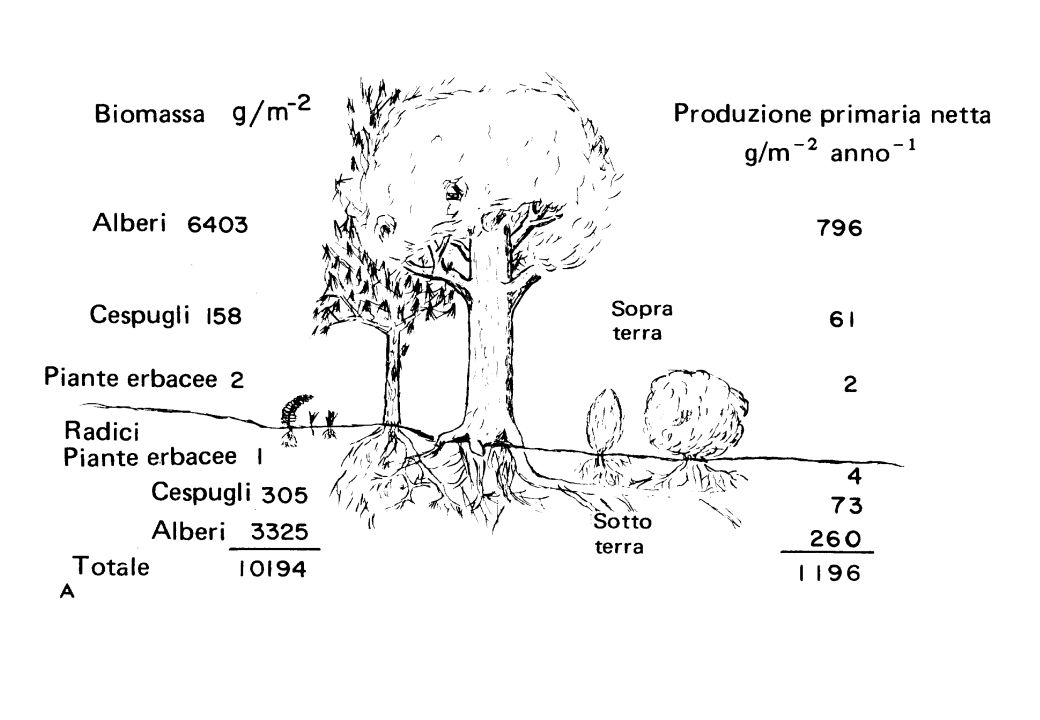
La produzione primaria varia con il tempo
Figure 20.14 Proportion of biomass, at first, lot more goes into leaves (1/2 of biomass), then it decreases. (1-5%)
, then it decreases. (1-5%)")
26
La produzione primaria varia con il tempo
Figure 20.15 Stith Gower at U of Wisconsin - with age more of biomass is in woody tissue As stand ages both photosynthesis and respiration decline

27
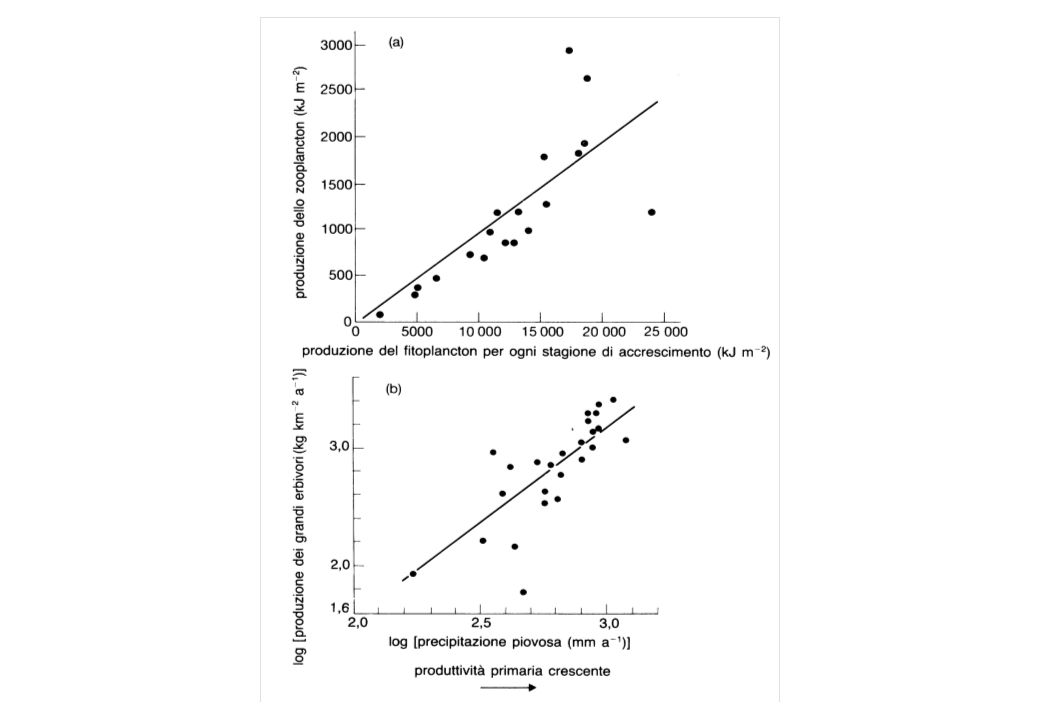
La produzione primaria limita quella secondaria
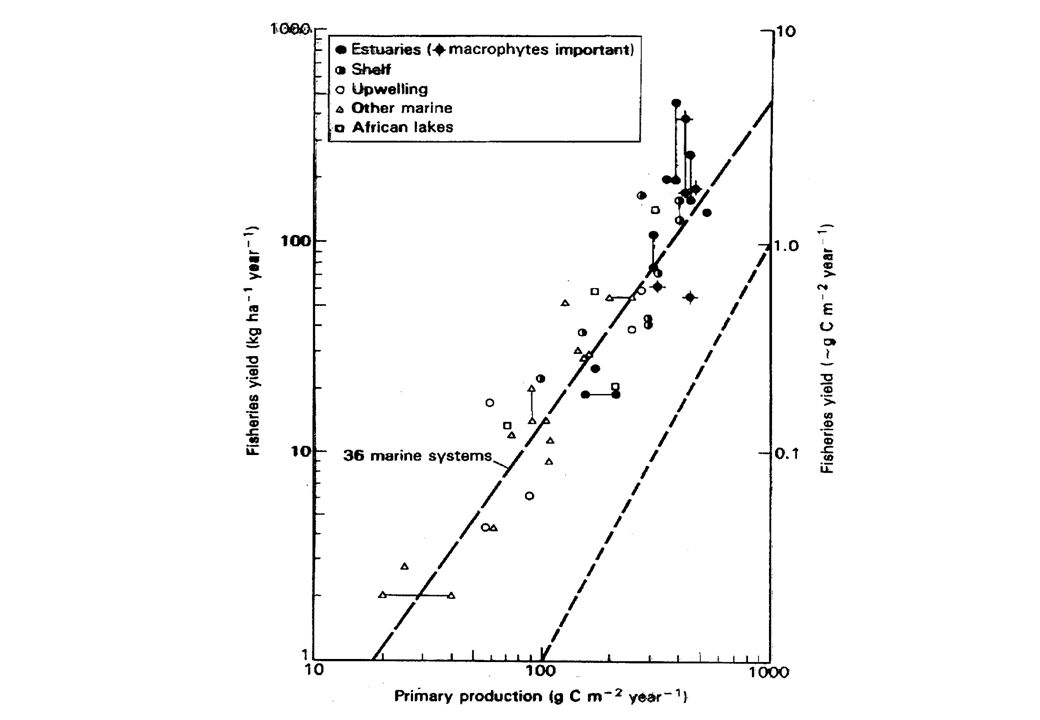
Figure 20.16 Net production is the energy available to the heterotrophic component of the ecosystem (either herbivores or decomposers eventually consume all plant prodiction. Secondary productivity is greatest when the bithrate of the population and the grwoth rate of individuals are highest Compiled by Sam mcNaughton, Syracuse U 69 studies

28
La produzione primaria limita quella secondaria
Figure 20.17 Brylinsky and Mann of Dalhoisue 43 lakes and 12 reservoirs (tropics to Arctic) : significant positive relationship These figures suggest a bottom-up control on the flow of energy through ecosystems, although in many ecosystems there are important top-down controls
 : significant positive relationship. These figures suggest a bottom-up control on the flow of energy through ecosystems, although in many ecosystems there are important top-down controls.")
57
DO2 = O2(15:00) - O2(9:00) = 8.0 - 8.2 = - 0.2 mg m-3
Ore 9:00 Ore 15:00 O2=8.5 mg m-3 O2=8.2 mg m-3 O2=8.2 mg m-3 O2=8.0 mg m-3 Bottiglia chiara: DO2 = O2(15:00) - O2(9:00) = = 0.3 mg m-3 Bottiglia scura: DO2 = O2(15:00) - O2(9:00) = = mg m-3
 - O2(9:00) = = 0.3 mg m-3. Bottiglia scura: DO2 = O2(15:00) - O2(9:00) = = mg m-3.")
58
PL P R PN = DO2 R = DO2 PL Ore 9:00 Ore 15:00
0.2 mg m-3 0.3 mg m-3 O2=8.5 mg m-3 PL O2=8.2 mg m-3 O2=8.2 mg m-3 O2=8.0 mg m-3 P R 0.3 mg m-3 PN = DO2 0.2 mg m-3 R = DO2 0.2 mg m-3 PL = (PN + R) ( ) 0.3 mg m-3 0.2 mg m-3 PL 0.3 mg m-3 PL = 0.5 mg O2 m-3 PL ora-1 ( )/6 = mg O2 m-3 ora-1
 ( + ) 0.3 mg m mg m-3. PL 0.3 mg m-3. PL = 0.5 mg O2 m-3. PL ora-1 ( )/6 = mg O2 m-3 ora-1.")
59
PL ora-1 (0.3 + 0.2)/6 = 0.083 mg O2 m-3 ora-1
6CO2 + 6H2O C6H12O6 + 6O2 C 12 g / mole O 16 g / mole fissando 6 x 12 g C si liberano 6 x 2 x 16 g O 72 g C 192 g O = 0.375 1 mg O2 m-3 ora-1 = mg C m-3 ora-1 PL = mg C m-3 ora-1 PL = mg O2 m-3 ora-1 x = mg C m-3 ora-1

Presentazioni simili