Scaricare la presentazione
La presentazione è in caricamento. Aspetta per favore

1
Monitoraggio Geodetico e Telerilevamento Introduction Carla Braitenberg Dip. Matematica e Geoscienze Universita’ di Trieste berg@units.it Tel. 339 8290713 Tel. Assistente Dr. Nagy: 040 5582257 1.03.2016

2
Studenti 2015 2016 Carla braitenberg berg@units.it 3398290713berg@units.it Ermes zoccolan, ermes.zoccolan@gmail.com, 3331948173ermes.zoccolan@gmail.com Nicola bruzzese, bruzzese.nicola.nb@gmail.com, 3496438860bruzzese.nicola.nb@gmail.com Riccardo minetto, minettoriccardo@hotmail.it, 3296698840minettoriccardo@hotmail.it Rudy Conte, contear@hotmail.com, 3349793099contear@hotmail.com Marco Bartola, marco.bartola@gmail.com, 3338253510marco.bartola@gmail.com Giulia Areggi,giuliaareggi92@gmail.com,3496476618 Gaia Travan,gaiatravan@gmail.com, 3494646919

3
Orario e nota Mercoledi’ mattina 11-13 Giovedi’ pomeriggio 14-16 Nota: Il filo conduttore del Corso e’ il documento Introduction to remote Sensing disponibile in pdf. Le schede Powerpoint sono di supporto al testo, dove esso risulta carente di dettagli. Sia pdf che schede Powerpoint fanno parte del materiale didattico del corso e coprono il contenuto del corso. Il testo e’ prevalentemente in lingua Inglese.

4
Introduction to Course

5
Monitoring Observe geophysical parameters and geometry of earth crust in time. Motivation: Changes in height of earth surface or changes in physical properties are a possibile threat for the population and industrialized facilities. Origin of changes: natural and anthropogenic

6
Vulnerability Human civilization vulnerable: high density of population in big cities. Large number of casualties are affected in case of damage. See Haiti earthquake 2010. Casualties estimated to be 159 000. 1 million persons affected. Essential: electricity for light, electric devices, comunication, clean water, gas supply for heating, comunication over air or cable.

7
Tolerability to changes Changes in ambient conditions only tolerable in limited bounds. Some are: Crustal movement (slow and sudden) Climatic cycles and conditions (temperature) Hydrologic agents (sea level, rainfall, river floods) Wind agents (wind speed, tornados, storms)
 Climatic cycles and conditions (temperature) Hydrologic agents (sea level, rainfall, river floods) Wind agents (wind speed, tornados, storms).")
8
Some examples of hazard Earthquakes: vulnerability of buildings to shaking, Tsunami flooding Pipelines: hazard due to rupture, gas conduits – Interruption of heating, electricity, freezing of water conduits Wind, snow: failure of overland power lines. Interruption of power supply. Enormous consequences: failure of heating system, comunication, water supply

9
Slow changes Climatic: affects agriculture Fast adaptaion to new climate gives economical advantage if done correctly But: it is necessary to distinguish slow change from fluctuation. Fluctuation: short period outlier Change: stable change that lasts for sufficient time to allow investment in agricultural adapation

10
Geodesy Science of measuring shape of the Earth. Geodetic monitoring: – continuous measurement of earth shape and surface – continuous measurement of gravity field The two are tightly connected: any shape change produces a mass change, which produces a gravity change.

11
Vulnerability to surface movements Land slides Subsidence: natural or man-made Creep at fault: building and infrastructure instabilities Local inflation (volcano): Precursory motion due to magma movement. Can be used to predict volcanic eruption.

12
Strain accumulation Strain accumulation at an active fault. Useful for earthquake forecast. Idea: eaqrthquake cycle of strain accumulation and rupture. Time constants are typical for a fault. If strain accumulation is measured, then rupture can be forecast. Large constructions are vulnerable to relative soil movement. Stretto di Messina bridge: relative vertical and horizontal movement between Calabria and Sicilia is problematic for engineering purposes. 03 march 2016

13
Vertical coastal movements Relative change of sea level and coast is highly important for practical reasons. Sea level increase gives floods Sea level drop: cities no longer on sea shore. Harbor unusable.

14
Long term monitoring is useful We conclude: parameter changes and geometry changes in time must be monitored. Allow to plan actions for adapting to environmental changes Monitoring techniques: Space-borne: from satellite. Advantage: global coverage Disadvantage: smaller precision and spatial resolution.

15
Terrestrial observations Terrestrial: highest precision achievable. Time consuming. Local measurement. May be not representative. Bias due to close positioning of measurements to civil cites. Improvement: networks. Redundancy of data is advisable against instrumental failure and anomaly identification.

16
Physical parameters in geophysics Fields: Electric, magnetic, gravity, heat flow, Vp, Vs Geodetic observations: vertical, horizontal movement Tilting, linear strain, volumetric strain Sea level: tide gauges, satellite altimetry Remote sensing: electromagnetic radiation

17
Course Introduction to remote sensing. Take advantage of recent publication of complete Landsat images over near to 50 years. Will be accessible through new Earth Engine of Google. Satellite altimetry: satellites Topex, Jason. Principle of observations, vertical crustal movements from comparison to tide gauges. Vertical crustal movement: repeated leveling, GPS, InSar,

18
Introduction to Remote Sensing Material: the introduction is based on a course recommended by NASA as official introduction to Remote Sensing. Source: Canada Centre for remote Sensing Permission for Use “This educational material within these tutorials is provided as is and may be copied in any form and used for non-commercial purposes provided that the content of the original material is not altered and it is clearly indicated that the Canada Centre for Mapping and Earth Observation (or Canada Centre for remote Sensing), Natural Resources Canada is the originator of this material.” Link: Fundamentals of Remote Sensing - Tutorial http://www.nrcan.gc.ca/earth-sciences/geography- boundary/remote-sensing/fundamentals/1430 http://www.nrcan.gc.ca/earth-sciences/geography- boundary/remote-sensing/fundamentals/1430
, Natural Resources Canada is the originator of this material. Link: Fundamentals of Remote Sensing - Tutorial boundary/remote-sensing/fundamentals/ boundary/remote-sensing/fundamentals/1430.")
19
Notes in parallel to text of remote sensing tutorial Integration to Page 8 of the Tutorial.

20
Frequency, wavelength Give the equations that relate frequency, wavelength and velocity of wave Give the mathematical espression for sinusoidal wave

21
Integration to Page 12 of the Tutorial.

22
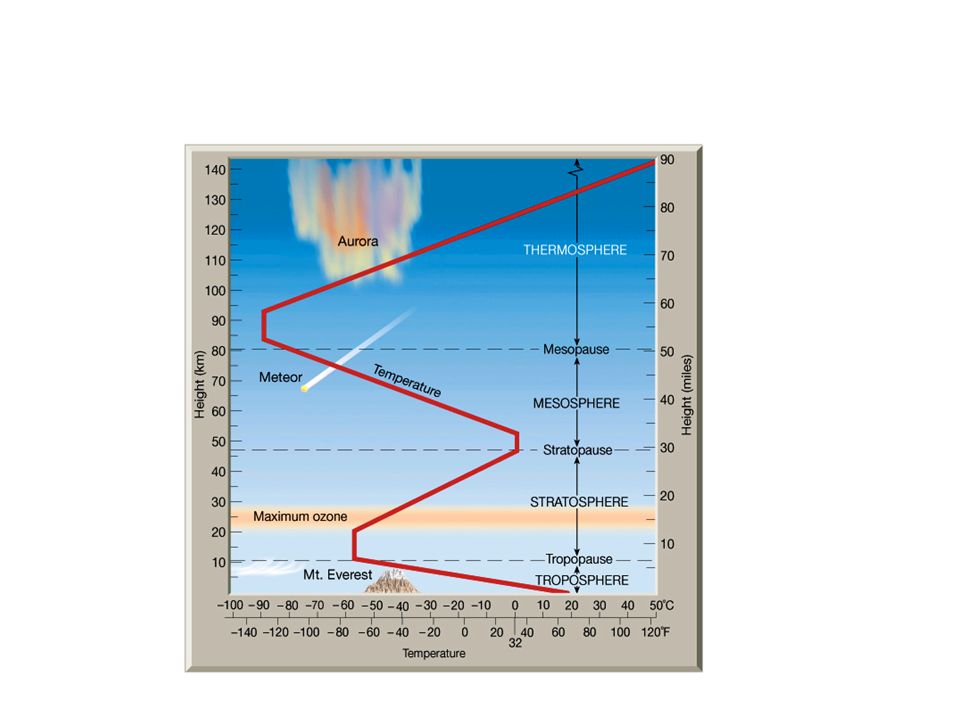
Earth’s atmosphere layers Layering governed by temperature profile Exosphere: 700 to 10,000 km; composed of extremely low densities of hydrogen, helium and several heavier molecules including nitrogen, oxygen and carbon dioxide. No meteorological events possible. Thermosphere: 80 to 700 km; the lower part of the thermosphere, from 80 to 550 kilometers height contains the Ionosphere (layer of electrically charged particles, ionized by short wavelength solar radiation). Temperature increases with height. International Space Station orbits at 320 to 380 km height. 9 marzo 2016
. Temperature increases with height. International Space Station orbits at 320 to 380 km height. 9 marzo")
23
Earth’s atmosphere layers Mesosphere: 50 to 80 km; Temperatures drop with increasing altitude. Coldest place on Earth (average -85°C). Layer in which meteors burn when entering. Stratosphere: 12 to 50 km; contains ozone layer. Temperature rises with increasing height, caused by absorption of UV radiation in Ozone layer. Temperature profile creates stable conditions, that prevents air turbulence. Highest layer that can be accessed by jet-powered aircraft.
. Layer in which meteors burn when entering. Stratosphere: 12 to 50 km; contains ozone layer. Temperature rises with increasing height, caused by absorption of UV radiation in Ozone layer. Temperature profile creates stable conditions, that prevents air turbulence. Highest layer that can be accessed by jet-powered aircraft..")
24
Thermal structure of atmosphere http://www.centennialofflight.net/essay/Theories_of_Flight/atmosphere/TH1G1.htm

26
Ozone layer Ozone: O 3. Pale blue gas. Formed from dioxygen (O 2 ) by absorption of ultraviolet light and atmospheric electric discharges. Present in Earth’s atmosphere. Ozone is powerful oxidant. Causes damage to mucous and respiratory tissues of animals. Ozone layer: region of stratosphere that absorbs UV radiation from sun
 by absorption of ultraviolet light and atmospheric electric discharges. Present in Earth’s atmosphere. Ozone is powerful oxidant. Causes damage to mucous and respiratory tissues of animals. Ozone layer: region of stratosphere that absorbs UV radiation from sun.")
27
Ozone cycle production in stratosphere (Courtesy NASA)
")
28
Earth’s atmosphere layers Troposphere: 0 to 12 km; temperature declines with height. Heating from energy transfer from earth surface. Vertical mixing of air. Contains 80% of mass of atmosphere. Only layer that can be accessed with propeller driven aircraft.

29
Atmosphere seen in space “In a very unique setting over Earth's colorful horizon, the silhouette of the space shuttle Endeavour is featured in this photo by an Expedition 22 crew member on board the International Space Station, as the shuttle approached for its docking on Feb. 9 during the STS-130 mission”. Image Credit: NASA http://www.nasa.gov/multimedia/imagegallery/image_feature_1592.html Space Shuttle Endeavour orbiting in the thermosphere. Because of the angle of the photo, it appears to straddle the stratosphere and mesosphere that actually lie more than 250 km below. The orange layer is the troposphere, the whitish the stratosphere and the blue is mesosphere

30
Atmosphere composition Atmosphere: layer of gases retained to earth by gravity. Acts as solar UV absorption and warming the surface with heat retention, which equivals to greenhouse effect. Reduces temperature extremes of diurnal temperature variation.

31
Volume percent of atmosphere composition dry air contains: 78.09% nitrogen (N) 20.95% oxygen (O) 0.93% argon (Ar) 0.039% carbon dioxide (CO2) Small amounts of other gases. Air also contains a variable amount of water vapor, on average around 1% at sea level, and 0.4% over the entire atmosphere.

32
Integration to Page 14 of the Tutorial.

33
Greenhouse gases absorption spectra Atmospheric absorption and scattering at different wavele ngths of electro magnetic waves. The largest absorption band of carbon dioxide is in the infrared.wavele ngthselectro magnetic wavescarbon dioxideinfrared Wikipedia_en Greenhouse gases

34
Integration to Page 16 of the Tutorial. 16 Marzo 2016

35
Riflessione-rifrazione-diffrazione La rifrazione è la deviazione subita da un'onda che ha luogo quando questa passa da un mezzo ad un altro nel quale la sua velocità di propagazione cambia. La rifrazione della luce è l'esempio più comunemente osservato, ma ogni tipo di onda può essere rifratta, per esempio quando le onde sonore passano da un mezzo ad un altro o quando le onde dell'acqua si spostano a zone con diversa profondità.ondamezzovelocitàluceonde sonore https://it.wikipedia.org/wiki/Rifrazione

36
Riflessione-rifrazione-diffrazione In fisica la diffrazione è un fenomeno associato alla deviazione della traiettoria di propagazione delle onde (come anche la riflessione, larifrazione, la diffusione o l'interferenza) quando queste incontrano un ostacolo sul loro cammino. È tipica di ogni genere di onda, come ilsuono, le onde sulla superficie dell'acqua o le onde elettromagnetiche come la luce o le onde radio; la diffrazione si verifica anche nelle particolari situazioni in cui la materia mostra proprietà ondulatorie, in accordo con la dualità onda-particella.fisicafenomenoonderiflessionerifrazionediffusioneinterferenzasuonoacquaonde elettromagneticheluceonde radiodualità onda-particella Gli effetti di diffrazione sono rilevanti quando la lunghezza d'onda è comparabile con la dimensione dell'ostacolo. In particolare per la luce visibile (lunghezza d'onda attorno a 0,5 µm) si hanno fenomeni di diffrazione quando essa interagisce con oggetti di dimensione sub-millimetrica.lunghezza d'ondaluce visibileµmmillimetrica https://it.wikipedia.org/wiki/Diffrazione
 si hanno fenomeni di diffrazione quando essa interagisce con oggetti di dimensione sub-millimetrica.lunghezza d ondaluce visibileµmmillimetrica")
37
Riflessione-rifrazione-diffrazione In fisica la riflessione è il fenomeno per cui un'onda, che si propaga lungo l'interfaccia tra differenti mezzi, cambia di direzione a causa di un impatto con un materiale riflettente.fisicaonda In acustica la riflessione causa gli echi ed è utilizzata nel sonar. In geologia è importante nello studio delle onde sismiche.acusticaechisonargeologiaonde sismiche Assorbimento, riflessione e trasmissione sono i fenomeni che avvengono quando la luce interagisce con la materia: quando l'energia radiante incide su un corpo, una parte viene assorbita, una parte viene riflessa e una parte trasmessa e per la legge di conservazione dell'energia, la somma delle quantità di energia rispettivamente assorbita, riflessa e trasmessa è uguale alla quantità di energia incidente. Assorbimentotrasmissionelucematerialegge di conservazione dell'energia https://it.wikipedia.org/wiki/Riflessione_(fisica)

38
Integration to Page 19 of the Tutorial.

39
Laser Fluorosensor http://lms.seos-project.eu/learning_modules/marinepollution/marinepollution-c02-s19- p01.html Many objects absorb light and re-emit a fraction of it as fluorescent light (see page 19 of Tutorial) The spectral analysis of the fluorescent light makes it possible to characterize the substances of which the object is composed. LIDAR: Light detection and ranging. Monochromatic light is emitted and the reflection is observed. Range: measure time lapse between emission and reflection. Lidar instruments which measure fluorescence are called fluorescence lidar or laser fluorosensor. They can be operated aboard an aircraft to analyse physical and biological parameters of waters such as the turbidity and the algae content, or to detect marine pollutants.

40
Laser Fluorosensor http://lms.seos-project.eu/learning_modules/marinepollution/marinepollution-c02-s19- p01.html

41
Oil spill on water detection with Laser fluorosense thin films of lubricating oil on a water surface are illuminated with UV laser radiation at 355 nm wavelength and emit blue fluorescence. The laser radiation is invisible to the eye and to the photocamera. The oil-free water does not fluoresce and remains dark on the image.

42
Fluorescence emission spectra of different kind of oils Fluorescence spectra of different oil types upon irradiation with UV light at 308 nm wavelength. The curves show the intensity of the fluorescence versus the wavelength between 320 nm (UV) and 685 nm (far red). The curves are normalized to the same total (i.e., integrated over-all wavelengths) fluorescence intensity in order to highlight the shape of the spectra. The absolute fluorescence intensity of heavy oils is much weaker than that of light oils and could not be visualized on the graph without normalization.
 and 685 nm (far red). The curves are normalized to the same total (i.e., integrated over-all wavelengths) fluorescence intensity in order to highlight the shape of the spectra. The absolute fluorescence intensity of heavy oils is much weaker than that of light oils and could not be visualized on the graph without normalization..")
Presentazioni simili