Scaricare la presentazione
La presentazione è in caricamento. Aspetta per favore

1
Stefano Bonora Università di Torino 12 Aprile 2013
L’importanza delle interazioni farmacologiche nella gestione dell’HIV/AIDS, delle comorbosità e della co-infezione HCV Stefano Bonora Università di Torino 12 Aprile 2013

2
Premessa Un farmaco introdotto nell’organismo (per via orale, parenterale, ecc.) può subire varie trasformazioni, in funzione delle sue caratteristiche fisico-chimiche, ed essere eliminato per vie diverse, in varie forme molecolari. Può accadere che un farmaco non venga quasi per nulla modificato e sia eliminato come tale, oppure che subisca numerose trasformazioni verso forme che possono essere ancora farmacologicamente attive (o anche più attive rispetto alla molecola originale) oppure del tutto inerti (non attive) per quanto concerne l’effetto desiderato.
 può subire varie trasformazioni, in funzione delle sue caratteristiche fisico-chimiche, ed essere eliminato per vie diverse, in varie forme molecolari. Può accadere che un farmaco non venga quasi per nulla modificato e sia eliminato come tale, oppure che subisca numerose trasformazioni verso forme che possono essere ancora farmacologicamente attive (o anche più attive rispetto alla molecola originale) oppure del tutto inerti (non attive) per quanto concerne l’effetto desiderato.")
3
Premessa Le interazioni possono avere differenti meccanismi (non solo inibizione o induzione del metabolismo). Le interazioni possono alterare la quantità di farmaco disponibile nell’organismo con potenziale impatto su efficacia e tossicità. L’effetto di un farmaco interagente nel tempo è diverso in funzione del meccanismo di interazione.

4
OUTLINE Epidemiology New antiretrovirals/drugs combination
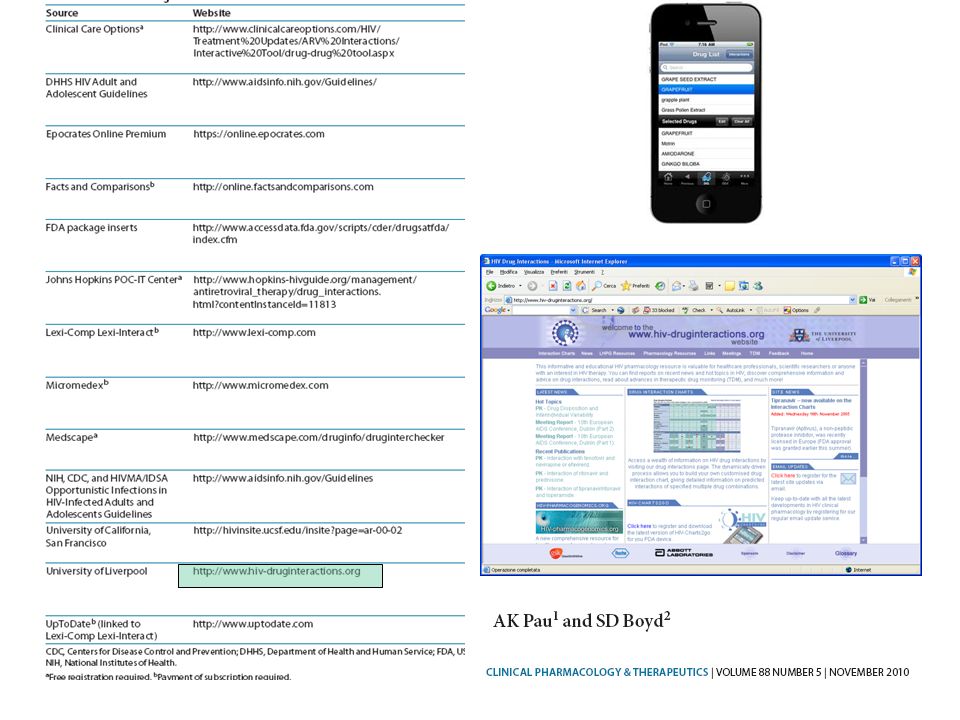
Sources of information Interpretation and management of DDIs

5
OUTLINE Epidemiology New antiretrovirals/drugs combination
Sources of information Interpretation and management of DDIs

6
Considerations in Management of the Older HIV Patient
Earlier appearance of co-morbidities supports an earlier ‘older’ age designation in HIV patients, ie 55 vs 65 years!

7
Drug Interactions will be greater as patients age
10 20 30 40 50 60 cardiovascular drugs CNS agents anti-infectives analgesics gastrointestinal drugs methadone hormones antilipidemics antiplatelets/anticoagulants ACE inhibitors Beta blockers angiotensin II inhibitors diuretics insulin/antidiabetics calcium channel inhibitors patients (%) < 50 years ? 50 years B * ** *** 10 20 30 40 50 1 2 3 4 5 6 7 >8 number of co-medications patients (%) < 50 years ? 50 years A Number of co-medications Patients (%) >50 years > 50 years Marzolini C et al J Antimicrob Chemother 2011;66:2107
 < 50 years. 50 years. B. * ** *** >8. number of co-medications. patients (%) < 50 years. 50 years. A. Number of co-medications. Patients (%) >50 years. > 50 years. Marzolini C et al J Antimicrob Chemother 2011;66:2107.")
8
Failure to Recognise Drug Interactions
HIV drugs amongst the most therapeutically risky % patients on ARVs at risk of clinically significant interactions PIs > NNRTIs >> MVC/RAL > NRTIs - PIs associated with 5-fold prevalence risk of significant DDIs compared to raltegravir, and 10-fold risk compared to NRTIs Physicians recognise only around a third correctly - Pharmacist pre-screening of 200 HIV clinic patients told physicians something they did not know about medication history (20%), adherence (31%) or drug interactions (38%), and changed patient management in 13.6% Patel et al. Ann Pharmacother 2011, Miller et al Pharmacother 2007;27:1379, Evans-Jones et al. CID 2010;50:1419, de Maat et al. Ann Pharmacother 2002;36: Mok et al. Am J Health Sys Pharm 2008;65:55, Seden et al. Int J STD AIDS 2012 (in press) Seden et al (unpublished)
, adherence (31%) or drug interactions (38%), and changed patient management in 13.6% Patel et al. Ann Pharmacother 2011, Miller et al Pharmacother 2007;27:1379, Evans-Jones et al. CID 2010;50:1419, de Maat et al. Ann Pharmacother 2002;36: Mok et al. Am J Health Sys Pharm 2008;65:55, Seden et al. Int J STD AIDS 2012 (in press) Seden et al (unpublished)")
9
Quindi Il rischio di interazione è funzione del numero di farmaci assunti dal paziente. Tale rischio è probabilmente sottostimato nella pratica clinica. Alcune classi di farmaci hanno un rischio di interazione significativamente ridotto rispetto ad altre (per es. INI, inibitori dell’integrasi vs. NNRTI o IP).
.")
10
OUTLINE Epidemiology New antiretrovirals/drugs combination
Sources of information Interpretation and management of DDIs

11
Drug Interaction Data for RPV (Rilpivirina)
GILEAD_EP_4x3_TEMPLATE_v01.ppt 3/27/2017 Drug Interaction Data for RPV (Rilpivirina) Change in RPV exposure (AUC) Change in other drug’s exposure (AUC) TDF1 +23% LPV/r2 +52% (CYP inhibition) DRV+RTV3 +130% (CYP inhibition) Maraviroc Raltegravir Ketoconazole4,5 + 49% (CYP inhibition) - 24% Acetaminophen6 Rifampicin4 -80% (CYP induction) Rifabutin7 -46% (CYP induction) Ethinylestradiol8 or norethindrone8 Atorvastatin9 Famotidine10 « (if separated by 4 hrs) ¯-16% Methadone11, 12 «, « Chlorzoxazone4 Omeprazole13 -40% (pH increase) Sildenafil14 Crauwels H, et al. ACTHIV 2011; Denver. Colorado. #TPOI-4 Presentation Name 11 11
 Change in RPV exposure (AUC) Change in other drug’s exposure (AUC) TDF1. +23% LPV/r2. +52% (CYP inhibition) DRV+RTV % (CYP inhibition) Maraviroc. Raltegravir. Ketoconazole4, % (CYP inhibition) - 24% Acetaminophen6. Rifampicin4. -80% (CYP induction) Rifabutin7. -46% (CYP induction) Ethinylestradiol8 or norethindrone8. Atorvastatin9. Famotidine10. « (if separated by 4 hrs) ¯-16% Methadone11, 12. «, « Chlorzoxazone4. Omeprazole % (pH increase) Sildenafil14. Crauwels H, et al. ACTHIV 2011; Denver. Colorado. #TPOI-4. Presentation Name")
12
Rilpivirine Drug Interaction: Rationale for Contraindication & Spacing
GILEAD_EP_4x3_TEMPLATE_v01.ppt 3/27/2017 Rilpivirine Drug Interaction: Rationale for Contraindication & Spacing H2 antagonists must be taken 12 hours before or 4 hours after RPV since when taken 2 hours before RPV resulted in 85% reduction in RPV exposures PPIs are contraindicated with RPV due to significant 40% reduction in RPV exposure Antacids should be given ≥ 2h before or ≥ 4h after RPV Parameter Mean % Change (90% CI) Cmax AUC Famotidine 40 mg single dose taken 2 hours before rilpivirine 85% ( 88 to 81) 76% ( 80 to 72) Omeprazole 20 mg once daily 40% ( 52 to 27) 40% ( 52 to 29) RPV/TVD US Prescribing Information, Gilead Sciences, Inc. July 22, 2011 Do not copy or distribute Atripla does NOT have an indication for the treatment of naïve patients and there is NO Atripla promotion concerning treatment NAÏVE patients For internal Gilead use only Eviplera does NOT have an indication for the treatment of experienced patients and there is NO Eviplera promotion concerning treatment experienced patients and until Italian AIC is granted Presentation Name 12
 Cmax. AUC. Famotidine. 40 mg single dose taken 2 hours before rilpivirine. 85% ( 88 to 81) 76% ( 80 to 72) Omeprazole. 20 mg once daily. 40% ( 52 to 27) 40% ( 52 to 29) RPV/TVD US Prescribing Information, Gilead Sciences, Inc. July 22, Do not copy or distribute Atripla does NOT have an indication for the treatment of naïve patients and there is NO Atripla promotion concerning treatment NAÏVE patients. For internal Gilead use only. Eviplera does NOT have an indication for the treatment of experienced patients and there is NO Eviplera promotion concerning treatment experienced patients and until Italian AIC is granted. Presentation Name. 12.")
13
Tuberculosis Protease inhibitors NNRTIs Entry / Integrase inhibitors
Fonte:

14
Efficacy Outcomes, W24 ANRS 12 180
Primary endpoint : HIV RNA<50 cp/mL at W20 and W24, mITT (M=F, D/C=F) EFV N = 51 RAL 400 N = 51 RAL 800 PRIMARY ENDPOINT n % [95% CI] % [95% CI] Success 32 63 [49-76] 39 76 [65-88] 40 78 [67-90] Failure 19 37 [24-51] 12 24 [12-35] 11 22 [10-33] Virologic failure 15 4 AE leading to treatment discontinuation 2 3 Death Withdrawal / Lost to Follow-up Secondary endpoint : HIV RNA<400 cp/mL at W20 and W24, mITT (M=F, D/C=F) EFV N = 51 RAL 400 RAL 800 SECONDARY ENDPOINT n % [95% CI] Success 39 76 [65-88] 41 80 [69-91] 42 82 [72-93] Failure 12 24 [12-35] 10 20 [9-31] 9 18 [7-28] Virologic failure 8 2 AE leading to treatment discontinuation 3 Death Withdrawal / Lost to Follow-up
 EFV N = 51. RAL 400. N = 51. RAL 800. PRIMARY ENDPOINT. n. % [95% CI] % [95% CI] Success [49-76] [65-88] [67-90] Failure [24-51] [12-35] [10-33] Virologic failure AE leading to treatment discontinuation Death. Withdrawal / Lost to Follow-up. Secondary endpoint : HIV RNA<400 cp/mL at W20 and W24, mITT (M=F, D/C=F) EFV. N = 51. RAL 400. RAL 800. SECONDARY ENDPOINT. n. % [95% CI] Success [65-88] [69-91] [72-93] Failure [12-35] [9-31] [7-28] Virologic failure AE leading to treatment discontinuation. 3. Death. Withdrawal / Lost to Follow-up.")
15
Immunosuppressant agents
CNI: cyclosporine, tacrolimus (CYP3A, Pgp) Antimetabolites: mycophenolate (UGT) Mamalian target-of-rapamycin (mTOR) inhibitors: sirolimus, everolimus (CYP3A, Pgp) Van Maarseveen EM, et al. AIDS Pat Care & STD 2012
 Antimetabolites: mycophenolate (UGT) Mamalian target-of-rapamycin (mTOR) inhibitors: sirolimus, everolimus (CYP3A, Pgp) Van Maarseveen EM, et al. AIDS Pat Care & STD")
16
Antineoplastic agents Potential significance
Drug Metabolism Potential significance Cyclophosphamide 2B6 active 3A4toxic IDV CPA CL by 1.5 in 40 patients Ifosfamide 3A4 active 2B6, 3A4toxic Docetaxel 3A4 RTV DOC AUC x50-fold in mice Paclitaxel 2C8>>3A4 Mild interactions with NVP Severe mucositis/neutropenia with SQV/DLV Vinca alkaloids Neurotoxicity, myelosuppression Severe neutropenia with vinblastine + LPV/r Doxorubicin Daunorubicin AKR No interactions in 40 patients with IDV No interactions in 19 patients with IDV/NFV/SQV Etoposide 3A4>>2E1,1A2 Mucositis, myelosuppression, transaminitis Higher incidence of severe mucositis with SQV Irinotecan Carboxylesterases UGT, CYP3A4 LPV/r IRI CL by 47% in 7 patients 50% dose-reduction Persistent neutropenia in one patient Edmunds-Ogbuokiri et al. HIV Clinician 2009

17
Actual/theoretical interaction Potential significance
Recreational drugs Drug Metabolism Actual/theoretical interaction Potential significance Ecstasy (X, MDMA) 2D6>>1A2, 2B6, 3A4 2-3 fold with RTV or EFV Fatal interactions reported. Hyponatremia, hypertermia, arrhytmias, seizures, rhabdomyolysis Amphetamines (speed, cristal) 2D6 Possible with RTV Hypertension, hypertermia, arrhytmias, seizures GHB (liquid ecstasy) Expired breath as CO2; first-pass metabolism Life-threatening case with SQV/rtv Bradycardia, respiratory depression, seizures LSD (acid, blotters) Unknown Hallucinations, psychosis Ketamine (special K, Kit-Kat) 2B6>2C9, 3A4 Possible with RTV or EFV Respiratory depression, loss of consciousness, hallucinations Cocaine hydrolysis, hepatic cholinesterase >>CYP3A4 Possible norcocaine with NVP or EFV Hepatotoxicity PCP (angel dust) CYP3A4 Hypertermia, seizures, rhabdomyolysis Erectile disfunction (Sildenafil….) Hypotension, arrhytmias Amyl nitrite (poppers) glutathione-organic nitrates reductase Hypotension with erectile disfunction agents Antoniou et al. Ann Pharmacother 2002
 2D6>>1A2, 2B6, 3A4. 2-3 fold with RTV or EFV. Fatal interactions reported. Hyponatremia, hypertermia, arrhytmias, seizures, rhabdomyolysis. Amphetamines. (speed, cristal) 2D6. Possible with RTV. Hypertension, hypertermia, arrhytmias, seizures. GHB. (liquid ecstasy) Expired breath as CO2; first-pass metabolism. Life-threatening case with SQV/rtv. Bradycardia, respiratory depression, seizures. LSD. (acid, blotters) Unknown. Hallucinations, psychosis. Ketamine. (special K, Kit-Kat) 2B6>2C9, 3A4. Possible with RTV or EFV. Respiratory depression, loss of consciousness, hallucinations. Cocaine. hydrolysis, hepatic cholinesterase >>CYP3A4. Possible norcocaine with NVP or EFV. Hepatotoxicity. PCP. (angel dust) CYP3A4. Hypertermia, seizures, rhabdomyolysis. Erectile disfunction. (Sildenafil….) Hypotension, arrhytmias. Amyl nitrite. (poppers) glutathione-organic nitrates reductase. Hypotension with erectile disfunction agents. Antoniou et al. Ann Pharmacother")
19
Summary of Telaprevir – ARV interactions
HIV drug Effect on ARV AUC Effect on TVR AUC Can be used? Reference EFV* -7% -18% Yes Van Heeswijk et al. CROI 2011 ETR -6% -16% Kakuda et al. HIV PK 2012 RPV +79% -8% ATV/r +17% -20% DRV/r -40% -35% No FPV/r -47% -32% LPV/r +6% -54% RAL +31% +7% Van Heeswijk et al. ICAAC 2011 TDF +30% 0% Van Heeswijk et al. ICAAC 2008 *TVR dose 1125mg q8h

20
Summary of Boceprevir – ARV interactions
HIV drug Effect on ARV AUC Effect on BOC AUC Can be used? Reference TDF +5% +8% Yes Kassera et al. CROI 2011 EFV +20% -19% No ETR -23% +10% Hammond et al. JAIDS 2013 ATV/r -35% -5% Hulskotte et al. CID 2012 LPV/r -34% DRV/r -44% -32% RAL +1% +7%* De Kanter et al. CID 2012 ? * vs. historical controls

21
Epatite C e HIV: cenni Per una persona sieropositiva, che deve assumere una terapia per tutta la vita, prendersi cura del proprio fegato è una priorità. Il fegato è il principale organo deputato al metabolismo e alla detossificazione dai farmaci e, quindi, soggetto a danno da parte delle sostanze chimiche e farmacologiche da cui ci depura. Oggi esistono terapie che aumentano in modo sostanziale la possibilità di un successo terapeutico per la cura dell’epatite. Affiancare queste nuove terapie a combinazioni farmacologiche anti-HIV con scarse interazioni aumenta la probabilità dell’esito positivo di questo percorso, come ci dicono gli studi clinici sui farmaci anti-HIV di nuove classi (es.: INI).
.")
22
OUTLINE Epidemiology New antiretrovirals/drugs combination
Sources of information Manegement of DDIs

24
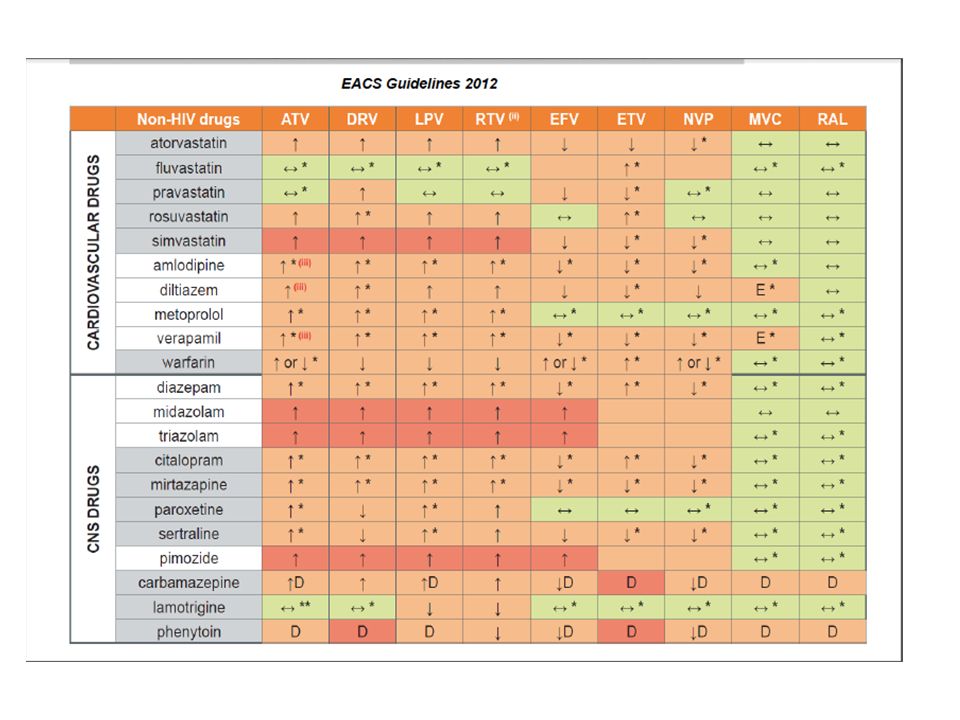
Statins and HAART: management of drug-drug interactions
Nachega JB et al AIDS 2012

25
Cardiovascular drugs and HAART: scarce data
Digoxin serum concentrations were increased by 86% with RTV coadministration due to inhibition of P- glycoprotein (NO DATA IN HIV+) Many antiarrhythmic medications are CYP450 3A4 substrates. The use of amiodarone, bepridil, flecainide, propafenone and quinidine are contraindicated with PI/r due to the potential risk of exacerbating cardiac arrhythmias (NO CLINICAL DATA).
 Many antiarrhythmic medications are CYP450 3A4 substrates. The use of amiodarone, bepridil, flecainide, propafenone and quinidine are contraindicated with PI/r due to the potential risk of exacerbating cardiac arrhythmias (NO CLINICAL DATA).")
26
CHECK EVERY KIND OF MEDICATION Check every route of administration
Corticosteroids Case report of Cushing’s syndrome and adrenal suppression in a patient on ATV/r and dexamethasone 0.1% eye drops1 Cushing’s syndrome reported with the use of intra articular triamcinolone injections in patients on boosted PIs2–4 Several cases of Cushing’s syndrome with inhaled fluticasone and ritonavir7 CHECK EVERY KIND OF MEDICATION Check every route of administration 1.Molloy A, et al. AIDS. 2011;25:1337–9. 2. Dort K, et al. AIDS Res Ther. 2009;6: Danaher PJ, et al. Orthopedics 2009;32: Ramanathan R, et al. Clin Infect Dis. 2008;47:e97–9. 5. Gray D, et al. S Afr Med J. 2010;100:296–7. 6. Frankel JK, & Packer CD. Ann Pharmacother. 2011;45:823– Foisy MM, et al. HIV Medicine 2008;9:389–96.

27
Le interazioni farmacologiche esistono e bisogna conviverci.
Il numero di possibili interazioni è altissimo, pertanto non è prevedibile avere dati certi di farmacocinetica per tutte le possibili interazioni. è importante per il clinico ma non è RISOLUTIVO.

28
OUTLINE Epidemiology New antiretrovirals/drugs combination
Sources of information Interpretation and management of DDIs HIV+ vs Healthy volunteers Interindividual variability Clinical significance New mechanisms?

29
PK differences (versus healthy volunteers)
Drug HIV-infected HIV/HCV co-infected* ATV ↓ (Reyataz SPC) ↑ (Regazzi et al. Ther Drug Monit 2011) ATV/r ↓ (Reyataz SPC) ↔ (Di Biagio et al. J Infect Chemother 2012) ↔ (Regazzi et al. Ther Drug Monit 2011) DRV/r ↑ (Prezista SPC) ↔† (Sekar et al. Clin Pharmacokinet 2010) ↑ RTV † (Sekar et al. Clin Pharmacokinet 2010) ↔ (Sekar et al. 11th EACS 2011) ↔ cirrhosis vs. historical controls (Curran et al. 13th WCPHT 2012) LPV/r ↔ (Kaletra SPC) ↔ (Barreiro et al. J Infect Dis 2007) ↑ (Peng et al. J Clin Pharmacol 2006) ↑ RTV (Peng et al. J Clin Pharmacol 2006) ↔ (Canta et al. JAC 2005) ↔ but ↑ V/F (Molto et al. Clin Pharmacokinet 2007) ↑ RTV, ↓ CL/F V/F (Molto et al. Clin Pharmacokinet 2007) ↔ (Seminari et al. JAC 2005) ↓ (Dominguez et al. JAC 2010) EFV ↓ (Mukonzo et al. Clin Pharmcokinet 2011) (Ugandan study) ↓ (Dupont review report 1998) (↔ Caucasian; ↓ Black) ↔ (Katsounas et al. Eur J Med Res 2007) ↔ (Pereira et al. BJCP 2008) ↑ cirrhosis versus no cirrhosis (Barreiro et al. J Infect Dis 2007) ↑ (Dominguez et al. JAC 2010) RAL ↓ (Arab-Alameddine et al. AAC 2012 ) ↔ (composite analysis, Merck) ↑ cirrhosis versus no cirrhosis (Hemandez-Novoa et al. 19th CROI 2012) ↔ Ұ (Iwamoto et al. AAC 2009) *Compared to HIV mono-infected; †Healthy individuals with & without mild/moderate hepatic impairment ҰHealthy individuals with and without moderate hepatic impairment
 ↑ (Regazzi et al. Ther Drug Monit 2011) ATV/r. ↓ (Reyataz SPC) ↔ (Di Biagio et al. J Infect Chemother 2012) ↔ (Regazzi et al. Ther Drug Monit 2011) DRV/r. ↑ (Prezista SPC) ↔† (Sekar et al. Clin Pharmacokinet 2010) ↑ RTV † (Sekar et al. Clin Pharmacokinet 2010) ↔ (Sekar et al. 11th EACS 2011) ↔ cirrhosis vs. historical controls (Curran et al. 13th WCPHT 2012) LPV/r. ↔ (Kaletra SPC) ↔ (Barreiro et al. J Infect Dis 2007) ↑ (Peng et al. J Clin Pharmacol 2006) ↑ RTV (Peng et al. J Clin Pharmacol 2006) ↔ (Canta et al. JAC 2005) ↔ but ↑ V/F (Molto et al. Clin Pharmacokinet 2007) ↑ RTV, ↓ CL/F V/F (Molto et al. Clin Pharmacokinet 2007) ↔ (Seminari et al. JAC 2005) ↓ (Dominguez et al. JAC 2010) EFV. ↓ (Mukonzo et al. Clin Pharmcokinet 2011) (Ugandan study) ↓ (Dupont review report 1998) (↔ Caucasian; ↓ Black) ↔ (Katsounas et al. Eur J Med Res 2007) ↔ (Pereira et al. BJCP 2008) ↑ cirrhosis versus no cirrhosis (Barreiro et al. J Infect Dis 2007) ↑ (Dominguez et al. JAC 2010) RAL. ↓ (Arab-Alameddine et al. AAC 2012 ) ↔ (composite analysis, Merck) ↑ cirrhosis versus no cirrhosis (Hemandez-Novoa et al. 19th CROI 2012) ↔ Ұ (Iwamoto et al. AAC 2009) *Compared to HIV mono-infected; †Healthy individuals with & without mild/moderate hepatic impairment. ҰHealthy individuals with and without moderate hepatic impairment.")
30
Physiological changes (versus healthy volunteers)
* Decreased albumin associated more with cirrhosis and significant liver damage † Significantly lower than HIV or HCV mono-infected patients 1Mehta SH, et al. AIDS Res Human Retrovir 2006;22:14–21; 2Graham SM, et al. AIDS Res Human Retrovir 2007;23:1197–1200 3Nagao Y & Sata M. Virology Journal 2010;7:375; 4Monga HK, et al. Clin Infect Dis 2001;33:240–7 ; 5Boffito M, et al. Drug Metab Dispos 2002;30:859–60; 6Ozeki T, et al. Br J Exp Path 1988;69:589–95 7Welage LS, et al. Clin Infect Dis 1995;21:1431–38; 8Nam YJ, et al. Korean J Hepatol 2004;10:216–22

31
DHHS Guidelines ( ): Rifabutin 150 mg (half dose) every other day or three times a week is recommended
: Rifabutin 150 mg (half dose) every other day or three times a week is recommended.")
32
10 patients with HIV infection and active tuberculosis
Lopinavir-ritonavir at, twice daily + rifabutin at 150 mg thrice weekly: 9 of 10 had low rifabutin Cmax values values for the area under the plasma concentration–time curve of rifabutinwere as low or lower than those associated with treatment failure or relapse and with acquired rifamycin resistance One of the 10 patients experienced relapse with acquired rifamycin resistance.

33
One concentration does not fit all patients!!
Time % Inhibiition IC50

34
Pravastatin and DRV/RTV
Patient Pravastatin AUC Ratio (+DRV:-DRV) 1 5.53 2 6.78 3 4.69 4 3.80 5 1.0 6 0.85 7 0.57 8 1.16 9 2.16 10 1.31 11 2.43 12 0.92 13 14 1.49 Mean, CI Mean, 1.81; 90% CI, 1.23, 2.66 Range 0.57, 6.78 Sekar VJ, et al. Pharmacology Workshop Abstract 55.
 Mean, CI. Mean, 1.81; 90% CI, 1.23, Range. 0.57, Sekar VJ, et al. Pharmacology Workshop Abstract 55.")
35
Statistical vs. Clinical Significance
A statistically significant effect may not be clinically relevant A clinically relevant PK interaction would require a dose modification/warning/contra-indication A consistent 10% decrease in AUC in 10 subjects is statistically significant (p<0.01), but not clinically relevant. Adapted from D Back
, but not clinically relevant. Adapted from D Back.")
36
Therapeutic window Narrow therapeutic window
Wide therapeutic window Adverse events Adverse events Drug concentration Drug concentration Therapeutic failure Therapeutic failure Adapted from D Back

37
Ci sono scenari clinici dove il valore aggiunto di QD e STR rispetto a schemi più complessi (BID o QD multipill) può essere controbilanciato da altri fattori? Farmaci concomitanti (QD o BID)? Tollerabilità a lungo termine?
 Tollerabilità a lungo termine")
38
(MK-###) (PN###) "CONFIDENTIAL - LIMITED ACCESS", Interim Deck-Expires when CSR Deck is Available
3/27/2017 2:54 AM Proportion (%) of Patients Achieving HIV RNA <50 copies/mL (95% CI) Over Time Non-Completer = Failure Approach 86 82 81 79 75 69 76 67 281 278 279 280 277 282 Raltegravir 400 mg bid. Efavirenz 600 mg qHS. 12 24 48 72 96 120 144 168 192 216 240 Weeks 20 40 60 80 100 Percent of Patients with HIV RNA Levels <50 Copies/mL Number of Contributing Patients 71% 61% White Template MASTER ppt 38
 of Patients Achieving HIV RNA <50 copies/mL (95% CI) Over Time. Non-Completer = Failure Approach Raltegravir 400 mg bid. Efavirenz 600 mg qHS Weeks Percent of Patients with. HIV RNA Levels <50 Copies/mL. Number of Contributing Patients. 71% 61% White Template MASTER ppt. 38.")
39
Yearly Efficacy Analyses
(MK-###) (PN###) "CONFIDENTIAL - LIMITED ACCESS", Interim Deck-Expires when CSR Deck is Available 3/27/2017 2:54 AM Yearly Efficacy Analyses Study Week % (n/N) of Patients with vRNA <50 copies/mL Change (cells/mm3) from BL CD4 Count RAL (N=281) EFV (N=282) RAL – EFV (95% CI) 48 86.1 (241/280) 81.9 (230/281) 4.2 (-1.9, 10.3)* 189 163 26 (4, 47) 96 81.1 (228/281) 78.7 (222/282) 2.4 (-4.3, 9.0)* 240 225 15 (-12, 43) 156 75.4 (212/281) 68.8 (194/282) 6.6 (-0.8, 14.0)* 331 295 36 (3, 68) 192 76.2 (214/281) 67.0 (189/282) 9.0 (1.6, 16.4)*° 361 301 60 (24, 95) 71.0 (198/279) 61.3 (171/279) 9.5 (1.7, 17.3)*° 374 312 62 (22, 102) * P-value for non-inferiority <0.001. ° Met criteria for superiority. n/N, number of pts with vRNA <50 c/mL over Number of evaluable pts at each time point. Non-Completer=Failure (NC=F): Pts who discontinued for any reason were considered as failures thereafter. ¶ Observed Failure (OF): Pts who discontinued for lack of efficacy were considered as virologic failures thereafter, & BL CD4 values were carried forward. Difference calculated as RAL minus EFV (95% CI). A positive value favors RAL over EFV. The treatment difference & 95% CIs were weighted proportionally by the size of screening HIV RNA stratum (> or ≤50,000 c/mL). Difference calculated as RAL minus EFV (95% CI). A positive value favors RAL over EFV. The 95% CIs were calculated based on a t-distribution. § RAL would be considered non-inferior to EFV if the lower bound of the 95% CI for the difference in response rates was above -12%, & superior to EFV if the entire 95% CI was >0. * P-value for non-inferiority <0.001. ° Met criteria for superiority. White Template MASTER ppt 39
 (PN###) CONFIDENTIAL - LIMITED ACCESS , Interim Deck-Expires when CSR Deck is Available. 3/27/2017 2:54 AM. Yearly Efficacy Analyses. Study Week. % (n/N) of Patients with vRNA <50 copies/mL. Change (cells/mm3) from BL CD4 Count. RAL (N=281) EFV (N=282) RAL – EFV (95% CI) (241/280) 81.9 (230/281) 4.2 (-1.9, 10.3)* (4, 47) (228/281) 78.7 (222/282) 2.4 (-4.3, 9.0)* (-12, 43) (212/281) 68.8 (194/282) 6.6 (-0.8, 14.0)* (3, 68) (214/281) 67.0 (189/282) 9.0 (1.6, 16.4)*° (24, 95) 71.0 (198/279) 61.3 (171/279) 9.5 (1.7, 17.3)*° (22, 102) * P-value for non-inferiority < ° Met criteria for superiority. n/N, number of pts with vRNA <50 c/mL over Number of evaluable pts at each time point. Non-Completer=Failure (NC=F): Pts who discontinued for any reason were considered as failures thereafter. ¶ Observed Failure (OF): Pts who discontinued for lack of efficacy were considered as virologic failures thereafter, & BL CD4 values were carried forward. Difference calculated as RAL minus EFV (95% CI). A positive value favors RAL over EFV. The treatment difference & 95% CIs were weighted proportionally by the size of screening HIV RNA stratum (> or ≤50,000 c/mL). Difference calculated as RAL minus EFV (95% CI). A positive value favors RAL over EFV. The 95% CIs were calculated based on a t-distribution. § RAL would be considered non-inferior to EFV if the lower bound of the 95% CI for the difference in response rates was above -12%, & superior to EFV if the entire 95% CI was >0. * P-value for non-inferiority < ° Met criteria for superiority. White Template MASTER ppt. 39.")
40
Sensitivity Analyses of Virologic Efficacy at Week 240
(MK-###) (PN###) "CONFIDENTIAL - LIMITED ACCESS", Interim Deck-Expires when CSR Deck is Available 3/27/2017 2:54 AM Sensitivity Analyses of Virologic Efficacy at Week 240 Different Approaches to Handling Missing Data Response by Treatment Group Treatment Effect Responder/Evaluable† Difference Estimates‡ RAL Group EFV Difference (95% CI) p-Value for Non-inferiority* Superiority Concluded* Prespecified as Primary Analysis Non-Completer=Failure 198/279 (71.0) 171/279 (61.3) 9.5 (1.7, 17.3) <0.001 Yes Prespecified as Secondary Analyses Treatment-Related D/C=Failure 198/236 (83.9) 171/239 (71.5) 12.4 (4.9, 19.8) Observed Failure 198/222 (89.2) 171/212 (80.7) 8.6 (1.9, 15.5) † Number of evaluable patients in each treatment group according to the specified approach to handling missing data. ‡ The 95% CIs and p-values for treatment differences were calculated using weights proportional to the size of each stratum (screening vRNA level >50,000 copies/mL or ≤50,000 copies/mL). * RAL would be considered non-inferior to EFV if the lower bound of the 95% CI for the difference in response rates was above -12%, and superior to EFV if the entire 95% CI was >0. Two post-hoc snapshot analyses with windows of +/- 6 weeks or +/- 12 weeks around the Week-240 visit were performed to test the robustness of the prespecified analyses: The 6-week window resulted in the additional exclusion of 8 patients falling outside of the window (6 came in too early and 2 came in too late) compared to the protocol-specified NC=F analysis which used the nominal visit data and yielded response rates of 66.2% (186/281) in the RAL group and 59.6% (168/282) in the EFV group with a ∆ (95% CI) = 6.6% (-1.4, 14.5). All 8 excluded patients were in the RAL group, with 7 having vRNA levels <50 copies/mL at their nominal Week-240 visit. Since more patients fell outside the 6-week window for the Week-240 visit compared to previous time points, an analysis using a +/- 12 weeks window (extending the window to the prior visit at Week 228) was untaken at Week 240 which yielded response rates of 70.8% (199/281) in the RAL group and 62.8% (177/282) in the EFV group with a ∆ (95% CI) = 8.1% (0.3, 15.8). † Number of evaluable patients in each treatment group according the specified approach to handling missing data. ‡ The 95% CIs and p-values for treatment differences were calculated using weights proportional to the size of each stratum (screening vRNA level >50,000 copies/mL or ≤50,000 copies/mL). * RAL would be considered non-inferior to EFV if the lower bound of the 95% CI for the difference in response rates was above -12%, and superior to EFV if the entire 95% CI was >0. Two post-hoc snapshot analyses with windows of +/- 6 weeks or +/- 12 weeks around the Week-240 visit were performed to test the robustness of the prespecified analyses: The 6-week window resulted in the additional exclusion of 8 patients falling outside of the window (6 came in too early and 2 came in too late) compared to the protocol-specified NC=F analysis which used the nominal visit data and yielded response rates of 66.2% (186/281) in the RAL group and 59.6% (168/282) in the EFV group with a ∆ (95% CI) = 6.6% (-1.4, 14.5). All 8 excluded patients were in the RAL group, with 7 having vRNA levels <50 copies/mL at their nominal Week-240 visit. For a long-term time point, the chance of falling outside a given window increases relative to earlier time points. Therefore, as there were a greater number of patients falling outside the 6-week window for the Week-240 visit compared to previous time points, an analysis using a +/- 12 weeks window (extending the window to the prior visit at Week 228) was untaken at Week 240 which yielded response rates of 70.8% (199/281) in the RAL group and 62.8% (177/282) in the EFV group with a ∆ (95% CI) = 8.1% (0.3, 15.8) . White Template MASTER ppt 40
 (PN###) CONFIDENTIAL - LIMITED ACCESS , Interim Deck-Expires when CSR Deck is Available. 3/27/2017 2:54 AM. Sensitivity Analyses of Virologic Efficacy at Week 240. Different Approaches. to Handling Missing Data. Response by Treatment Group. Treatment Effect. Responder/Evaluable† Difference Estimates‡ RAL. Group. EFV. Difference. (95% CI) p-Value for Non-inferiority* Superiority Concluded* Prespecified as Primary Analysis. Non-Completer=Failure. 198/279 (71.0) 171/279 (61.3) 9.5. (1.7, 17.3) < Yes. Prespecified as Secondary Analyses Treatment-Related D/C=Failure. 198/236 (83.9) 171/239 (71.5) (4.9, 19.8) Observed Failure. 198/222 (89.2) 171/212 (80.7) 8.6. (1.9, 15.5) † Number of evaluable patients in each treatment group according to the specified approach to handling missing data. ‡ The 95% CIs and p-values for treatment differences were calculated using weights proportional to the size of each stratum (screening vRNA level >50,000 copies/mL or. ≤50,000 copies/mL). * RAL would be considered non-inferior to EFV if the lower bound of the 95% CI for the difference in response rates was above -12%, and superior to EFV if the entire 95% CI was >0. Two post-hoc snapshot analyses with windows of +/- 6 weeks or +/- 12 weeks around the Week-240 visit were performed to test the robustness of the prespecified analyses: The 6-week window resulted in the additional exclusion of 8 patients falling outside of the window (6 came in too early and 2 came in too late) compared to the protocol-specified NC=F analysis which used the nominal visit data and yielded response rates of 66.2% (186/281) in the RAL group and 59.6% (168/282) in the EFV group with a ∆ (95% CI) = 6.6% (-1.4, 14.5). All 8 excluded patients were in the RAL group, with 7 having vRNA levels <50 copies/mL at their nominal Week-240 visit. Since more patients fell outside the 6-week window for the Week-240 visit compared to previous time points, an analysis using a +/- 12 weeks window (extending the window to the prior visit at Week 228) was untaken at Week 240 which yielded response rates of 70.8% (199/281) in the RAL group and 62.8% (177/282) in the EFV group with a ∆ (95% CI) = 8.1% (0.3, 15.8). † Number of evaluable patients in each treatment group according the specified approach to handling missing data. ‡ The 95% CIs and p-values for treatment differences were calculated using weights proportional to the size of each stratum (screening vRNA level >50,000 copies/mL or ≤50,000 copies/mL). * RAL would be considered non-inferior to EFV if the lower bound of the 95% CI for the difference in response rates was above -12%, and superior to EFV if the entire 95% CI was >0. Two post-hoc snapshot analyses with windows of +/- 6 weeks or +/- 12 weeks around the Week-240 visit were performed to test the robustness of the prespecified analyses: The 6-week window resulted in the additional exclusion of 8 patients falling outside of the window (6 came in too early and 2 came in too late) compared to the protocol-specified NC=F analysis which used the nominal visit data and yielded response rates of 66.2% (186/281) in the RAL group and 59.6% (168/282) in the EFV group with a ∆ (95% CI) = 6.6% (-1.4, 14.5). All 8 excluded patients were in the RAL group, with 7 having vRNA levels <50 copies/mL at their nominal Week-240 visit. For a long-term time point, the chance of falling outside a given window increases relative to earlier time points. Therefore, as there were a greater number of patients falling outside the 6-week window for the Week-240 visit compared to previous time points, an analysis using a +/- 12 weeks window (extending the window to the prior visit at Week 228) was untaken at Week 240 which yielded response rates of 70.8% (199/281) in the RAL group and 62.8% (177/282) in the EFV group with a ∆ (95% CI) = 8.1% (0.3, 15.8) . White Template MASTER ppt. 40.")
41
(MK-###) (PN###) "CONFIDENTIAL - LIMITED ACCESS", Interim Deck-Expires when CSR Deck is Available
3/27/2017 2:54 AM Subgroup Analyses White Template MASTER ppt 41

42
Specific Drug-Related Clinical Adverse Experiences Occurring in ≥ 5% of Either Group
RAL Group (N = 281) EFV Group (N = 282) n (%) Gastrointestinal Disorders 57 (20.3) 81 (28.7) Diarrhoea 14 ( 5.0) 27 ( 9.6) Flatulence 10 ( 3.6) Nausea 25 ( 8.9) 29 (10.3) General Disorders 28 (10.0) 47 (16.7) Fatigue 12 ( 4.3) Nervous System Disorders 51 (18.1) 140 (49.6) Dizziness 22 ( 7.8) 99 (35.1) Headache 26 ( 9.3) 40 (14.2) Somnolence 3 ( 1.1) 21 ( 7.4) Psychiatric Disorders 52 (18.5) 87 (30.9) Abnormal Dreams 19 ( 6.8) 37 (13.1) Insomnia ( 7.5) 23 ( 8.2) Nightmare 8 ( 2.8) 15 ( 5.3) Skin And Subcutaneous Tissue Disorders 16 ( 5.7) 63 (22.3) Rash
 EFV Group. (N = 282) n. (%) Gastrointestinal Disorders. 57. (20.3) 81. (28.7) Diarrhoea. 14. ( 5.0) 27. ( 9.6) Flatulence. 10. ( 3.6) Nausea. 25. ( 8.9) 29. (10.3) General Disorders. 28. (10.0) 47. (16.7) Fatigue. 12. ( 4.3) Nervous System Disorders. 51. (18.1) 140. (49.6) Dizziness. 22. ( 7.8) 99. (35.1) Headache. 26. ( 9.3) 40. (14.2) Somnolence. 3. ( 1.1) 21. ( 7.4) Psychiatric Disorders. 52. (18.5) 87. (30.9) Abnormal Dreams. 19. ( 6.8) 37. (13.1) Insomnia. ( 7.5) 23. ( 8.2) Nightmare. 8. ( 2.8) 15. ( 5.3) Skin And Subcutaneous Tissue Disorders. 16. ( 5.7) 63. (22.3) Rash.")
43
Patients who tolerated EFV, with less than 50 copies/ml HIV-RNA, were randomized into two groups: the RAL-first group started with RAL (400 mg twice daily) and EFV placebo, and the EFV- first group with EFV (600 mg once daily) and RAL placebo. After 2 weeks, both groups switched to the alternate regimen. Half of patients previously on a stable EFV preferred to switch to RAL, after double-blind exposure to RAL for 2 weeks. Substitution of EFV by RAL significantly impacted on lipid levels, stress, and anxiety scores.

44
Altri esempi Studio STaR (Glasgow, Cohen O425)
Spring 2 e Single (Glasgow, Eron P204) Sailing (Atlanta, Croi 2013, Pozniak 179 LB)
 Sailing (Atlanta, Croi 2013, Pozniak 179 LB)")
45
Grazie al contributo di MSD Italia

Presentazioni simili


>")


