Scaricare la presentazione
La presentazione è in caricamento. Aspetta per favore

1
QUARTA SETTIMANA Dal 2 al 3 marzo 2015

2
1.Ruolo e funzionamento dei mercati finanziari 2.Equilibrio e efficienza dei mercati 3.I tassi corporate 4.Tassi a lunga nella zona-Euro e negli USA 5.Aspettative e comunicati della Banca Centrale 6.Il mercato del future sull'euribor e la BCE 7.Bolle e mode (Camerer) 8.La caduta dei prezzi azionari di fine millennio 9.Bolle finanziarie e psicologia umana 10.Effetto delle aspettative eterogenee
 8.La caduta dei prezzi azionari di fine millennio 9.Bolle finanziarie e psicologia umana 10.Effetto delle aspettative eterogenee")
3
Casi in cui non vale l’efficienza valutativa (e in certi casi anche informativa) Bolle razionali di rendimenti Mode di opinioni di utilità Macchie solari Bolle informative
 Bolle razionali di rendimenti Mode di opinioni di utilità Macchie solari Bolle informative")
5
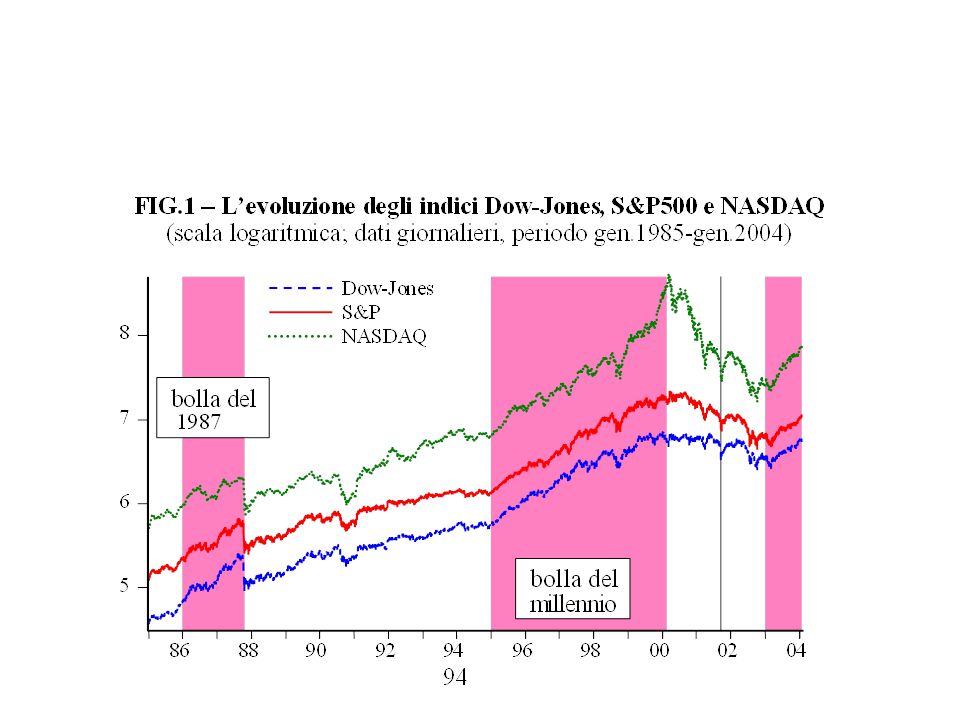
Un esempio di (probabile) bolla. L’andamento dell’indice S&P ind. 500la caduta del prezzo (-20,5%) è avvenuta in pochi minuti il 19 ott. 1987 (“lunedì nero”) nel biennio 2006-2007 la caduta del prezzo (-20,5%) è avvenuta in pochi minuti il 19 ott. 1987 (“lunedì nero”)
 è avvenuta in pochi minuti il 19 ott ( lunedì nero ) nel biennio la caduta del prezzo (-20,5%) è avvenuta in pochi minuti il 19 ott ( lunedì nero ).")
6
Come si individua la presenza di una bolla? Premesso che individuare la presenza di una bolla non è agevole perché non è sempre distinguibile da altre irregolarità dei prezzi si possono dare alcune indicazioni:

7
A proposito della stima del fondamentale si dimostra che la formula V t = + + + + … può essere approssimata da: E t [D t+1 ] E t [D t+2 ] E t [D t+3 ] E t [D t+4 ] (1+r t ) (1+r t ) 2 (1+r t ) 3 (1+r t ) 4 D N t r t – g N t Dove D t N è la stima in t del livello del dividendo “normale” dell’esercizio t (= al netto delle componenti transitorie), g t N è la crescita attesa tendenziale dei dividendi
![A proposito della stima del fondamentale si dimostra che la formula V t = … può essere approssimata da: E t [D t+1 ] E t [D t+2 ] E t [D t+3 ] E t [D t+4 ] (1+r t ) (1+r t ) 2 (1+r t ) 3 (1+r t ) 4 D N t r t – g N t Dove D t N è la stima in t del livello del dividendo normale dell’esercizio t (= al netto delle componenti transitorie), g t N è la crescita attesa tendenziale dei dividendi](http://images.slideplayer.it/11/3274766/slides/slide_7.jpg "A proposito della stima del fondamentale si dimostra che la formula V t = … può essere approssimata da: E t [D t+1 ] E t [D t+2 ] E t [D t+3 ] E t [D t+4 ] (1+r t ) (1+r t ) 2 (1+r t ) 3 (1+r t ) 4 D N t r t – g N t Dove D t N è la stima in t del livello del dividendo normale dell’esercizio t (= al netto delle componenti transitorie), g t N è la crescita attesa tendenziale dei dividendi")
8
Quest’ultima formula è equivalente a: V t = = D t N U t N r t – g N t r t – g′ N t Dove U t N è la stima in t del livello dell’utile “normale” dell’esercizio t (= al netto delle componenti transitori, g’ N t è la crescita attesa tendenziale “autonoma” (o “naturale”) degli utili (= crescita depurata per l’effetto del’autofinanziamento e dell’aumento dell’indebitamento)
 degli utili (= crescita depurata per l’effetto del’autofinanziamento e dell’aumento dell’indebitamento)")
9
Da questa relazione si ricava anche: D t N / V t = r t – g D,t N U t N / V t = r t – g′ Ut N E ipotizziamo (ipotesi nulla H0) che il prezzo sia uguale al fondamentale. Respingeremo poi quest’ipotesi se è palesemente contraddetta dai dati

10
P V ? (P non significativamente diverso da V) Oppure P V ? (P significativamente diverso da V) Se U t N / V t = r t – g′ Ut N U t N / P t ? Se U t N / P t è nell’intervallo di confidenza della stima r t – g′ Ut N di U t N / V t accettiamo l’potesi di P t = V t Altrimenti analizziamo la differenza U t N / P t - r t – g′ Ut N e cerchiamo di capire che cosa è successo
 Se U t N / V t = r t – g′ Ut N U t N / P t . Se U t N / P t è nell’intervallo di confidenza della stima r t – g′ Ut N di U t N / V t accettiamo l’potesi di P t = V t Altrimenti analizziamo la differenza U t N / P t - r t – g′ Ut N e cerchiamo di capire che cosa è successo.")
16
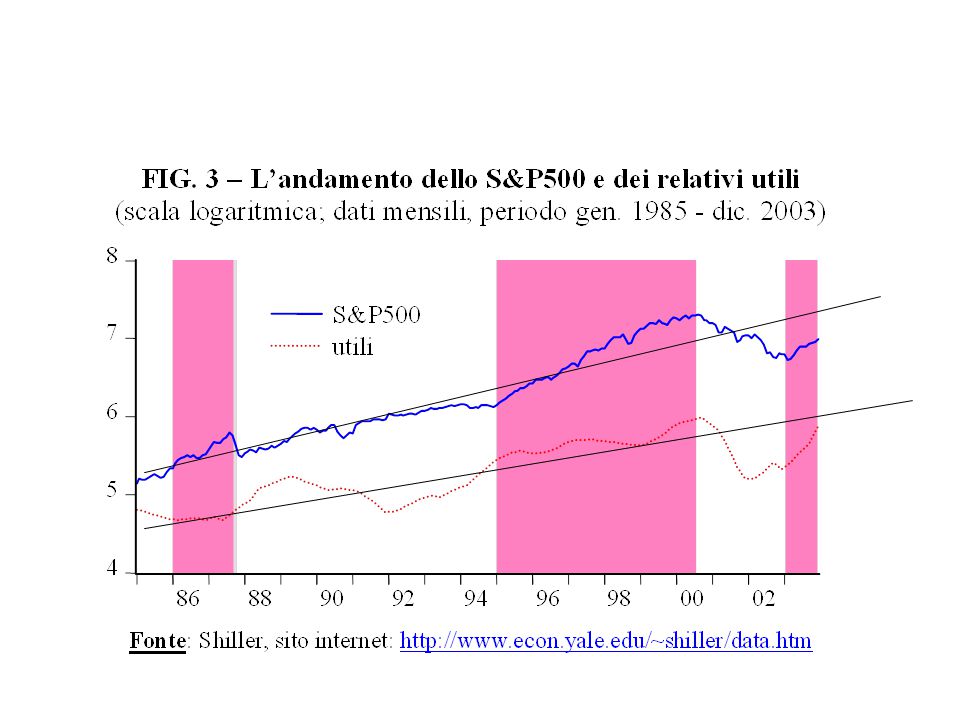
Dal questo grafico a scala logaritmica risulta che il prezzo è effettivamente più legato agli utili «normali» che a quelli correnti

17
fine

18
1.Ruolo e funzionamento dei mercati finanziari 2.Equilibrio e efficienza dei mercati 3.I tassi corporate 4.Tassi a lunga nella zona-Euro e negli USA 5.Aspettative e comunicati della Banca Centrale 6.Il mercato del future sull'euribor e la BCE 7.Bolle e mode (Camerer) 8.La caduta dei prezzi azionari di fine millennio 9.Bolle finanziarie e psicologia umana
 8.La caduta dei prezzi azionari di fine millennio 9.Bolle finanziarie e psicologia umana")
19
“bolla” del millennio e psicologia degli azionisti (R. Shiller) Others sharply disagree with these bubble stories, and it is precisely this intimation of foolishness that seems to bother them. It seems to them just implausible that investors at large have been foolish. Rather, it seems to them that the high valuations the market has placed on the stock market recently can be attributed to actions of rational investors who are wrestling with hard-to-interpret evidence about such issues as how much recent technological innovations will promote future economic growth. Suggesting that investors at large have been irrational seems arrogant and presumptuous.
 Others sharply disagree with these bubble stories, and it is precisely this intimation of foolishness that seems to bother them. It seems to them just implausible that investors at large have been foolish. Rather, it seems to them that the high valuations the market has placed on the stock market recently can be attributed to actions of rational investors who are wrestling with hard-to-interpret evidence about such issues as how much recent technological innovations will promote future economic growth. Suggesting that investors at large have been irrational seems arrogant and presumptuous..")
20
One of the most important arguments that it is not foolishness that has brought us the high valuations in the aggregate market is to observe the decisions of some of the most august of investors, the real experts. One may note, for example, that those who manage university endowments had not withdrawn en masse from the stock market before its peak in March 2000.

21
Despite these arguments against calling a bubble, in my recent book Irrational Exuberance I do argue that there has indeed been a speculative bubble in the stock market in recent years. But I argue that the kind of less-than-perfectly- rational behavior that underlies it is not abject foolishness (cioè, non è stata una vera “bolla razionale”, ma è stata comunque una bolla speculativa che, anche se non del tipo “razionale” non è dovuta a stupidità) Moreover, I do not think that it is presumptuous of me (or anyone else) to argue that human error in evaluating the available facts has created the high market valuations, and to argue that it is an error that infects the thinking of some of the most intelligent people in our society.
 Moreover, I do not think that it is presumptuous of me (or anyone else) to argue that human error in evaluating the available facts has created the high market valuations, and to argue that it is an error that infects the thinking of some of the most intelligent people in our society..")
22
There are many aspects to intuitive probability. One of them is the representativeness heuristic, identified originally by Tversky and Kahneman (1974). They showed that in forming subjective judgments, people have a tendency to disregard base rate probabilities [= le reali probabilità], and to make judgments solely in terms of observed similarities to familiar patterns.
. They showed that in forming subjective judgments, people have a tendency to disregard base rate probabilities [= le reali probabilità], and to make judgments solely in terms of observed similarities to familiar patterns..")
23
I think we can say that investors have overconfidence in a complex culture of intuitive judgments about expected future price changes, and an excessive willingness to act on these judgments.

24
Psychologists have documented that there is a social basis for attention, that is, people tend to pay attention to what others are paying attention to. Not surprisingly, speculative assets whose price has gone up a lot recently gather a great deal of attention. People are more likely to buy assets that have their attention just because they are thinking about them more. Assets that have not had big price increases are less likely to garner the attention.

25
Another part of the mechanism by which the past price increases affect the judgments that are actually made about investing for the future have to do with the feelings of confidence and self esteem that past successes in investing has given successful investors. Success in investing usually involves some acquired skills in understanding the particular category of investment and in the strategy of dealing with it. Acquiring such skills regarding that category increases demand for it. Psychologists Heath and Tversky (1991) have shown through experiments that holding probabilities constant people prefer to bet in situations in which their perceived competence is high.
 have shown through experiments that holding probabilities constant people prefer to bet in situations in which their perceived competence is high..")
26
After a bubble has continued for a while, there are many people who have committed themselves to the investments, emotionally as well as financially.

27
Investing for the long term means judging the distant future, judging how history will be made, how society will change, how the world economy will change. Reaching decisions about such issues cannot proceed from analytical models alone; there has to be a major input of judgment that is essentially personal and intellectual in origin. With such a confusion of factors, it is hard for anyone to make objective judgments without being influenced by the recent success behavior of the market and the recent success of investments.

28
The complex judgment that portfolio managers must make about these factors, in turn, is inevitably influenced by the judgments of others. In making major allocation decisions, one almost inevitably winds up trusting to a common view or consensus view about the future. Professionals ultimately must end up generally assuming that what their colleagues believe is true.

29
The news media play a prominent role in generating our conventional wisdom, more so among nonprofessionals, but among investment professionals as well. And the news media are themselves in a fiercely competitive business for survival as news media. They cannot be indifferent to the public resonance with the stories they write. They therefore help reinforce a conventional wisdom in some dimensions, and help change it in others.

30
Stock market price increases generate news stories about new era theories just as much as the news stories themselves do. Stories about new era economics surged around 1997

31
If one believes in efficient markets, one believes that the marketplace of ideas somehow works out optimally, and hence, by inference one might suppose that the prominent theories that appear to move investors’ decisions are based on the best possible information too.

32
Irving Janis, in his book Groupthink about professionals’ herd behavior, refers to a number of reasons why professionals operating in groups may be unwilling to deviate from the group consensus. His book reviewed a number of case studies in which professional groups made serious errors. Janis refers to a tendency for people to try to conform to the consensus of the group in order to preserve their status within the group.

33
In judging whether the stock market remains a good investment despite high price earnings ratios, organizations must somehow judge whether we are entering a new era as some claim. Organizations are fundamentally ill-equipped to make such judgments, just as organizations are ill-equipped to write books on history.

34
One reason that institutional investors may not do better is that they feel that they are dealing with clients who have expectations of them that make it difficult to pursue their own best judgment. The clients expect them to invest in accordance with certain fads. Another reason I believe that the differences are so small is that institutional investors do not feel that they have the authority to make trades in accordance with their own best judgments. Their obediance to conventional wisdom hampers their investment ability. Psychologists have argued that human thinking that leads to action, even individual human thinking, tends to be motivated by qualitative reasons and justifications, rather than abstract weighing of probabilities and scenarios.

35
fine

36
1.Ruolo e funzionamento dei mercati finanziari 2.Equilibrio e efficienza dei mercati 3.I tassi corporate 4.Tassi a lunga nella zona-Euro e negli USA 5.Aspettative e comunicati della Banca Centrale 6.Il mercato del future sull'euribor e la BCE 7.Bolle e mode (Camerer) 8.La caduta dei prezzi azionari di fine millennio 9.Bolle finanziarie e psicologia umana 10.Effetto delle aspettative eterogenee
 8.La caduta dei prezzi azionari di fine millennio 9.Bolle finanziarie e psicologia umana 10.Effetto delle aspettative eterogenee")
37
E t [P t+1 + D t+1 ] P t 1 + E t [r t ] Supponiamo per semplicità che dividendo e tasso siano nulli E t [P t+1 + D t+1 ] P t = E t [P t+1 ] 1 + E t [r t ]
![ E t [P t+1 + D t+1 ] P t 1 + E t [r t ] Supponiamo per semplicità che dividendo e tasso siano nulli E t [P t+1 + D t+1 ] P t = E t [P t+1 ] 1 + E t [r t ]](http://images.slideplayer.it/11/3274766/slides/slide_37.jpg " E t [P t+1 + D t+1 ] P t 1 + E t [r t ] Supponiamo per semplicità che dividendo e tasso siano nulli E t [P t+1 + D t+1 ] P t = E t [P t+1 ] 1 + E t [r t ]")
38
P t = E t [P t+1 ] P t – P t-1 = E t [P t+1 ] – P t-1 P t = E t [P t+1 ] – P t-1 Da che cosa dipendono le aspettative dei vari individui h, E t,h [P t+1 ], la cui media ponderata corrisponde a E t [P t+1 ] ???
![P t = E t [P t+1 ] P t – P t-1 = E t [P t+1 ] – P t-1 P t = E t [P t+1 ] – P t-1 Da che cosa dipendono le aspettative dei vari individui h, E t,h [P t+1 ], la cui media ponderata corrisponde a E t [P t+1 ]](http://images.slideplayer.it/11/3274766/slides/slide_38.jpg "P t = E t [P t+1 ] P t – P t-1 = E t [P t+1 ] – P t-1 P t = E t [P t+1 ] – P t-1 Da che cosa dipendono le aspettative dei vari individui h, E t,h [P t+1 ], la cui media ponderata corrisponde a E t [P t+1 ]")
39
Una soluzione semplice è supporre che esistano due categorie di individui e ciascuna categoria basi le sue previsioni su un tipo di modello diverso da quello dell’altra categoria Perché questo è importante?

40
Andamento del Dow Jones

41
Variazioni del Dow Jone

42
Istogramma delle variazioni del Dow Jones

43
Problemi della mancata considerazione dell’eterogeneità delle aspettative The empirical literature demonstrates that very often the macroeconomics fundamentals are not able to explain the large and persistent movements of some economic variables such as securities prices or exchange rates.

44
Principali casi di eterogeneità nelle aspettative (1) rational and irrational agents (De Long et al. 1990, 1991), (2) informed versus uninformed agents (Genotte and Leland, 1990; Lyons, 1991), (3) chartists versus fundamentalists (Frankel and Froot, 1988; De Grauwe, 1993) (4) sophisticated versus naive agents (Day and Huang, 1990).
, (2) informed versus uninformed agents (Genotte and Leland, 1990; Lyons, 1991), (3) chartists versus fundamentalists (Frankel and Froot, 1988; De Grauwe, 1993) (4) sophisticated versus naive agents (Day and Huang, 1990)..")
45
La difficoltà di conoscere come funzione il mondo Indeed, the literature on bounded rationality [= razionalità limitata] has put forward two important criticisms. It is unrealistic to assume that agents know the “economic model”; it seems more reasonable to assume that their expectations are based on time series observations. It has been shown that, in several economic areas, naïve forecasting tends to give more accurate predictions than forecasts based on models even if it cannot as a rule predict turning point. The agents also need to have perfect knowledge about the beliefs of all the other agents in the economy to coordinate their actions on the same RE [RE=sigla per “aspettative razionali”]
![La difficoltà di conoscere come funzione il mondo Indeed, the literature on bounded rationality [= razionalità limitata] has put forward two important criticisms.](http://images.slideplayer.it/11/3274766/slides/slide_45.jpg "It is unrealistic to assume that agents know the economic model ; it seems more reasonable to assume that their expectations are based on time series observations. It has been shown that, in several economic areas, naïve forecasting tends to give more accurate predictions than forecasts based on models even if it cannot as a rule predict turning point. The agents also need to have perfect knowledge about the beliefs of all the other agents in the economy to coordinate their actions on the same RE [RE=sigla per aspettative razionali ].")
46
Cambio dollaro/euro 1 Gen.2006 30 Giu. 2006

47
Challenging the RE [=aspettative razionali] hypothesis leads to two questions. The first question is how we should model expectations given the fact that it is hard to observe or obtain information about [other] individual expectations in real markets. The second question is whether heterogeneity in expectations does contribute to excess price volatility as that observed in stock market or exchange rate. In other words, the question is whether agents are able to learn and coordinate on a RE equilibrium in a heterogeneous world.
![Challenging the RE [=aspettative razionali] hypothesis leads to two questions.](http://images.slideplayer.it/11/3274766/slides/slide_47.jpg "The first question is how we should model expectations given the fact that it is hard to observe or obtain information about [other] individual expectations in real markets. The second question is whether heterogeneity in expectations does contribute to excess price volatility as that observed in stock market or exchange rate. In other words, the question is whether agents are able to learn and coordinate on a RE equilibrium in a heterogeneous world..")
48
on which criteria we could distinguish between both groups of agents. Evidence from survey data shows that: at short horizons, respondents tend to forecast by extrapolating recent trends (es. analisi tecnica) while at long horizons they tend to forecast a return to a long-run equilibrium (esempio: analisi del fondamentale) Con quali criteri si possono distinguere le diverse classi di agenti
 while at long horizons they tend to forecast a return to a long-run equilibrium (esempio: analisi del fondamentale) Con quali criteri si possono distinguere le diverse classi di agenti.")
49
Therefore, they associated the longer-term expectations, which are consistently stabilizing, with the fundamentalists, and the short-term forecasts, which seem to have a destabilizing nature, with the chartists.

50
The behaviour of both groups can be explained in two ways: First, both groups behave in different manner because they have different information sets. Therefore, each agent is acting rationally subject to certain constraints. Even when agents have the same information set they may act differently. This may be the case because either they draw a different set of inferences from the same information set or they have different goals, including different attitudes to contending with risk or uncertainty.

51
Aspettativa dei fondamentalisti sul prezzo futuro: Fundamentalists look for fundamental determinants of the price. They calculate an equilibrium price p * consistent with these fundamentals, and expect that the current price will gradually move towards its equilibrium value: p ^f t = p t-1 + f(p * - p t-1 ) (p ^f t - p t-1 ) = f(p * - p t-1 ) Ma: (p ^f t - p t-1 ) ≡ Δp ^f t (variazione attesa del prezzo per i fondamentalisti), da cui: Δp ^f t = f(p * - p t-1 )
 (p ^f t - p t-1 ) = f(p * - p t-1 ) Ma: (p ^f t - p t-1 ) ≡ Δp ^f t (variazione attesa del prezzo per i fondamentalisti), da cui: Δp ^f t = f(p * - p t-1 ).")
52
Aspettative dei chartisti sul prezzo futuro Chartists base their forecasts on technical analysis, which is mainly a study of past prices to detect patterns that can be projected in the future. They use various extrapolative models that can be summarised under the following general formulation: p ^c t = φ (p t-1, p t-2, …) Ovvero: Δ p ^c t = Φ(p t-1, p t-2, …)
 Ovvero: Δ p ^c t = Φ(p t-1, p t-2, …).")
53
Aspettive medie del mercato The change in the price expected by the market can be written as a weighted average of the two groups’ expectations: p ^ t = α t p ^f t + (1- α t ) p ^c t (date le aspettative il prezzo di equilibrio non è univoco: dipende dalle percentuali α t ) Ovvero, in termini di variazione (il prezzo passato lo conoscono tutti): Δp ^ t = α t Δp ^f t + (1- α t ) Δp ^c t ( α è il peso sei fondamentalisti)
 p ^c t (date le aspettative il prezzo di equilibrio non è univoco: dipende dalle percentuali α t ) Ovvero, in termini di variazione (il prezzo passato lo conoscono tutti): Δp ^ t = α t Δp ^f t + (1- α t ) Δp ^c t ( α è il peso sei fondamentalisti)")
54
Come varia la % α t ? If α is constant over time, this means that the weight of the two groups remains the same However, much evidence supports the possibility of switching: Once the weighting factor α is admitted to be able to vary, it remains to explain how it could change. Several strategies have been adopted.

55
La % delle varie classi the proportion of each class of agents fluctuates due to mimetic contagion phenomena. The probability of switching from one group to the other can be formalize as a stochastic process of random meetings (Kirman, 1993; Topol, 1991) or can be grounded on microeconomic foundations (Orlean, 1995, Lux, 1995,1998, Laurent, 1995). This strategy is based on endogenous switching. Several cases are possible.
 or can be grounded on microeconomic foundations (Orlean, 1995, Lux, 1995,1998, Laurent, 1995). This strategy is based on endogenous switching. Several cases are possible..")
56
1.Portfolio managers are considered to be the only persons who actually buy and sell on the market. They form their expectations as a weight average of chartists and fundamentalists. Therefore, they update the weights over time according to whether the fundamentalists or the chartists have recently been doing the better forecasting. 2.The second case is derived from Frankel and Froot (1990a) and from the empirical observation that the relative weight of the two groups depends on the forecasting horizons. For shorter forecasting horizons, more weight is placed on chartists while the opposite is true for longer forecasting horizons. 3.When the price deviates from the equilibrium value (in one sense or the other), the two groups of fundamentalists and chartists are numerically different so their excess demand is not nil and then they influence the price.
 and from the empirical observation that the relative weight of the two groups depends on the forecasting horizons. For shorter forecasting horizons, more weight is placed on chartists while the opposite is true for longer forecasting horizons. 3.When the price deviates from the equilibrium value (in one sense or the other), the two groups of fundamentalists and chartists are numerically different so their excess demand is not nil and then they influence the price..")
57
Nel terzo caso quindi: Their weight is thus an increasing function of the deviation of the price from its equilibrium value: α t = 1/[(1 + (p t-1 - p * ) 2
 2 ")
58
ESEMPIO DI Simulazione per il cambio s Expectations formation Fundamentalists’ forecast: E f,t (∆s t+1 ) = - ψ(s t – s * t ) Chartists’ forecast E c,t (∆s t+1 ) = βΣ T i=0 α i ∆s t-i
 = - ψ(s t – s * t ) Chartists’ forecast E c,t (∆s t+1 ) = βΣ T i=0 α i ∆s t-i")
59
The role of transaction Costs (per i fondamentalisti) If s t - s * t < C then E f,t (∆s t+1 ) = 0 If s t - s * t > C then fundamentalists’ forecast rule applies Attenzione: C può essere interpretato non solo come un costo di transazione ma anche come un “intervallo di incertezza” in cui giace il fondamentale
 If s t - s * t < C then E f,t (∆s t+1 ) = 0 If s t - s * t > C then fundamentalists’ forecast rule applies Attenzione: C può essere interpretato non solo come un costo di transazione ma anche come un intervallo di incertezza in cui giace il fondamentale")
60
Quindi: E f,t (∆s t+1 ) = - ψ(s t – s * t ) se abs[- ψ(s t – s * t )]>C altrimenti E f,t (∆s t+1 ) =0
![Quindi: E f,t (∆s t+1 ) = - ψ(s t – s * t ) se abs[- ψ(s t – s * t )]>C altrimenti E f,t (∆s t+1 ) =0](http://images.slideplayer.it/11/3274766/slides/slide_60.jpg "Quindi: E f,t (∆s t+1 ) = - ψ(s t – s * t ) se abs[- ψ(s t – s * t )]>C altrimenti E f,t (∆s t+1 ) =0")
61
Numero chartisti e fondamentalisti nel tempo Learning the forecasting rules Number of chartists and fundamentalists is endogenous Probabilities of switching Pp fc t = ….. (probability of switching from fundamentalists to chartists) Pp cf t = ….. (probability of switching from chartists to fundamentalists) Probabilities of switching are determined by relative utilities of chartists and fundamentalists
 Pp cf t = ….. (probability of switching from chartists to fundamentalists) Probabilities of switching are determined by relative utilities of chartists and fundamentalists.")
62
Risultato delle simulazioni Fondamentale poco variabile (da +2 a -4 circa) Fondamentale molto variabile (da +35 a -25 circa)
 Fondamentale molto variabile (da +35 a -25 circa)")
63
Conseguenze… Fat tails exchange rate returns exhibit fat tails compared to the normal distribution. This has been observed first by Mandelbrot for prices of commodities. Our model mimicks this empirical regularity We also find excess kurtosis, which is declining with time aggregation This has also been found in reality Thus exchange rate movements in normal times are small Once in a while there is turbulence in the market Our model generates this dynamics.

64
Esempio del cambio PPP-dynamics (= valore di equlibrio del fondamentale) is a strong force Thus, the relation between exchange rate and fundamentals dominates; there is little complexity When shocks are small, exchange rates are mostly within transactions cost band PPP-dynamics (= valore di equlibrio del fondamentale) is weak force Chartist behaviour becomes important because link between exchange rate and fundamental is weak The interaction between fundamentalist and chartist forecasts creates strong non-linearity and thus complexity These features of the dynamics of exchange rates have been confirmed empirically
 is a strong force Thus, the relation between exchange rate and fundamentals dominates; there is little complexity When shocks are small, exchange rates are mostly within transactions cost band PPP-dynamics (= valore di equlibrio del fondamentale) is weak force Chartist behaviour becomes important because link between exchange rate and fundamental is weak The interaction between fundamentalist and chartist forecasts creates strong non-linearity and thus complexity These features of the dynamics of exchange rates have been confirmed empirically")
65
When there are few chartists (a lot of fundis), –profitability of chartism is low; –profitability of fundamentalism is high When number of chartists increase relative to number of fundis –Profitability of chartism increases exponentially –Profitability of fundamentalism collapses
, –profitability of chartism is low; –profitability of fundamentalism is high When number of chartists increase relative to number of fundis –Profitability of chartism increases exponentially –Profitability of fundamentalism collapses")
66
There seems to be a self-fullfilling evolutionary dynamics An invasion by chartists creates noise around the fundamental; Noise is what chartists thrive on. Thus the invasion creates the conditions that makes chartism profitable, reinforcing the attraction. Chartists create informational environment which makes it rational to use chartists’ rules. … ma se il prezzo si allontana troppo dal fondamentale aumentano I fondamentalisti e quindi… This does not lead to corner solution, though, because risk also increases when chartists become more numerous.

67
(Al diminuire della % di fondamentalisti il prezzo diventa più slegato dal fondamantale)
")
68
(Al crescere del costo di transazione il prezzo si allontana maggiormente dal fondamentale) -20 -10 0 10 20 30 102030405060708090100110 PREZZOFONDAMENTALE Costo = 0 -20 -10 0 10 20 30 102030405060708090100110 costo = 40 % fondamentalisti = 50%, b=0.8
 PREZZOFONDAMENTALE Costo = costo = 40 % fondamentalisti = 50%, b=0.8")
69
(Nel lungo periodo il prezzo diventa meno slegato dal fondamentale)
")
70
FINE Della quarta settimana

Presentazioni simili