Scaricare la presentazione
La presentazione è in caricamento. Aspetta per favore

1
Alle radici del declino italiano: il persistere del dualismo Roma, 18 aprile 2013 Stefano Prezioso

2
Italian dualism: Centre- North and Mezzogiorno What do we mean for Mezzogiorno? We mean the problems of the Italian south -eight regions, that are Abruzzo, Molise, Puglia, Campania, Basilicata, Calabria, including Sardinia and Sicily. This means that more than 40% of Italian territory and more than a third of Italys population: 123 thousand square kilometers on total 301,336; 20 million 913 thousand inhabitants on more than 60 million (34,5%).
..")
3
1. La rottura del processo di convergenza 2. La relazione tra disuguaglianza e crescita 3. Linadeguatezza delle politiche di sviluppo

4
ECONOMIC DUALISM: GDP GAP PER INHABITANT The MEZZOGIORNOS GDP IS ABOUT 58,4% THAN THAT OF the CENTRE- NORTH

5
GDP per capite (Ue=100) Regions Convergence and regions Competitiveness in some European countries
 Regions Convergence and regions Competitiveness in some European countries")
6
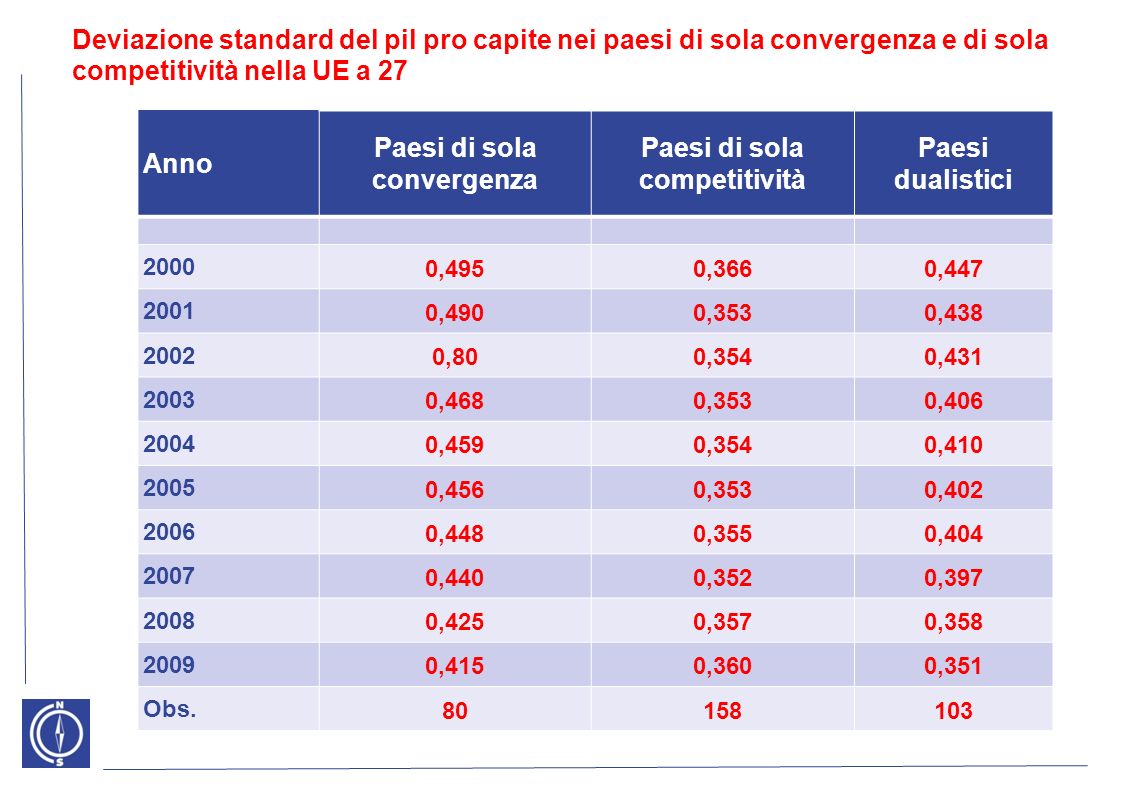
Deviazione standard del pil pro capite nei paesi di sola convergenza e di sola competitività nella UE a 27 Anno Paesi di sola convergenza Paesi di sola competitività Paesi dualistici 2000 0,4950,3660,447 2001 0,4900,3530,438 2002 0,800,3540,431 2003 0,4680,3530,406 2004 0,4590,3540,410 2005 0,4560,3530,402 2006 0,4480,3550,404 2007 0,4400,3520,397 2008 0,4250,3570,358 2009 0,4150,3600,351 Obs. 80158103
7
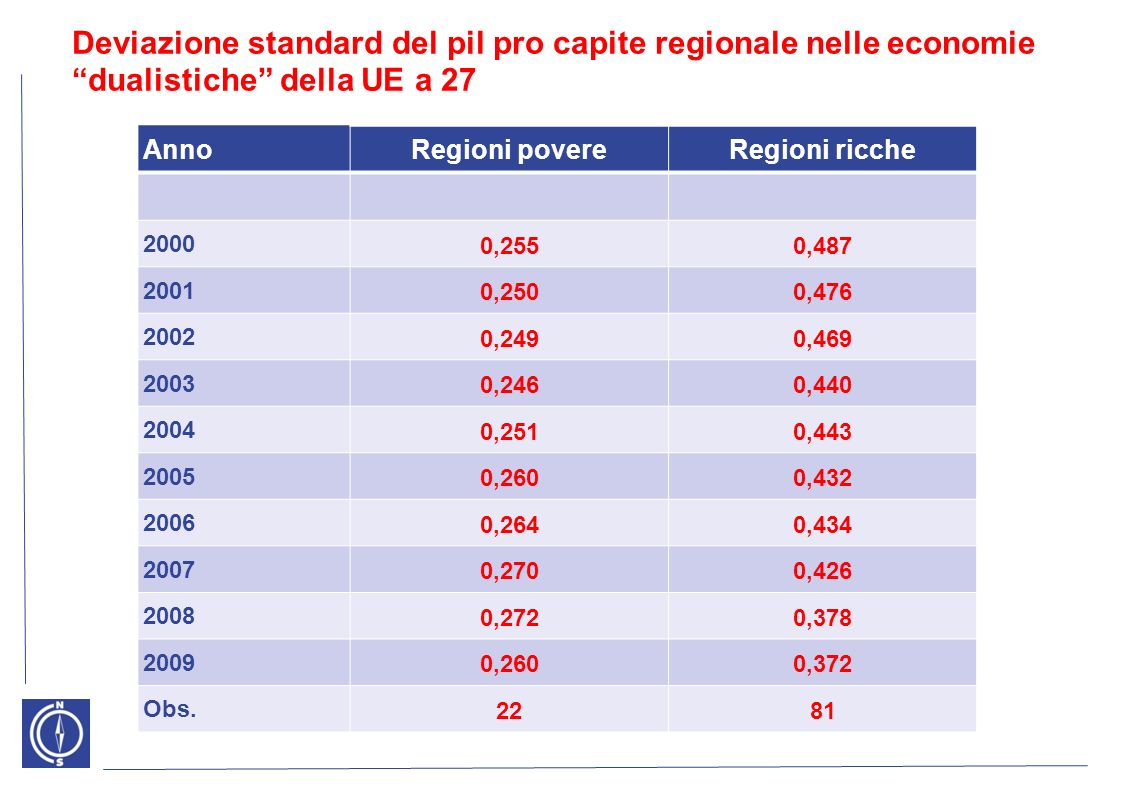
Deviazione standard del pil pro capite regionale nelle economie dualistiche della UE a 27 AnnoRegioni povereRegioni ricche 2000 0,2550,487 2001 0,2500,476 2002 0,2490,469 2003 0,2460,440 2004 0,2510,443 2005 0,2600,432 2006 0,2640,434 2007 0,2700,426 2008 0,2720,378 2009 0,2600,372 Obs. 2281
8
Pil pro capite e tasso di crescita paesi europei dualistici Paesi dualisticiPIL Pro capite (2000)Tasso di crescita Austria Alto Reddito (AR) 25.3590021 Austria Basso Reddito (BR) 15.5970,029 Belgio AR 23.8580,023 Belgio BR 15.8360,017 Italia AR 24.2570,016 Italia BR 14.5700,013 Germania AR 23.4760,021 Germania BR 15.3550,024 UK AR 21.4860,019 UK BR 14.5120,026 Spagna AR 20.6060,042 Spagna BR 14.5970,045 Portogallo AR 19.5270,036 Portogallo BR 13.8930,027 Grecia AR 19.3820,023 Grecia BR 14.4710,031
Tasso di crescita Austria Alto Reddito (AR) Austria Basso Reddito (BR) ,029 Belgio AR ,023 Belgio BR ,017 Italia AR ,016 Italia BR ,013 Germania AR ,021 Germania BR ,024 UK AR ,019 UK BR ,026 Spagna AR ,042 Spagna BR ,045 Portogallo AR ,036 Portogallo BR ,027 Grecia AR ,023 Grecia BR ,031")
9
GDP (Annual average changes*, % ) 2001-20072008200920102011 Mezzogiorno 0.9-1.7-5.10.60.1 Centre-North 1.2-1.2-5.42.00.6 Italy 1.1-1.3-5.31.70.4 *Calculated on chained values– base year 2000
 Mezzogiorno Centre-North Italy *Calculated on chained values– base year 2000")
10
Table 1. Recovery from GDP crisis (a) Countries and macro-regions Growth rate 2007-2011 Difference with respect to 2007 Mezzogiorno -1.6-6.1 Centre-North -4.1 Italy -1.2-4.6 Euro-zone -0.2-0.9 Germany 0.50.9 France 0.10.3 Spain -0.7-2.7 (a) At constant prices, chained values– base year 2000
 Countries and macro-regions Growth rate Difference with respect to 2007 Mezzogiorno Centre-North -4.1 Italy Euro-zone Germany France Spain (a) At constant prices, chained values– base year")
11
The crisis has shown the effects of a long phase in which public policies seemed to have missed their target of reducing inequality of incomes and opportunities among citiziens, which is central to activate stable growth processes. In light of this, it is possible to read the economic and social recession of the mezzogiorno, the Italian south. But we can also draw important policy implications in this particular moment of ever-tightening fiscal policy measures. JOB EMERGENCY AND SOCIAL DYNAMICS: THE YOUNG AND WOMEN CONDITION

12
JOB EMERGENCY: HALF MILLION OF JOB LOSSES First quarter 2008 – First quarter 2012 -536,000 -366,000 to the SOUTH (-5.5%) -366,000 to the SOUTH (-5.5%) -169,000 to the NORTH (-1.0%) -169,000 to the NORTH (-1.0%) 27% employed 69% job losses 27% employed 69% job losses 73% employed 31% job losses 73% employed 31% job losses
 -366,000 to the SOUTH (-5.5%) -169,000 to the NORTH (-1.0%) -169,000 to the NORTH (-1.0%) 27% employed 69% job losses 27% employed 69% job losses 73% employed 31% job losses 73% employed 31% job losses")
13
Employment change by age categories (First quarter 2008 – First quarter 2012) Age groups MezzogiornoCentre-NorthItaly aged 15-34 years -433,000 (-21%) -927, 000 (-17.9%) -1.36 m (-18.8%) aged 35 years and over +67,000 (+1.5%) +758,000 (+6.4%) + 825,000 (+5%) JOB EMERGENCY: YOUNG PEOPLE CONDITION
 Age groups MezzogiornoCentre-NorthItaly aged years -433,000 (-21%) -927, 000 (-17.9%) m (-18.8%) aged 35 years and over +67,000 (+1.5%) +758,000 (+6.4%) + 825,000 (+5%) JOB EMERGENCY: YOUNG PEOPLE CONDITION")
14
Employment Rate (aged 15-34 years) Average EU (25) * 54.5% France52.9% UK62.3% Spain45.6% Germany63.5% Turkey43.7% Holland73.8% * I quarter 2012 II quarter 2008 II quarter 2012 Mezzogiorno37.2%31.3% Centre-North60.3%52.0% Italy51.2%43.9%
 Average EU (25) * 54.5% France52.9% UK62.3% Spain45.6% Germany63.5% Turkey43.7% Holland73.8% * I quarter 2012 II quarter 2008 II quarter 2012 Mezzogiorno37.2%31.3% Centre-North60.3%52.0% Italy51.2%43.9%")
15
ARRESTO NEL PROCESSO DI SVILUPPO E DISEGUAGLIANZA

16
Le regioni del Mezzogiorno più povere e più disuguali La disuguaglianza dei redditi nelle regioni italiane

17
Il rischio povertà: le famiglie in bilico % delle famiglie per classi di reddito Meno di 1000 mensili Tra 1000 e 1500 mensili Più di 3000 mensili Mezzogiorno18,019,721,7 Centro-Nord7,312,540,2 Quota dei lavoratori esposti al rischio povertà per settore Mezzogiorno Centro- Nord Lavoratori dipendenti19,6%4,6% di cui: pubblici9,0%1,6% privati29,6%7,3%

18
Le nuove povertà: anche gli occupati sono sempre più a rischio MezzogiornoCentro-Nord Fino alla scuola dellobbligo39,8%14,8% Media superiore25,3%7,5% Laurea9,4%4,0% Quota dei lavoratori esposti al rischio povertà per titolo di studio MezzogiornoCentro-Nord 1 percettore51,6%28,6% 2 percettori27,6%6,6% Quota delle famiglie esposte al rischio povertà per percettori di reddito

19
CAUSE STRUTTURALI NELLARRESTO DEL PROCESSO DI CONVERGENZA

20
Value added per hour worked. Index number 2000=100 in the business sector (a) (a) Industry and service sector
 (a) Industry and service sector.")
21
Productivity (a) in the manufacturing from 2000 to 2009, index number 2000=100 (a)Value added computed on chained prices per hour worked
 in the manufacturing from 2000 to 2009, index number 2000=100 (a)Value added computed on chained prices per hour worked")
22
One of the most important theoretical and empirical framework within economic growth studies is the extended family of endogenous growth models, the so-called AK model, i.e.: Y = AK[1] In the case we consider explicitly the labour input, the production function (1) can be written as: Y/L = Y/K * K/L [2] Thus, the productivity of an economic system can be expressed in terms of capital endowment (K/L, or capital intensity) and efficiency (Y/K) AK MODEL
![One of the most important theoretical and empirical framework within economic growth studies is the extended family of endogenous growth models, the so-called AK model, i.e.: Y = AK[1] In the case we consider explicitly the labour input, the production function (1) can be written as: Y/L = Y/K * K/L [2] Thus, the productivity of an economic system can be expressed in terms of capital endowment (K/L, or capital intensity) and efficiency (Y/K) AK MODEL](http://images.slideplayer.it/2/936531/slides/slide_22.jpg "One of the most important theoretical and empirical framework within economic growth studies is the extended family of endogenous growth models, the so-called AK model, i.e.: Y = AK[1] In the case we consider explicitly the labour input, the production function (1) can be written as: Y/L = Y/K * K/L [2] Thus, the productivity of an economic system can be expressed in terms of capital endowment (K/L, or capital intensity) and efficiency (Y/K) AK MODEL")
23
Theoretical background -Technical progress function (TPF) by Kaldor
 by Kaldor")
24
log(y_h) = a + b log(k) + c log(Y) + dLRun(-1) [3] where: y_h:value added per hour worked k: capital/labour ratio Y: value added and the term Lrun = log(y_h) – (α + β log(k)) [2] is the long-run term linking the productivity growth to the rise of capital/labour ratio. This variable provides an indication of structural dynamics of an economy, i.e. it indicates the absorptive capacity and diffusion of a technical progess that can be available (movements of the function y_h = f(k) up and down of the 45° line). ESTIMATED MODEL (ECM)
![log(y_h) = a + b log(k) + c log(Y) + dLRun(-1) [3] where: y_h:value added per hour worked k: capital/labour ratio Y: value added and the term Lrun = log(y_h) – (α + β log(k)) [2] is the long-run term linking the productivity growth to the rise of capital/labour ratio.](http://images.slideplayer.it/2/936531/slides/slide_24.jpg "This variable provides an indication of structural dynamics of an economy, i.e. it indicates the absorptive capacity and diffusion of a technical progess that can be available (movements of the function y_h = f(k) up and down of the 45° line). ESTIMATED MODEL (ECM).")
25
Cointegration analysis between log (y_h) and log (k) CoefficientT-Statistics Centre-North Constant< 2001 -7,71-65,7 Constant> 2002 -7,74-63,1 Log k 0,7133,2 Mezzogiorno Constant< 1995 -8,68-22,9 Constant> 1996 -6,63-5,9 Log k < 1995 0,8212,2 Log k > 1996 0,472,5
 and log (k) CoefficientT-Statistics Centre-North Constant< ,71-65,7 Constant> ,74-63,1 Log k 0,7133,2 Mezzogiorno Constant< ,68-22,9 Constant> ,63-5,9 Log k < ,8212,2 Log k > ,472,5")
26
ECM equation relative to the hourly productivity in the business sector (a) in the Centre- North and Mezzogiorno of Italy Centre-NorthMezzogiorno Constant -0,01 (-1,86) -0,01 (-1,91) log Y 0,67 (4,38) 0,67 (6,85) log k 0,48 (2,74) 0,57 (3,87) Lrun (-1) -0,51 (-3,68) -0,45 (-2,94) Dummy 1985 -0,017 (-8,25) Dummy 1994 0,022 (7,36) Dummy 1998 -0,017 (-2,8) Dummy 1999 -0,009 (-2,63) Dummy 2000 -0,022 (4,499) (a) Industry and service sector
 in the Centre- North and Mezzogiorno of Italy Centre-NorthMezzogiorno Constant -0,01 (-1,86) -0,01 (-1,91) log Y 0,67 (4,38) 0,67 (6,85) log k 0,48 (2,74) 0,57 (3,87) Lrun (-1) -0,51 (-3,68) -0,45 (-2,94) Dummy ,017 (-8,25) Dummy ,022 (7,36) Dummy ,017 (-2,8) Dummy ,009 (-2,63) Dummy ,022 (4,499) (a) Industry and service sector")
27
45° y_h k Mezzogiorno Centre-North 1995/962001/02 A graphical representation of the results from estimated ECM equation

28
The value linking the output–Verdoon coefficient– to the (hourly) productivity takes, in both macro- regions, relatively higher values and, most importantly, they are quite similar. The error correction term comes, in fact, from residuals of a long-run relationship with splines, in Mezzogiorno, both in the constant, and in the Centre-North, and in coefficients of y_h and k, differently from the other macro-region. Results

29
Centre-North: the break in the constant is indicative of a competitive shock which worked on the absolute size of the system, but not on the main relations within the system (2001 is the year where competitive pressure from abroad show up). Mezzogiorno: the full break shows up between the end of Extraordinary Measure and the beginning of a new Policy (New Programme, 1998): the loss of policy effectiveness in stimulating the accumulation process. (Between 1991 and 1995 gross investments in the South fell down of about 16 billions of euros, which is equal to 1/3 of the level recorded in 1991, which will not be reached anymore).
: the loss of policy effectiveness in stimulating the accumulation process. (Between 1991 and 1995 gross investments in the South fell down of about 16 billions of euros, which is equal to 1/3 of the level recorded in 1991, which will not be reached anymore)..")
30
CAUSE MICRO NELLARRESTO DEL PROCESSO DI CONVERGENZA

31
Drivers of economic growth in manufacturing after the euro

32
Product innovation / export. Values of firm population in manufacturing North-westNorth-EastCentreSouth 41.6%36.6%14.8%7.0% Number of manufacturing firms active in 2007: 513,337 (ISTAT). 2004-2006: the percentage of firms reporting product innovation is around 11,8% (about 61 thousand firms). North-westNorth-EastCentreSouth 39.8%29.0%19.3%11.9% Number of exporting firms up to 2006: 87,444 (ISTAT), about 16.8% of total firms
 : the percentage of firms reporting product innovation is around 11,8% (about 61 thousand firms). North-westNorth-EastCentreSouth 39.8%29.0%19.3%11.9% Number of exporting firms up to 2006: 87,444 (ISTAT), about 16.8% of total firms.")
33
Accelerare il grado di apertura del Mezzogiorno per rompere limmobilità del sistema meridionale INTEGRAZIONE INTERNAZIONALIZZAZIONE ACCESSIBILITA PERIFERICITA PROMOZIONE DELLEXPORT ATTRAZIONE DEGLI INVESTIMENTI

34
DEBOLEZZA STRUTTURALE DELLEXPORT MERIDIONALE Quota % per settore alla Pavitt MEZZOGIORNOCENTRO-NORD 2003-20052006-20072003-20052006-2007 Tradizionali25,7%19,6%27,8%25,4% Di scala54,1%60,9%36,5%38,7% Specialistici8,5%8,9%23,5%24,8% Alta tecnologia11,7%10,6%12,1%11,1% INTERNAZIONALIZZAZIONE

35
ATTRAZIONE DEGLI INVESTIMENTI DIRETTI ESTERI IDE SU INVESTIME NTI TOTALI IDE PER ABITANTE (2002-2006) ITALIA 6,6% 253 SPAGNA 6,8% 490 FRANCIA 14,6% 608 REGNO UNITO 32,1% 1.200 UE a 27 680 IDE Mezzogiorno 12 Centro-Nord241 DISTRIBUZIONE TERRITORIALE INTERNAZIONALIZZAZIONE
 ITALIA 6,6% 253 SPAGNA 6,8% 490 FRANCIA 14,6% 608 REGNO UNITO 32,1% UE a IDE Mezzogiorno 12 Centro-Nord241 DISTRIBUZIONE TERRITORIALE INTERNAZIONALIZZAZIONE")
36
South (divergence) Causes of integration processes: «greater disparity in regional growth rates, because with increased factor mobility regions will tend to adjust to shocks by adding or shedding resources rather than by adding or shedding industries» (Krugman, 1999). Centre-North (numerically limited adjustment) Strategies based on more than one competitive drivers. Among them, innovation and internationalisation drivers play a crucial role and are the most effective. (In 2001, the macro-region North-West is better placed in such endowments). Chance of asymmetric shocks
 Strategies based on more than one competitive drivers. Among them, innovation and internationalisation drivers play a crucial role and are the most effective. (In 2001, the macro-region North-West is better placed in such endowments). Chance of asymmetric shocks.")
37
What happened in 2009 : in front of a fall in exports oscillating among 20% and 24% in the main macro-regions, the output slowdown in manufacturing showed an equal intensity, around 15 percentage points. Here we recall that, concerning the degree of openess on global markets, the South (8%) is about one-third of the corresponding value we observe in the two macro-regions of the North (around 22%). The global market for manufacturing firms located in the South is historically of small size, and it remained unchanged. Meanwhile the domestic market, the most commonly-used market, has shrunk. Drastic slowdown of the competitive force of the Mezzogiorno
 is about one-third of the corresponding value we observe in the two macro-regions of the North (around 22%). The global market for manufacturing firms located in the South is historically of small size, and it remained unchanged. Meanwhile the domestic market, the most commonly-used market, has shrunk. Drastic slowdown of the competitive force of the Mezzogiorno.")
38
Changes of residence: Mezzogiorno 114,000 40% of graduated (scientific subjects) people Long-ray commuters: Mezzogiorno 134,000 A restart of migration flows comparable to that reported in 1950- 1960s Dati 2010
 people Long-ray commuters: Mezzogiorno 134,000 A restart of migration flows comparable to that reported in s Dati 2010")
39
LINEFFICACIA DELLE POLITICHE

40
SPESA DELLA P.A. IN CONTO CAPITALE NEL MEZZOGIORNO 20002001200220032004200520062007 Miliardi di euro 2007 ORDINARIA11,49,313,013,411,3 11,810,2 PER LE AREE SOTTOUTIL.10,515,111,210,411,010,710,912,1 COMPLESSIVA21,924,424,323,822,322,122,722,3 In % dellItalia ORDINARIA27,022,226,326,123,423,924,5 21,4 PER LE AREE SOTTOUTIL.75,281,883,379,278,878,079,3 78,1 COMPLESSIVA39,040,438,536,835,936,036,8 35,3 Superiamo i luoghi comuni: Non è vero che la spesa per le politiche di coesione sia enorme e crescente

41
Alcuni esempi di carenza nei servizi ordinari nel Mezzogiorno % di famiglie che denunciano irregolarità nella distribuzione dellAcqua: 21,8% nel Sud, oltre il 30% in Calabria e Sicilia; 9% nel Centro-Nord Interruzioni servizio elettrico per utente: 78 minuti nel Sud contro 28 min. nel Nord % anziani con assistenza domiciliare integrata: 1,7% nel Mezzogiorno, 1% in Campania e Calabria contro il 5,6% dellEmilia, il 5,1% del Veneto. Solo il 10,2% dei rifiuti al Sud è oggetto di raccolta differenziata contro il 33% del Centro-Nord, oltre il 40% in Trentino, Lombardia, Veneto,

42
Rimane un enorme problema di qualità della spesa. La quantità è rilevante seppur in deciso calo negli ultimi anni. 1.Regioni senza adeguate competenze interne cui sono stati affidati troppi poteri, con pochi controlli ed esclusivamente di carattere procedurale; 2. Incapacità di coordinamento tra Regioni e tra Regioni e Amministrazione centrali soprattutto sui grandi progetti infrastrutturali; 3.Eccessiva frammentazione degli interventi; 4.difficoltà nel seguire la tempistica imposta dallUnione in termini di pesa e conseguente largo uso di progetti sponda

Presentazioni simili

 Brussels, 26 settembre 2013.>")


