Scaricare la presentazione
La presentazione è in caricamento. Aspetta per favore

1
The epidemic of coeliac disease years Celiacs/1000

2
8 CD without GFD diagnosed before 2000 Tissue transglutaminase testing 6403 sera 134 tTg+ ( > 7) 3 tTg - (5.1-6.9), EMA + 6 CD diagnosed between 2000 and 2002 120 antibody + 33tTg > 7, EMA – 87 tTG > 7, EMA 123 individuals to be biopsied 81 (66%) aggred on biopsy 17 (14%) refused 21 (17%) could be not be traced 4 (3%) had died after serum sampling 40 biopsied so far Comunità Europea 2000 PREVALENZA 1: 49
 3 tTg - ( ), EMA + 6 CD diagnosed between 2000 and antibody + 33tTg > 7, EMA – 87 tTG > 7, EMA 123 individuals to be biopsied 81 (66%) aggred on biopsy 17 (14%) refused 21 (17%) could be not be traced 4 (3%) had died after serum sampling 40 biopsied so far Comunità Europea 2000 PREVALENZA 1: 49")
3
Prevalence of coeliac disease among 5055 pregnant women TGASE UnitsnEMA + EMA - DQ 2 DQ 8 DQ2/ 8 DQ2/ 8- DIAGNOSI S RATE TGASE > 9 UI 48 4241148 Coeliac >7 TGASE< 9 UI 103741-56 Coeliacs >5 TGASE<7 UI 200 61 132 Coeliacs TGASE < 54977 Negative TOTAL50555127506220 New cases 56 Known cases 12 Known12 1:4,6 1:74 TUTTA LA CAMPANIA 2000

4
ANNO 2006 1:33 1:41 1:60 1:50 Tunisia 1: 45

5
epilessia Lesioni smalto dentario esofagite cardiomiopatia pancreatite diabete colite ulcere amenorrea Dermatite Erpetiforme artrite anemia neurite distrofia nefrite diarrea epatite gastrite tiroidite iridociclite atassia

6
www.medicel.unina.it
7
Prevalence of Celiacs Regions Estimated Celiacs today at 1% Estimated celiac children today at 1% Projected celiac children in 10 years Projected prevalence of CD in next 10 yrs North1.627.090257.033251.1871.662.444 N.East140.18423.68023.176143.553 M.East847.870204.665221.224928.135 East330.13832.684113.367390.329 South1.611.407461.245528.1151.871.015 MED tot 4.556.689979.3071.040.2204.995.476

8
But know how and diagnostic facilities VERY different Most patients cared for appropriately Few patients cared for well Care very occasional, start after 6 years ! What about the infants ? Malta

9
Excess mortality of undiagnosed celiacs Regions Death rate deaths/ 1,000 population Population Expected Deaths next 10 y Celiacs Deaths Next 10 y Excess Death in Celiacs next 10 yr North9,815.762.925289.149128.511 N.East8,71.231.96122.56110.027 M.East7,85.585.422109.33748.594 East5,11.444.60430.59013.596 South4,67.678.427160.44871.310 MED tot 7,231.703.339612.086272.038

10
Costs of undiagnosed celiac disease Regions Cost for adult k€ Cost for children k€ Total Cost Adult next 10 y k€ Total Cost Children next 10 yr k€ TOTAL Cost Symptomat ic next 10 yr k€ North12.53.62.528.223 186.5172.714.740 N.East7.12.0116.258 8.708124.966 M.East8.22.4589.492 69.734659.227 East6.21.8174.475 26.119200.595 South3.10.9 485.65178.068563.720 MED3.894.101 369.1484.263.250

11
Expected N. of Cases, Health Cost and related Deaths

12
WE ARE NOT ALL BORN FOR GLUTEN! rice corn Millet sorgum wheat

13
Diffusion of agricolture and wheat

16
Consumption of wheat per capita (Kcal/Day)
")
17
Rise in the consumption of wheat flour

18
Pasta consumption in the E.U. (1990 - 2008)
")
19
CONSUMPTION OF PASTA PER CAPITA Italy 28.0 kg Tunisia 11.7 kg Greece 9.6 kg France 7.3 kg Turkey 5.6 kg Spain 4.7 kg Israel 4.0 kg Libya 2.0 kg Egypt 1.2 kg Production of pasta in the world Italy 3.191.505 t Turkey 566.303 t Egypt 400.000 t France 241.121 t Spain 224.000 t Greece 151.000 t Tunisia 110.000 t Syria 9.005 t

20
Pasta in the favourite dish of the Maltese people, according to the first survey of eating habits issued today by the Malta Standards Authority. Pasta is the favourite for both lunch and dinner, followed by chicken and beef, in that order, also for lunch and dinner. Tuesday, January 18, 2011, 15:17 CELIAC DISEASE INMALTA2013-2023 Adult Celiac today4035 Adult celiac by 20234200 Children celiac today653 Children Celiac by 2023680 Excess deaths by 2023282 Cost of missed diagnosis€5.000.000

21
DQ2-8 DR3-7 Chrom 5q31-33 CTLA4 Chrom 19p13.1 MIC-A-B / TNF Chrom 11, 9, 15 HLA DR Extended Carmela è ….. …ggeniale !! E centinaia? di altri geni ad effetto minore

22
TRE DOMINII FUNZIONALI CORRELATI

23
What is the message by genome wide studies ? ? There are no missing or defecting genes : gene function normally There is a bunch of advantageous immuno genes : our native antibiotics ! Celiac associated genes are mostly those commonly involved in the complex immuno- response Celiac share many genes with other auto- immune diseases European Laboratory for Food Induced Research Federico II

24
Which genes explain the strong heredity of CD ?

25
Who explains the missing 50% of the hereditary transmission (variance) ? Nature Genetics, May 2012, 483 MalattiaEreditarietà% Varianza spiegata N. di Polimorfismi SNPs Celiachia0,5-0,8744% (40-47)2550 Diabete0,2-0,6949% (46-53)2919 Artrite Reumatoide 0,53-0,6818% (15-20)2231 Infarto0,3-0,6348% (43-54)1766 More than two and half thousands of polymorphisms in very common genes with a very very low risk : from 1,001 to 1,1 : almost indistinguishable diseases versus healthy, but observable with 10.000 samples !
2550 Diabete0,2-0,6949% (46-53)2919 Artrite Reumatoide 0,53-0,6818% (15-20)2231 Infarto0,3-0,6348% (43-54)1766 More than two and half thousands of polymorphisms in very common genes with a very very low risk : from 1,001 to 1,1 : almost indistinguishable diseases versus healthy, but observable with samples !.")
26
There will be an 1% difference between them ? !!!!

27
Ready ??? This is physiology ??? European Laboratory for Food Induced Diseases We have to choose some of them !

28
Il Pathway del c-Rel in NF-KB GLUTINE ? COMPLESSO DI ATTIVAZIONE NUCLEARE NF_kB

29
Integration of immunological pathways and celiac disease (CD)-associated genes into a model of CD pathogenesis. The figure is subdivided into three distinct anatomical regions in which T cell differentiation (thymus), T cell polarization (inductive site), and effector immune response (effector site) take place. Genes associated with CD by genome-wide association studies are listed in red according to their potential implication in distinct immunological pathways. THEMIS and RUNX3 are involved in the thymic differentiation of CD4 and CD8 T cells, respectively. Dendritic cells located in the lamina propria acquire a proinflammatory phenotype upon viral recognition (TLR7/8 and IRF4) and migrate to the mesenteric lymph nodes (inductive site). There, they present gluten peptides (HLA-DQA1, HLA-DQB1, and CIITA) to naive CD4 T cells and promote T cell activation (e.g., CD28, CD80, CTLA4, CD247, PTPN2, SH2B3, TAGAP, IL2, and FASLG) and differentiation into inflammatory effector T cells (IL12A, IL18R1, IL18RAP, IL1RL1, and IL1RL2). In addition, transglutaminase 2 (TG2) and gluten-specific B cells (that have internalized gluten-TG2 complexes) receive help from gluten-specific T cells, become activated, and differentiate into immunoglobulin (Ig)A- and IgG-producing plasma cells (ICOS, ICOSLG, IL21, and RGS1). Other genes regulate activation and migration of cytotoxic intraepithelial lymphocytes (IELs) (MAP3K7, IL-21, CCR9, and RGS1). Finally, some genes are involved in cell migration [e.g., genes coding for chemokine receptors (CCRs) and ITGA4], and others regulate tumor necrosis factor (TNF)-dependent pathways (TNFAIP3, TNFSF4, TNFSF18, TNFRSF9, and TNFRSF14). Even though their genes have not been identified by genetic studies, interleukin (IL)-15 and interferon (IFN)-α play a critical role in orchestrating the immune responses that lead to CD pathogenesis. IL-15 upregulates activating natural killer cell (NK) receptors and licenses IELs to kill epithelial cells, whereas IFN-α promotes the differentiation of proinflammatory dendritic cells. Abbreviations: HLA, human leukocyte antigen; TGF, transforming growth factor; Th, T helper cell. RGS1 : controls the homing of IEL
, T cell polarization (inductive site), and effector immune response (effector site) take place. Genes associated with CD by genome-wide association studies are listed in red according to their potential implication in distinct immunological pathways. THEMIS and RUNX3 are involved in the thymic differentiation of CD4 and CD8 T cells, respectively. Dendritic cells located in the lamina propria acquire a proinflammatory phenotype upon viral recognition (TLR7/8 and IRF4) and migrate to the mesenteric lymph nodes (inductive site). There, they present gluten peptides (HLA-DQA1, HLA-DQB1, and CIITA) to naive CD4 T cells and promote T cell activation (e.g., CD28, CD80, CTLA4, CD247, PTPN2, SH2B3, TAGAP, IL2, and FASLG) and differentiation into inflammatory effector T cells (IL12A, IL18R1, IL18RAP, IL1RL1, and IL1RL2). In addition, transglutaminase 2 (TG2) and gluten-specific B cells (that have internalized gluten-TG2 complexes) receive help from gluten-specific T cells, become activated, and differentiate into immunoglobulin (Ig)A- and IgG-producing plasma cells (ICOS, ICOSLG, IL21, and RGS1). Other genes regulate activation and migration of cytotoxic intraepithelial lymphocytes (IELs) (MAP3K7, IL-21, CCR9, and RGS1). Finally, some genes are involved in cell migration [e.g., genes coding for chemokine receptors (CCRs) and ITGA4], and others regulate tumor necrosis factor (TNF)-dependent pathways (TNFAIP3, TNFSF4, TNFSF18, TNFRSF9, and TNFRSF14). Even though their genes have not been identified by genetic studies, interleukin (IL)-15 and interferon (IFN)-α play a critical role in orchestrating the immune responses that lead to CD pathogenesis. IL-15 upregulates activating natural killer cell (NK) receptors and licenses IELs to kill epithelial cells, whereas IFN-α promotes the differentiation of proinflammatory dendritic cells. Abbreviations: HLA, human leukocyte antigen; TGF, transforming growth factor; Th, T helper cell. RGS1 : controls the homing of IEL.")
30
LPP – LIM – Domain Translocation Partner involved in cell-cell adhesion and cell motility. Lpp -/- mouse fibroblasts exhibited reduced migration capacity, reduced viability, and reduced expression of some Lpp interaction partners. Vervenne et al., 2009 An intracellular vescicles transporter !

31
ChrSNPLocusA1A2 CD cases, Controls Ratios MAF CD MAF Controls χ2χ2 p- value OR (95% CI) 1rs2816316RGS1AC1092:182,1169:2530.140.186.100.01351.299 (1.055-1.598) 2rs917997IL18RAPGA965:309, 1092:3300.240.230.4080.52310.9438 (0.7901-1.127) 2rs842647RELAG967:307, 1080:3420.24 0.0010.97740.9974 (0.8357-1.190) 3rs6441961CCR3GA741:533, 906:5160.410.368.7070.00320.7918 (0.6780-0.9247) 3rs17810546SCHIP1AG1158:116, 1312:1100.090.071.6410.20020.8370 (0.6373-1.099) 3rs1464510LPPCA646:628, 844:5780.490.4020.326.5E-060.7045 (0.6048-0.8206) 4rs13119723KIAA1109AG1135:139, 1220:1960.110.145.2850.02151.312 (1.040-1.654) 4rs13151961KIAA1109AG1139:135, 1225:1950.100.146.1430.01321.343 (1.063-1.697) 6rs2327832OLIG3AG1008:248,1162:2560.190.231.2460.26430.8955 (0.7376-1.087) 6rs1738074TAGAPGA681:593, 816:6040.460.424.3760.03650.8500 (0.7299-0.9899) 19rs3760746TNFSF14TC318:276, 461:3750.420.410.3620.54730.9372 (0.7588-1.158) Chr: chromosome; A2: minor allele; MAF: minor allele frequency; OR: odds ratio; CI: confidence interval; χ 2 : χ-square test; allelic p-value was calculated by 2x2 two-sided χ-square test; bold indicates p-value < 0.05 372 CD-Cases vs 451 Controls Regulator of G-protein signalling Case-control association analyses at the single SNP level Structural role in maintaining cell shape and motility, involved in signal trasduction and activation of gene transcription Subunit of NF-kB
 1rs RGS1AC1092:182,1169: ( ) 2rs917997IL18RAPGA965:309, 1092: ( ) 2rs842647RELAG967:307, 1080: ( ) 3rs CCR3GA741:533, 906: ( ) 3rs SCHIP1AG1158:116, 1312: ( ) 3rs LPPCA646:628, 844: E ( ) 4rs KIAA1109AG1135:139, 1220: ( ) 4rs KIAA1109AG1139:135, 1225: ( ) 6rs OLIG3AG1008:248,1162: ( ) 6rs TAGAPGA681:593, 816: ( ) 19rs TNFSF14TC318:276, 461: ( ) Chr: chromosome; A2: minor allele; MAF: minor allele frequency; OR: odds ratio; CI: confidence interval; χ 2 : χ-square test; allelic p-value was calculated by 2x2 two-sided χ-square test; bold indicates p-value < CD-Cases vs 451 Controls Regulator of G-protein signalling Case-control association analyses at the single SNP level Structural role in maintaining cell shape and motility, involved in signal trasduction and activation of gene transcription Subunit of NF-kB")
32
A posteriori risk by HLA classes obtained summing up all the ‘A’ alleles in three genes” DQ2 omozigote: 21% 30% DQ2 in trans: 17% 26% DQ2 eterozigote: 6% 17% DQ8: 5% 13% DQ negativi: 0.6% 5% Percentuali di rischio in base all’HLA rispetto all’aggiunta degli alleli di rischio per i tre SNP associati. DQ2 omozigote: 21% 30% DQ2 in trans: 17% 26% DQ2 eterozigote: 6% 17% DQ8: 5% 13% DQ negativi: 0.6% 5% Percentuali di rischio in base all’HLA rispetto all’aggiunta degli alleli di rischio per i tre SNP associati.

33
No Dq2 or DQ8 Double DQB1*02 DQ8 N° di alleli di rischio “A” Increase of the a priori risk by HLA classes summing up the at risk A alleles in 3 SNPs

34
ROC - Performance of the predicting model

35
But the GENOMA is a written book : Life is the EXPRESSION of Genes

36
STUDI DI ESPRESSIONE GENICA I Step: Analisi dell’espressione genica dei geni candidati in pazienti celiaci e controlli sani in diversi tessuti umani: Mucosa intestinale Linee cellulari di linfociti T Monociti isolati da sangue periferico I Step: Analisi dell’espressione genica dei geni candidati in pazienti celiaci e controlli sani in diversi tessuti umani: Mucosa intestinale Linee cellulari di linfociti T Monociti isolati da sangue periferico Genomic alone does not explain more than an half of the genetic component of Celiac Disease : epigenetics is likely to explain the missing part : Regolazione dell’espressione genica Metilazione del DNA Azione di micro-RNA Genomic alone does not explain more than an half of the genetic component of Celiac Disease : epigenetics is likely to explain the missing part : Regolazione dell’espressione genica Metilazione del DNA Azione di micro-RNA

37
EXPRESSION Biopsie intestinali - 1 Sperandeo et al, 2011 4q27

38
Mucosa intestinale Linee T isolate da biopsia L’analisi di espressione dei geni candidati in mucosa intestinale ottenuta da biopsia mostra l’aumento di espressione di alcuni geni solo nei pazienti celiaci rispetto ai controlli sani. Analisi di espressione dei geni candidati condotta in linee cellulari T, isolate a partire da biopsia intestinale ottenuta da biopsia nei pazienti celiaci rispetto ai controlli sani, mostra l’aumento di espressione di alcuni geni dopo il trattamento di queste cellule con gliadina.

39
Discriminant Analysis between Coeliacs and Controls by the Expression of Candidate Genes in Intestinal Mucosa Wilks' Lambda df1 Exact F Sig. 1TNFAIP3,404 159,002,000 2IL21,300 245,521,000 3REL,261 335,809,000 4RGS1,235 430,143,000 5 LPP,222 525,272,000 Wilk’s Lambda shows the ability to discriminate between Coeliac and Controls 1-------------------------------0 Wilks’ Lambda

40
Classification results Predicted Group Membership Total STATUSControlCeliac CountControl19120 Celiac22022 %Control955100 Celiac1090100 92,9% of original grouped cases correctly classified.

42
EXPRESSION Monociti da Sangue Periferico Endopeptidasis It is suggested a role in cell growth regulation and proliferation (Kuo et al., 2006) Subunit of the complex NF-kB It may start and stop the action of NF-kB (Bonizzi et al, 2004, Lawrence et al, 2005). know as Herpesvirus Entry Mediator (HVEM).
..")
43
Monociti isolati da sangue periferico I livelli di espressione di alcuni dei geni analizzati risultano alterati in monociti isolati da sangue periferico di soggetti celiaci paragonati a controlli sani, controlli positivi di infiammazione (Crohn), e celiaci a dieta senza glutine (CD- GDF). Alcuni geni risultano up-regolati, mentre altri mostrano una diminuzione del livello di espressione, tutte le variazioni seguono un andamento abbastanza omogeneo nelle popolazioni analizzate.

44
Discriminating power of the Expression of 4 genes in monocytes from peripheral blood of celiacs versus controls Step Candidate Genes Wilks’ Lambda Exact F StatisticSig. 1 c-REL0.13868.711<0.001 2 LPP0.09050.848<0.001 3 TNFAIP30.06245.461<0.001 4 KIAA11090.04839.597<0.001

45
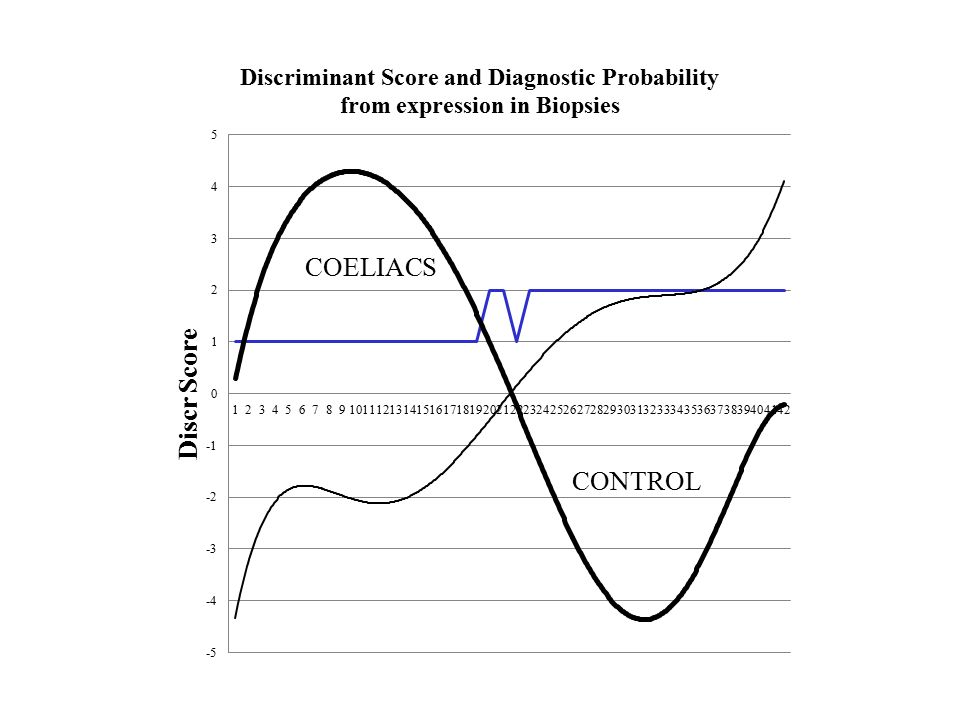
Classification based on the expression of 4 genes in blood monocytes

46
Analisi discriminante L’analisi discriminate effettuata in base ai risultati dello studio di espressione genica permette di classificare correttamente i 4 gruppi di soggetti analizzati rispetto al loro score discriminante (D-score). Nel grafico si nota come i D-Score delle 4 popolazioni non si sovrappongano mai, separando nettamente le 4 popolazioni, inoltre è importante evidenziare come solo i celiaci mostrino valori di D-Score negativi.

47
CONCLUSIONI ???? By the expression of only 4 genes it is possible to reach a diagnostic classification similar to the mucosal damage, but better since we distinguish Celiac from Crohns. …if we add the improved estimate of HLA+non HLA genetic risk … if we had the remarkable specificity and sensibility of Anti—TGASE antibodies ???

48
Which disease enjoys a similar accuracy ?

49
Senza Glutine… si può !!

Presentazioni simili


>")


