Scaricare la presentazione
La presentazione è in caricamento. Aspetta per favore

1
Distribuzione di sequenze nel genoma umano
3200 Mb Geni e sequenze correlate DNA intergenico 1200 Mb 2000 Mb Geni 48 Mb Sequenze correlate 1152 Mb Ripetizioni intersperse 1400 Mb Altre regioni intergeniche 600 Mb Pseudogeni Frammenti genici Introni, UTR LINE 640 Mb SINE 420 Mb Elementi LTR 250 Mb Trasposoni DNA 90 Mb Microsatelliti 90 Mb Varie 510 Mb

2
50 kb di genoma a confronto

3
Fattori trascrizionali in eucarioti

4
Tipi di ripetizione nel genoma umano
SINE ALU MIR MIR LINE LINE LINE LINE Elementi LTR Classe I ERV Classe II ERV(K) Classe III ERV(L) MaLR Trasposoni DNA hAT Tc-I PiggyBac N.C
 Classe III ERV(L) MaLR Trasposoni DNA hAT Tc-I PiggyBac N.C")
5
Confronto di interi genomi
Per aumentare l’affidabilità della predizione, si richiede che per ogni coppia di ortologhi, ognuno dei due geni risulti quello più simile all’altro quando confrontato con l’intero genoma Genoma2 Genoma 1 se entrambe le relazioni sono vere ==> le due proteine gialle si possono proporre come ortologhe

6
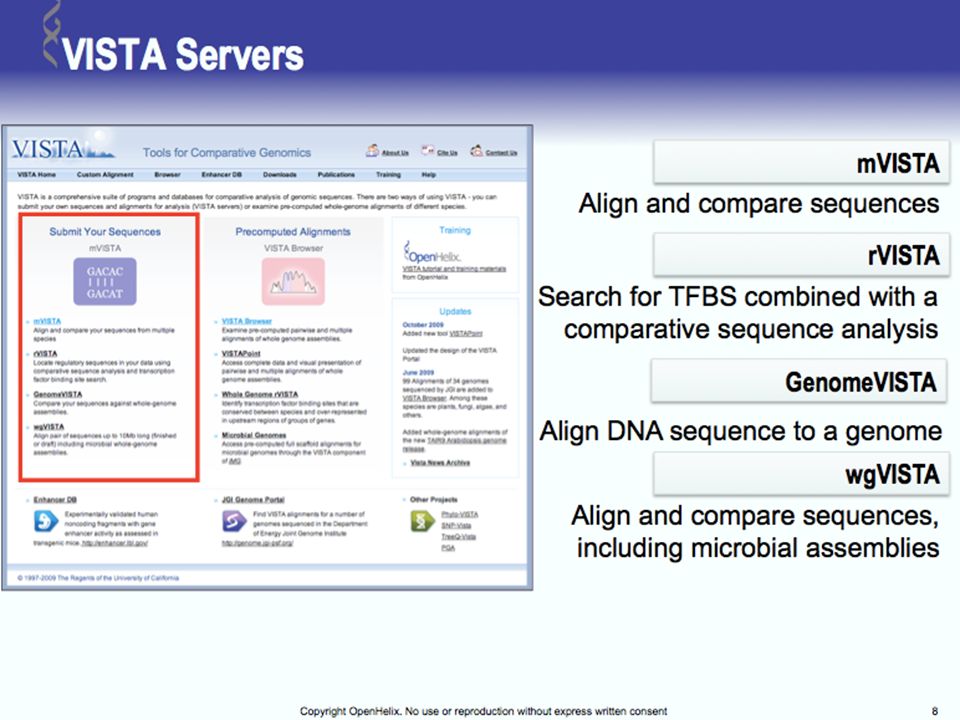
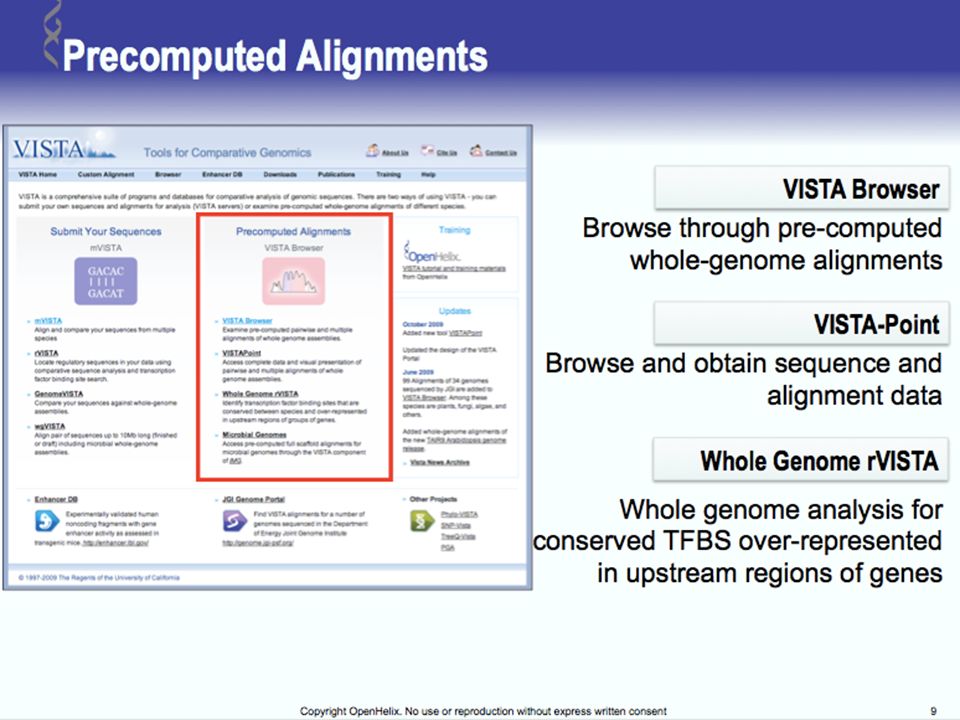
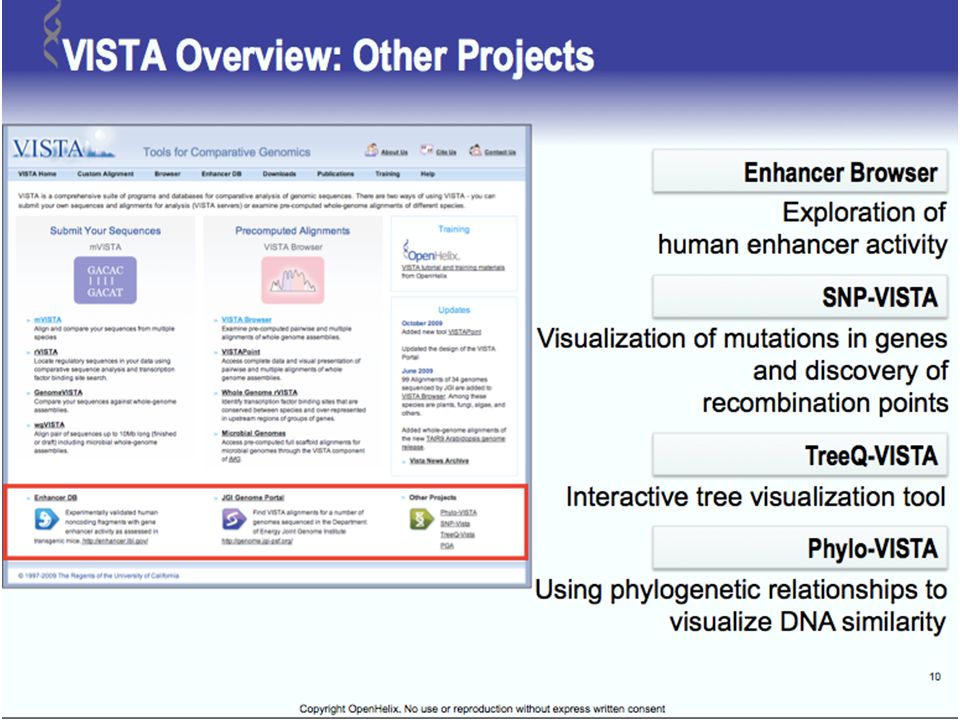
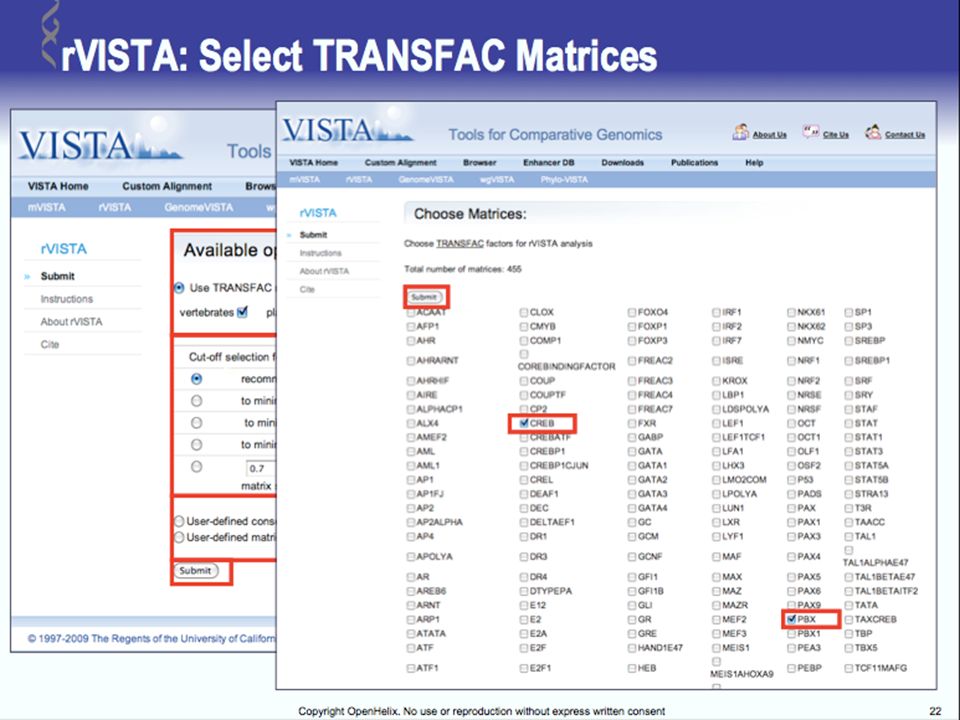
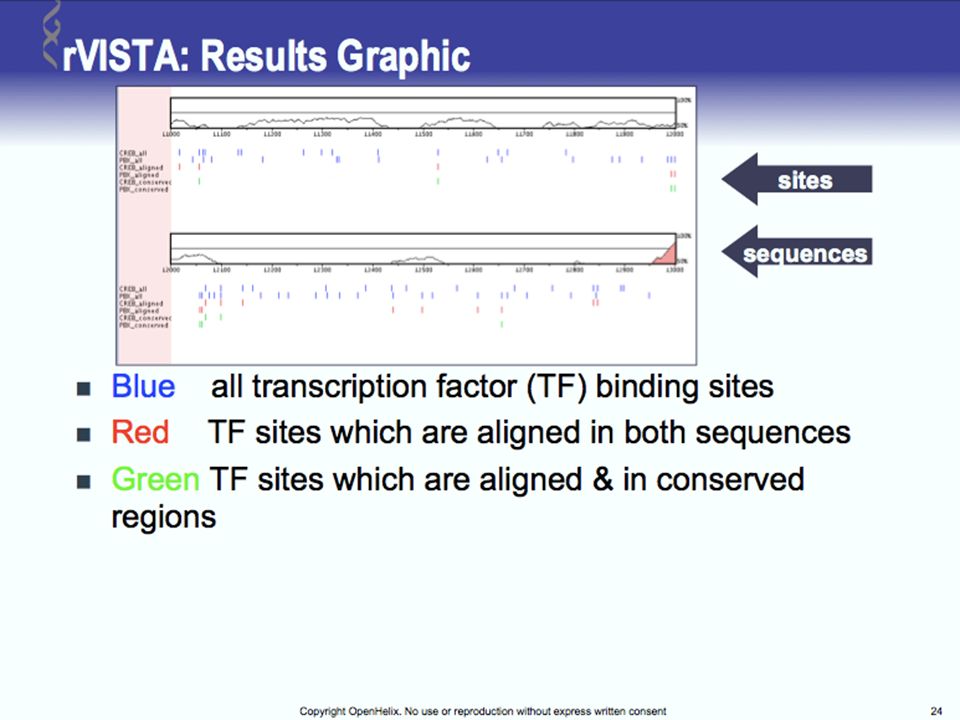
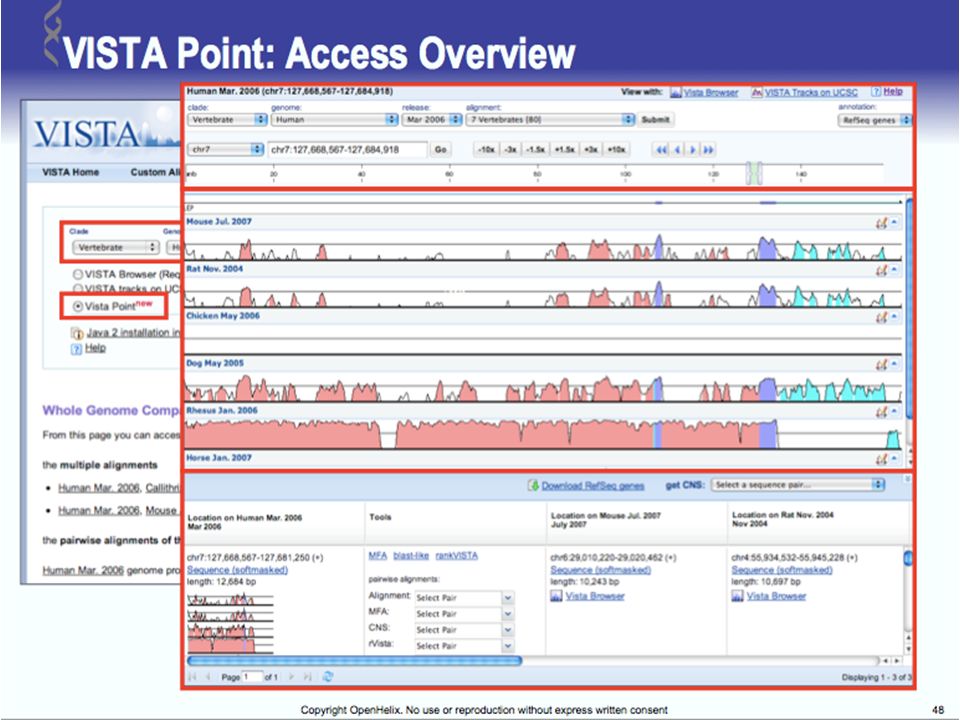
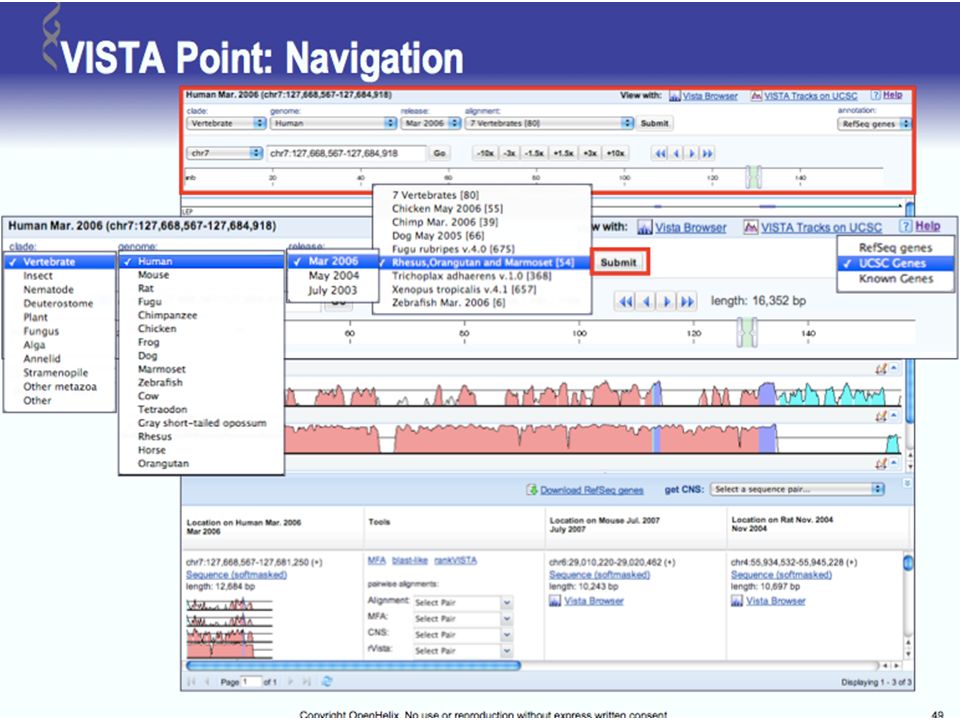
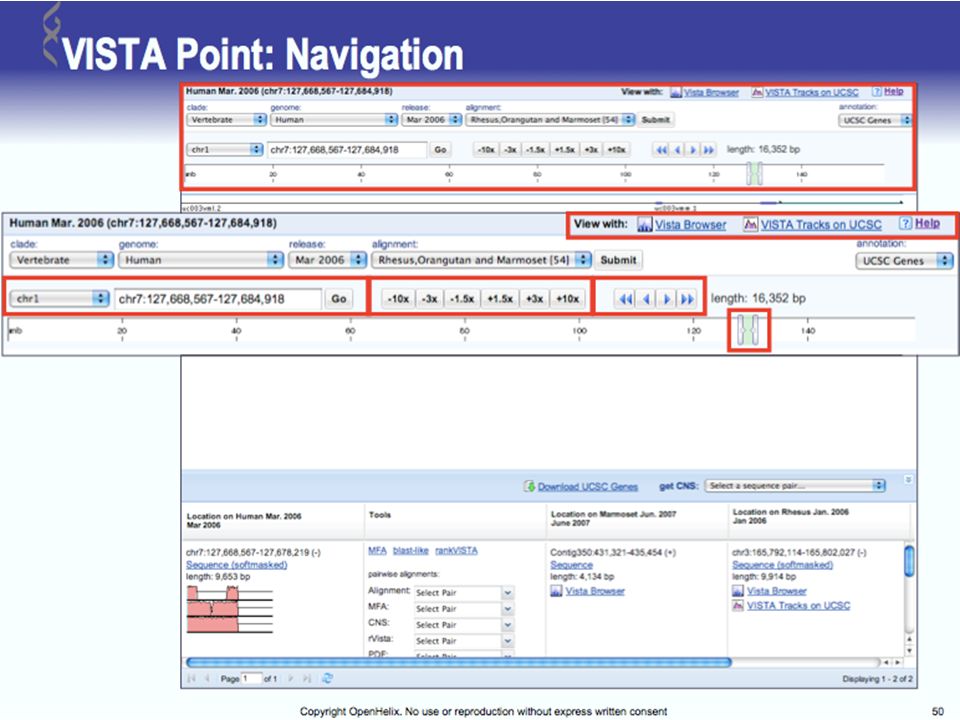
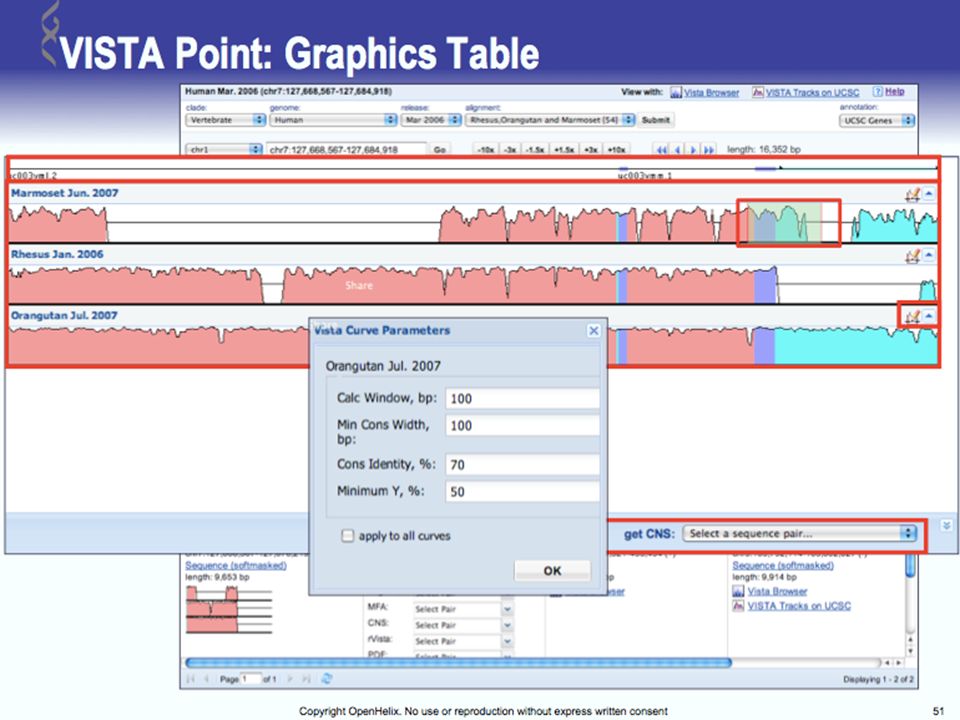
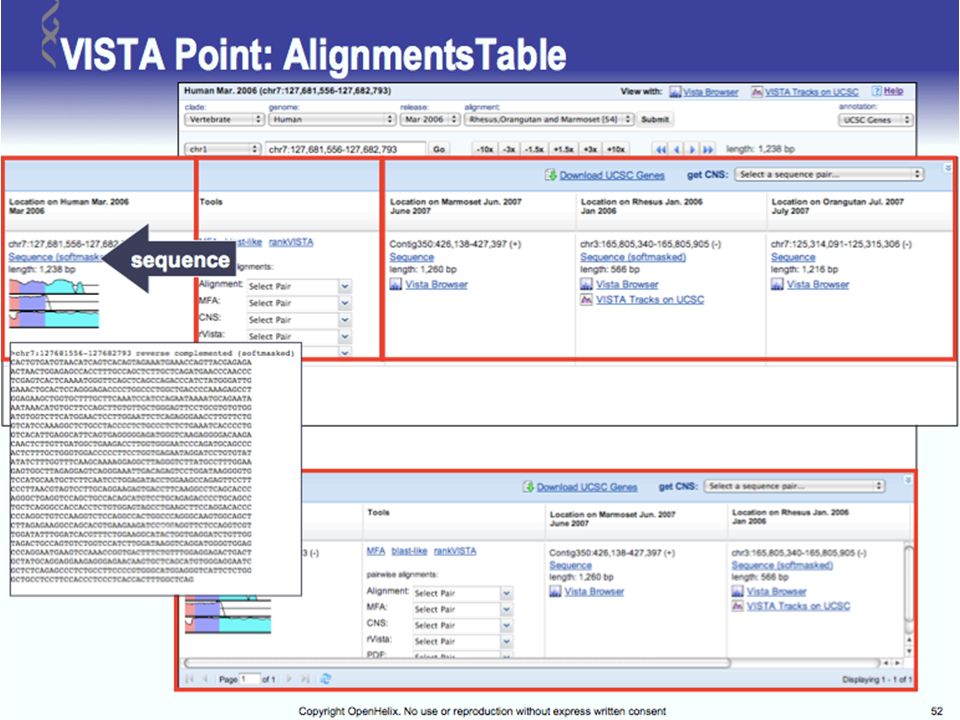
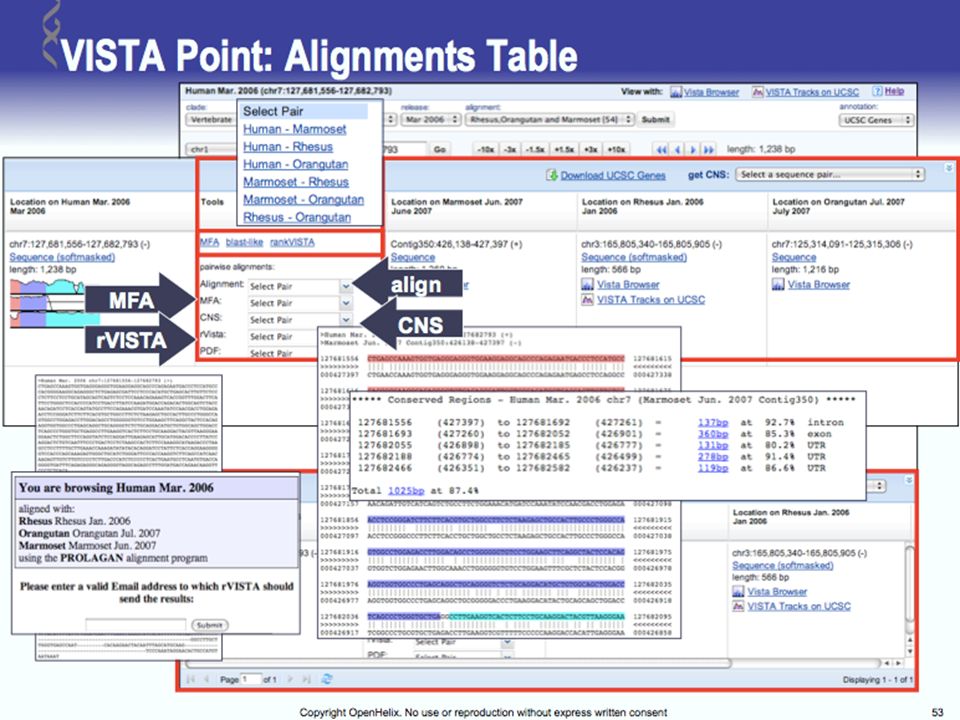
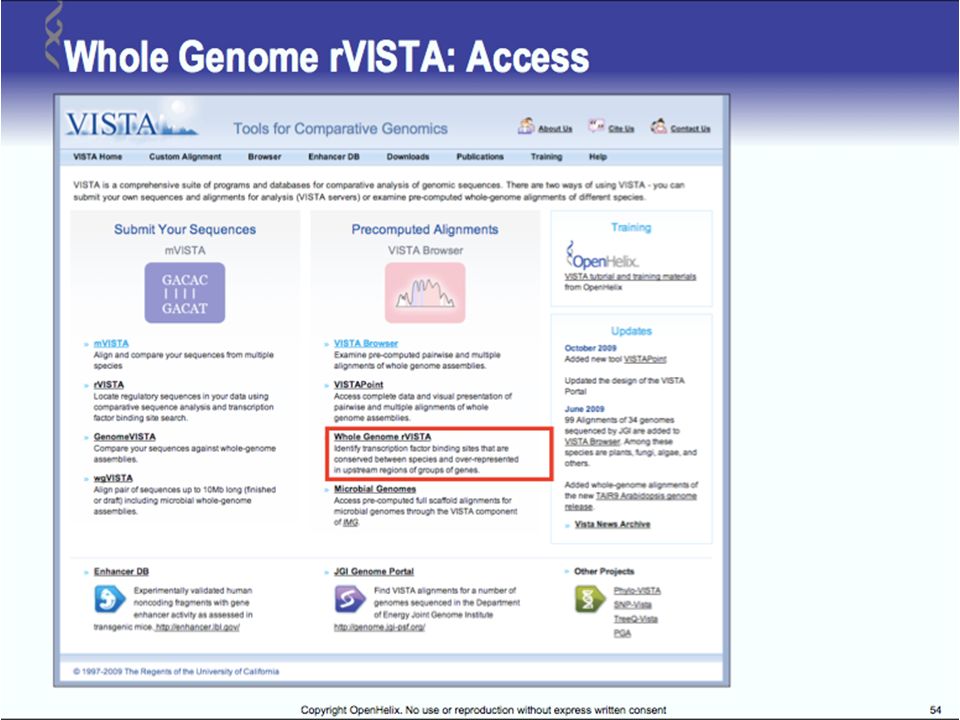
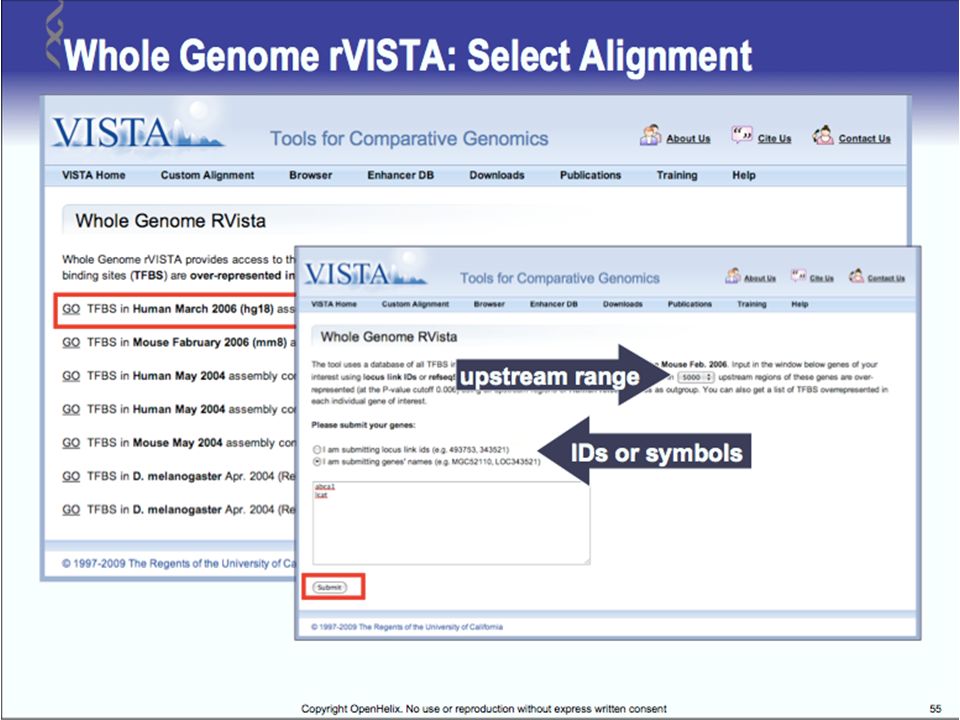
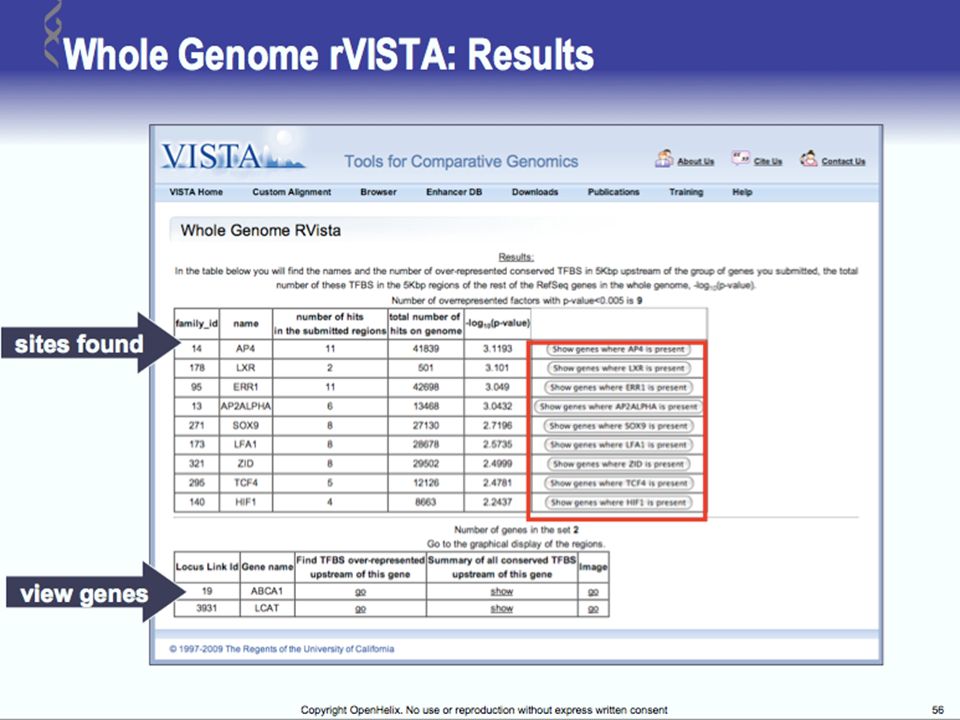
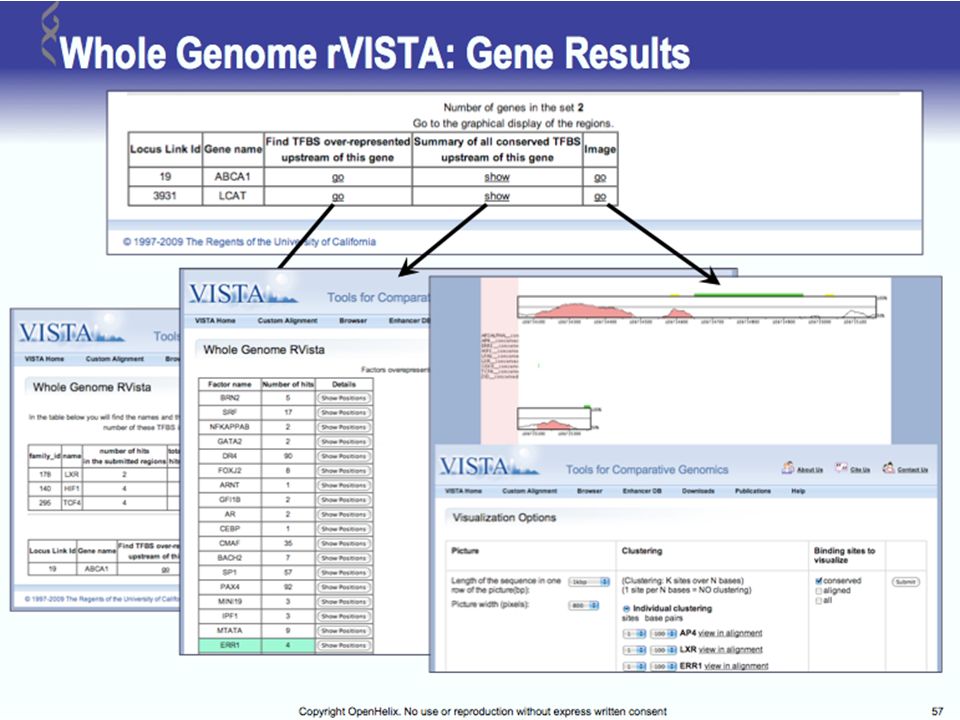
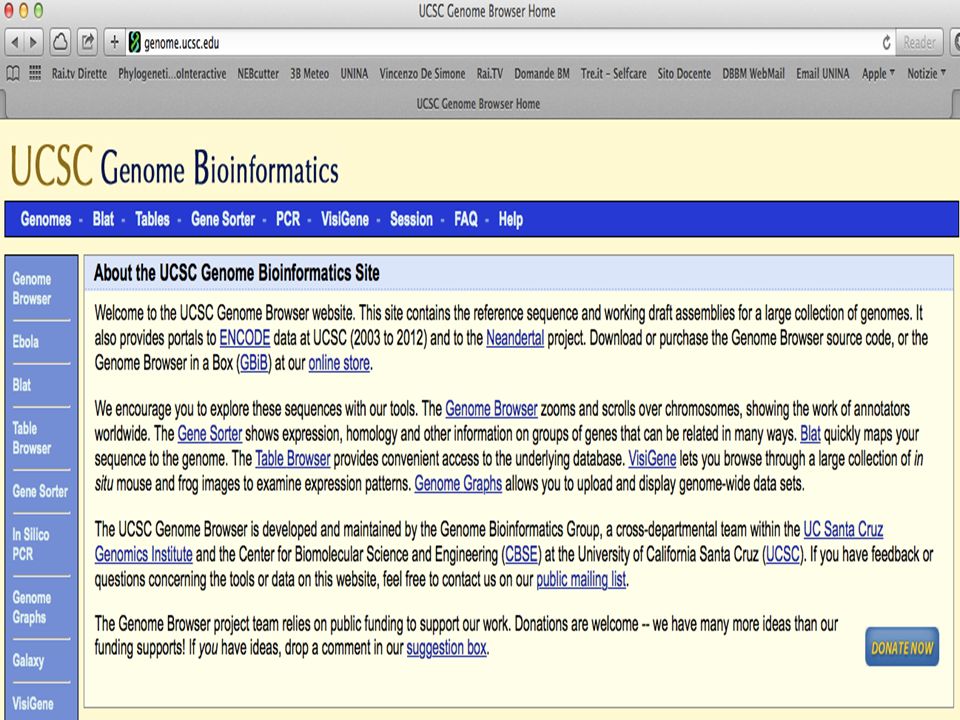
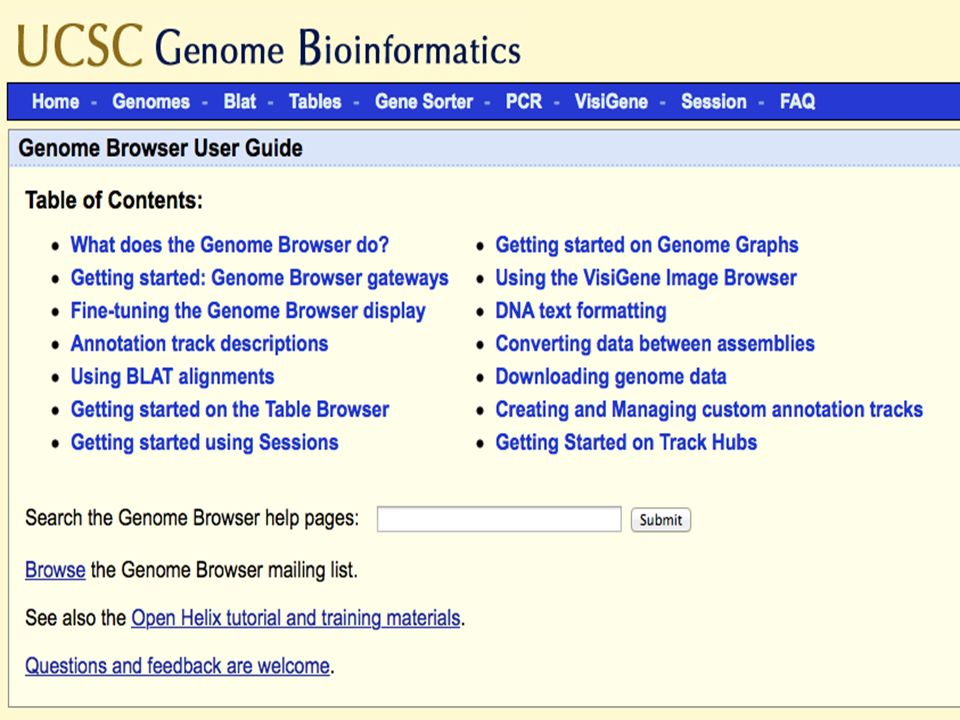
Tools for Comparative Genomics
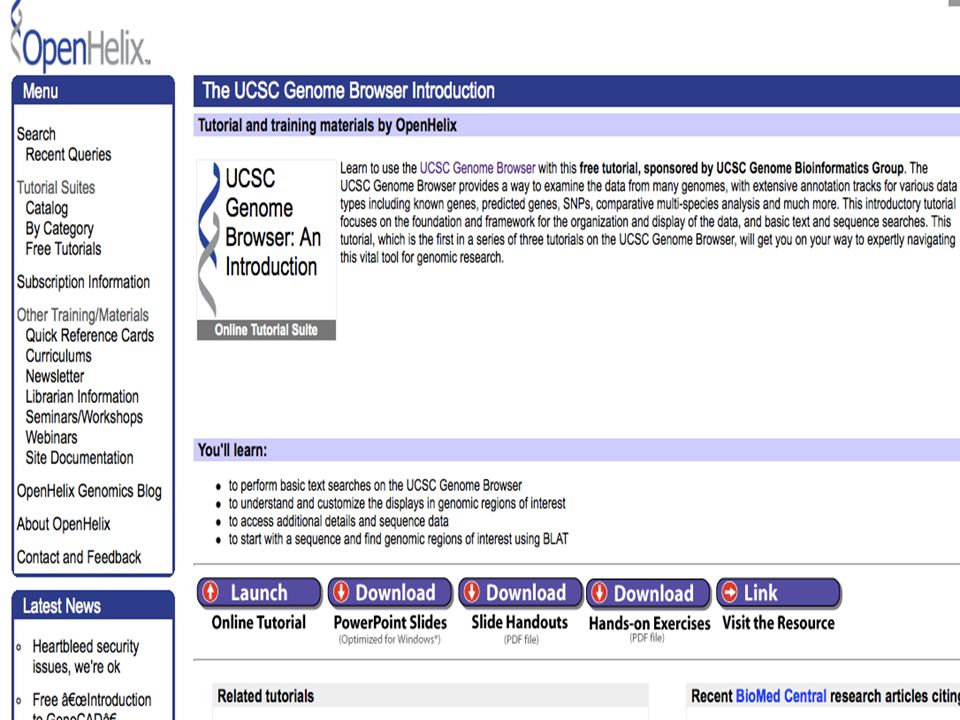
UCSC Browser: This site contains the reference sequence and working draft assemblies for a large collection of genomes. Ensembl: The Ensembl project produces genome databases for vertebrates and other eukaryotic species, and makes this information freely available online. MapView: The Map Viewer provides a wide variety of genome mapping and sequencing data.[26] VISTA: A comprehensive suite of programs and databases for comparative analysis of genomic sequences. It was built to visualize the results of comparative analysis based on DNA alignments. The presentation of comparative data generated by VISTA can easily suit both small and large scale of data.

7
COMPARATIVE GENOMICS AT THE VERTEBRATE EXTREMES
Dario Boffelli, Marcelo A. Nobrega and Edward M. Rubin NATURE REVIEWS | GENETICS VOLUME 5 | JUNE 2004 | 457 Annotators of the human genome are increasingly exploiting comparisons with genomes at both the distal and proximal evolutionary edges of the vertebrate tree. Despite the sequence similarity between primates, comparisons among members of this clade are beginning to identify primate- as well as human-specific functional elements. At the distal evolutionary extreme, comparing the human genome to that of non-mammal vertebrates such as fish has proved to be a powerful filter to prioritize sequences that most probably have significant functional activity in all vertebrates. Annotators of the human genome are increasingly exploiting comparisons with genomes at both the distal and proximal evolutionary edges of the vertebrate tree. Despite the sequence similarity between primates, comparisons among members of this clade are beginning to identify primate- as well as human-specific functional elements. At the distal evolutionary extreme, comparing the human genome to that of non-mammal vertebrates such as fish has proved to be a powerful filter to prioritize sequences that most probably have significant functional activity in all vertebrates.

8
Conservation in enhancers shared by human and fish
A core enhancer in an intron in DACH is >98% identical for 350 bp in humans, mice and rats. In the ~1 billion years of parallel evolutionary time that separates human, mouse, rat, chicken, frog and fish, only 6 substitutions occurred in a 120-bp fragment that corresponds to an enhancer, 4 of which occurred in the frog lineage alone, and none occurred in the mammalian lineage. The finding that some cis-regulatory elements have almost identical sequences over hundreds of base pairs in species as far apart as humans and fish is surprising. Regulatory elements are generally composed of multiple transcription-factor binding sites (TFBSs) that are arranged in modules. These modules are usually separated from each other by sequences, the length and identity of which are even more degenerate and flexible that the TFBSs themselves. As a result, regulatory sequences can tolerate small insertions, deletions or sequence substitutions. Regulatory variants such as these are an important source of phenotypic evolution. So, in species as distant as humans and fish, it is more than reasonable to assume that in almost half a billion years, Zebrafish enough changes will have occurred within a given orthologous regulatory element so that even if these species still share this regulatory unit, their sequence will have diverged enough to render them ‘invisible’ to sequence-alignment tools. Nevertheless, we can easily identify conserved enhancers between humans and fish. One of the reasons for this success is the astonishing degree of conservation that these sequences have retained over long periods. For example, a core enhancer in an intron in DACH is >98% identical for 350 bp in humans, mice and rats (see figure displaying 120 bp of the sequence alignment). Moreover, in the ~1 billion years of parallel evolutionary time that separates human, mouse, rat, chicken, frog and fish, only 6 substitutions occurred in a 120-bp fragment that corresponds to an enhancer20, 4 of which occurred in the frog lineage alone, and none occurred in the mammalian lineage. Arguably, as astonishing as their degree of conservation is the fact that these sequences correspond to enhancers. Why are these regulatory elements much more constrained than most other functional elements in the genome? Even if we picture a multi-modular enhancer, with overlapping modules that each have several TFBSs located on top of one another, it is still hard to imagine that this would justify such a degree of conservation over stretches of several hundred bases. It will be interesting to see what the functional investigation of these enhancers reveals, as to whether they have unique architectural features or whether they use similar mechanisms for transcription activation as other classical enhancers.
 that are arranged in modules. These modules are usually separated from each other by sequences, the length and identity of which are even more degenerate and flexible that the TFBSs themselves. As a result, regulatory sequences can tolerate small insertions, deletions or sequence substitutions. Regulatory variants such as these are an important source of phenotypic evolution. So, in species as distant as humans and fish, it is more than reasonable to assume that in almost half a billion years, Zebrafish enough changes will have occurred within a given orthologous regulatory element so that even if these species still share this regulatory unit, their sequence will have diverged enough to render them ‘invisible’ to sequence-alignment tools. Nevertheless, we can easily identify conserved enhancers between humans and fish. One of the reasons for this success is the astonishing degree of conservation that these sequences have retained over long periods. For example, a core enhancer in an intron in DACH is >98% identical for 350 bp in humans, mice and rats (see figure displaying 120 bp of the sequence alignment). Moreover, in the ~1 billion years of parallel evolutionary time that separates human, mouse, rat, chicken, frog and fish, only 6 substitutions occurred in a 120-bp fragment that corresponds to an enhancer20, 4 of which occurred in the frog lineage alone, and none occurred in the mammalian lineage. Arguably, as astonishing as their degree of conservation is the fact that these sequences correspond to enhancers. Why are these regulatory elements much more constrained than most other functional elements in the genome Even if we picture a multi-modular enhancer, with overlapping modules that each have several TFBSs located on top of one another, it is still hard to imagine that this would justify such a degree of conservation over stretches of several hundred bases. It will be interesting to see what the functional investigation of these enhancers reveals, as to whether they have unique architectural features or whether they use similar mechanisms for transcription activation as other classical enhancers.")
9
Defining functional DNA elements in the
human genome Manolis Kellis et al. PNAS April 29, 2014 | vol. 111 | no. 17 | 6131–6138 With the completion of the human genome sequence, attention turned to identifying and annotating its functional DNA elements. As a complement to genetic and comparative genomics approaches, the Encyclopedia of DNA Elements Project was launched to contribute maps of RNA transcripts, transcriptional regulator binding sites, and chromatin states in many cell types. The resulting genome-wide data reveal sites of biochemical activity with high positional resolution and cell type specificity that facilitate studies of gene regulation and interpretation of noncoding variants associated with human disease. However, the biochemically active regions cover a much larger fraction of the genome than do evolutionarily conserved regions, raising the question of whether nonconserved but biochemically active regions are truly functional. Here, we review the strengths and limitations of biochemical, evolutionary, and genetic approaches for defining functional DNA segments, potential sources for the observed differences in estimated genomic coverage, and the biological implications of these discrepancies. We also analyze the relationship between signal intensity, genomic coverage, and evolutionary conservation. Our results reinforce the principle that each approach provides complementary information and that we need to use combinations of all three to elucidate genome function in human biology and disease.

10
DNA that produces a phenotype upon alteration
The complementary nature of evolutionary, biochemical and genetic evidence DNA that produces a phenotype upon alteration Encyclo pedia of DNA Elements (ENCODE) Project The complementary nature of evolutionary, bio- chemical, and genetic evidence. The outer circle represents the human genome. Blue discs represent DNA sequences acted upon biochemically and partitioned by their levels of signal [combined 10th percentiles of different ENCODE data types for high, combined 50th percentiles for medium, and all significant signals for low (see Reconciling Genetic, Evo- lutionary, and Biochemical Estimates and Fig. 2)]. The red circle represents, at the same scale, DNA with signatures of evolutionary constraint (GERP++ elements derived from 34mammal alignments). Overlaps among the sequences having biochemical and evolutionarily evidence were com- puted in this work (Fig. 3 and SI Methods). The small purple circle represents protein-coding nucleotides (Gencode). The green shaded domain conceptually represents DNA that produces a phenotype upon alteration, although we lack well-developed summary estimates for the amount of ge- netic evidence and its relationship with the other types. This summary of our understanding in early 2014 will likely evolve substantially with more data and more refined experimental and analytical methods. GERP++ elements from 34 mammal alignments
 Project. The complementary nature of evolutionary, bio- chemical, and genetic evidence. The outer circle represents the human genome. Blue discs represent DNA sequences acted upon biochemically and partitioned by their levels of signal [combined 10th percentiles of different ENCODE data types for high, combined 50th percentiles for medium, and all significant signals for low (see Reconciling Genetic, Evo- lutionary, and Biochemical Estimates and Fig. 2)]. The red circle represents, at the same scale, DNA with signatures of evolutionary constraint (GERP++ elements derived from 34mammal alignments). Overlaps among the sequences having biochemical and evolutionarily evidence were com- puted in this work (Fig. 3 and SI Methods). The small purple circle represents protein-coding nucleotides (Gencode). The green shaded domain conceptually represents DNA that produces a phenotype upon alteration, although we lack well-developed summary estimates for the amount of ge- netic evidence and its relationship with the other types. This summary of our understanding in early 2014 will likely evolve substantially with more data and more refined experimental and analytical methods. GERP++ elements from 34 mammal alignments.")
11
Epigenetic and evolutionary signals in cis-regulatory modules (CRMs) of the HBB complex
(Upper) Many CRMs (red rectangles) (106) have been mapped within the cluster of genes encoding β-like globins expressed in embryonic (HBE1), fetal (HBG1 and HBG2), and adult (HBB and HBD) erythroid cells. All are marked by DNase hypersensitive sites and footprints (Gene Expression Omnibus accession nos. GSE55579, GSM , and GSM ), and many are bound by GATA1 in peripheral blood derived erythroblasts (PBDEs). (Lower, Left) A DNA segment located between the HBG1 and HBD genes is one of the DNA segments bound by BCL11A (109, 110) and several other proteins (ENCODE uniformly processed data) to negatively regulate HBG1 and HBG2. It is sensitive to DNase I but is not conserved across mammals. (Center) An enhancer located 3′ of the HBG1 gene (red line) (108) is bound by several proteins in PBDEs and K562 cells (from the ENCODE uniformly processed data) and is sensitive to DNase I, but shows almost no signal for mammalian constraint. (Right) The enhancer at hypersensitive site (HS)2 of the locus control region (LCR) (red line) (107) is bound by the designated proteins at the motifs indicated by black rectangles. High-resolution DNase footprinting data (116) show cleavage concentrated between the bound motifs, which are strongly constrained during mammalian evolution, as shown on the mammalian phastCons track (48).
 Many CRMs (red rectangles) (106) have been mapped within the cluster of genes encoding β-like globins expressed in embryonic (HBE1), fetal (HBG1 and HBG2), and adult (HBB and HBD) erythroid cells. All are marked by DNase hypersensitive sites and footprints (Gene Expression Omnibus accession nos. GSE55579, GSM , and GSM ), and many are bound by GATA1 in peripheral blood derived erythroblasts (PBDEs). (Lower, Left) A DNA segment located between the HBG1 and HBD genes is one of the DNA segments bound by BCL11A (109, 110) and several other proteins (ENCODE uniformly processed data) to negatively regulate HBG1 and HBG2. It is sensitive to DNase I but is not conserved across mammals. (Center) An enhancer located 3′ of the HBG1 gene (red line) (108) is bound by several proteins in PBDEs and K562 cells (from the ENCODE uniformly processed data) and is sensitive to DNase I, but shows almost no signal for mammalian constraint. (Right) The enhancer at hypersensitive site (HS)2 of the locus control region (LCR) (red line) (107) is bound by the designated proteins at the motifs indicated by black rectangles. High-resolution DNase footprinting data (116) show cleavage concentrated between the bound motifs, which are strongly constrained during mammalian evolution, as shown on the mammalian phastCons track (48).")
12
Advances in genome sequencing technologies have created new opportunities for comparative primate genomics. Genome assemblies have been published for various primate species, and analyses of several others are underway. Whole-genome assemblies for the great apes provide remarkable new information about the evolutionary origins of the human genome and the processes involved. Genomic data for macaques and other non-human primates offer valuable insights into genetic similarities and differences among species that are used as models for disease-related research. This Review summarizes current knowledge regarding primate genome content and dynamics, and proposes a series of goals for the near future

13
Primate phylogenetic tree

14
Biomedical relevance Specific differences in cytochrome P450 genes that are involved in drug metabolism or other genetic components that are relevant to disease, such as pathways involving the melanocortin receptor, methyltransferases and the parathyroid hormone receptor 1. Macaques have an expanded array of MHC class I genes that are central to their response to infectious agents and other immune system processes. Rhesus macaques carry variants in the ornithine carbamoyltransferase (OTC), phenylalanine hydroxylase (PAH) and N-acetylglucosaminidase alpha (NAGLU) genes that predispose some human individuals to disease. Chimpanzees carry ‘disease’ alleles in genes that are related to cancer (mutL homologue 1 (MLH1)), diabetes mellitus (peroxi- some proliferator-activated receptor g (PPARG)) and Alzheimer’s disease (apolipoprotein E (APOE)). Transcriptomics. Expression of drug-metabolizing P450 genes and some amino acid sequences differ between cynomolgus and rhesus macaques98, which has implications for pharmacokinetics.
, phenylalanine hydroxylase (PAH) and N-acetylglucosaminidase alpha (NAGLU) genes that predispose some human individuals to disease. Chimpanzees carry ‘disease’ alleles in genes that are related to cancer (mutL homologue 1 (MLH1)), diabetes mellitus (peroxi- some proliferator-activated receptor g (PPARG)) and Alzheimer’s disease (apolipoprotein E (APOE)). Transcriptomics. Expression of drug-metabolizing P450 genes and some amino acid sequences differ between cynomolgus and rhesus macaques98, which has implications for pharmacokinetics.")
15
Lo “switch” fetale-adulto nel locus delle -globine
28/04/2017 15

16
Il locus Albumina / Alfa-fetoproteina (ALB/AFP)
Hind III (AAGCTT) Sau3A (GATC) 13.4 13.5 45.9 46.3 47.8 48.2 Kb 5 10 15 20 25 30 35 40 45 50 55 60 III II Ealb Eafp ALB Prom AFP Prom AFP + ALB - ALB Prom inattive Ealb x AFP Prom ACTIVE Eafp III II ALB Prom ACTIVE Ealb x AFP Prom inactive Eafp III II AFP - ALB + Before birth After birth
 Sau3A. (GATC) Kb III. II. Ealb. Eafp. ALB Prom. AFP Prom. AFP + ALB - ALB Prom. inattive. Ealb. x. AFP Prom. ACTIVE. Eafp. III. II. ALB Prom. ACTIVE. Ealb. x. AFP Prom. inactive. Eafp. III. II. AFP - ALB + Before birth. After birth.")
17
3C “Carbon Copy” (5C) (A) A 3C library is generated by conventional 3C and then converted into a 5C library by annealing and ligating 5C oligonucleotides in a multiplex setting. 5C libraries are then analyzed on a microarray or by quantitative sequencing.
 A 3C library is generated by conventional 3C and then converted into a 5C library by annealing and ligating 5C oligonucleotides in a multiplex setting. 5C libraries are then analyzed on a microarray or by quantitative sequencing.")
18
Cut with restriction enzyme Fill ends and mark with biotin
Hi-C, a method that probes the three-dimensional architecture of whole genomes Ligate blunt ends Cut with restriction enzyme Fill ends and mark with biotin Crosslink DNA Purify and shear DNA Pull down biotin Sequence paired-ends

19
Map of chromosome 14 at 1Mb resolution
(A) The map of chromosome 14 at 1Mb resolution exhibits substructure in the form of an intense diagonal and a constellation of large blocks The Observed/expected matrix (B) shows loci with either more (red) or less (blue) interactions than would be expected given their genomic distance (range: 0.2 – 5).
 The map of chromosome 14 at 1Mb resolution exhibits substructure in the form of an intense diagonal and a constellation of large blocks. The Observed/expected matrix (B) shows loci with either more (red) or less (blue) interactions than would be expected given their genomic distance (range: 0.2 – 5).")
20
Correlation map of chromosome 14 at a resolution of 100kb
The principal component (eigenvector) correlates with the distribution of genes and with features of open chromatin.
 correlates with the distribution of genes and with features of open chromatin.")
21
Genome architecture at three scales
Two compartments, corresponding to open and closed chromatin, spatially partition the genome. Chromosomes (blue, cyan, green) occupy distinct territories. Individual chromosomes weave back-and-forth between the open and closed chromatin compartments. At the scale of single megabases, the chromosome consists of a series of fractal globules.
 occupy distinct territories. Individual chromosomes weave back-and-forth between the open and closed chromatin compartments. At the scale of single megabases, the chromosome consists of a series of fractal globules.")
40
Prof. Vincenzo De Simone
Analisi del Trascrittoma mediante Microarrays a DNA 3 Microarrays, Gene Chips, Trascrittoma. AgroBiotecnologie, Biotecnol. Mediche Biologia Molecolare Avanzata

41
Prof. Vincenzo De Simone
Un esempio di studio comparato del Trascrittoma mediante Microarrays a DNA 4 Microarrays, trascrittoma, profili di espressione genica. AgroBiotecnologie Biotecnol. Mediche Biologia Molecolare Avanzata

42
Conclusioni Struttura e composizione dei genomi.
Sequenze ripetute nel genoma umano. Gli strumenti per il confronto tra genomi. Identificazione di CRMs (Cis Regulatory Modules) per confronto tra genomi agli estremi dell’albero evolutivo dei vertebrati. Identificazione di CRMs mediante approcci multidisciplinari (biochimica, genetica, genomica e trascrittomica comparativa). Genomica comparativa dei primati ed identificazione di regioni a velocità evolutiva variabile e di alleli utili per patologie umane. Interazioni tra regioni genomiche distanti e metodiche 3/5/HiC. Il pacchetto VISTA per la genomica comparativa. Il Genome Browser UCSC Trascrittomica Comparativa ??
 per confronto tra genomi agli estremi dell’albero evolutivo dei vertebrati. Identificazione di CRMs mediante approcci multidisciplinari (biochimica, genetica, genomica e trascrittomica comparativa). Genomica comparativa dei primati ed identificazione di regioni a velocità evolutiva variabile e di alleli utili per patologie umane. Interazioni tra regioni genomiche distanti e metodiche 3/5/HiC. Il pacchetto VISTA per la genomica comparativa. Il Genome Browser UCSC. Trascrittomica Comparativa")
Presentazioni simili


>")


