Scaricare la presentazione
La presentazione è in caricamento. Aspetta per favore

1
- Un caso di bambino pallido con segni di carenza di ferro
. Due Casi Clinici: - Caso di bambino con ittero franco a bilirubina indiretta ( diagnosi di Crigler-Najiar di tipo II) - Un caso di bambino pallido con segni di carenza di ferro
 - Un caso di bambino pallido con segni di carenza di ferro.")
2
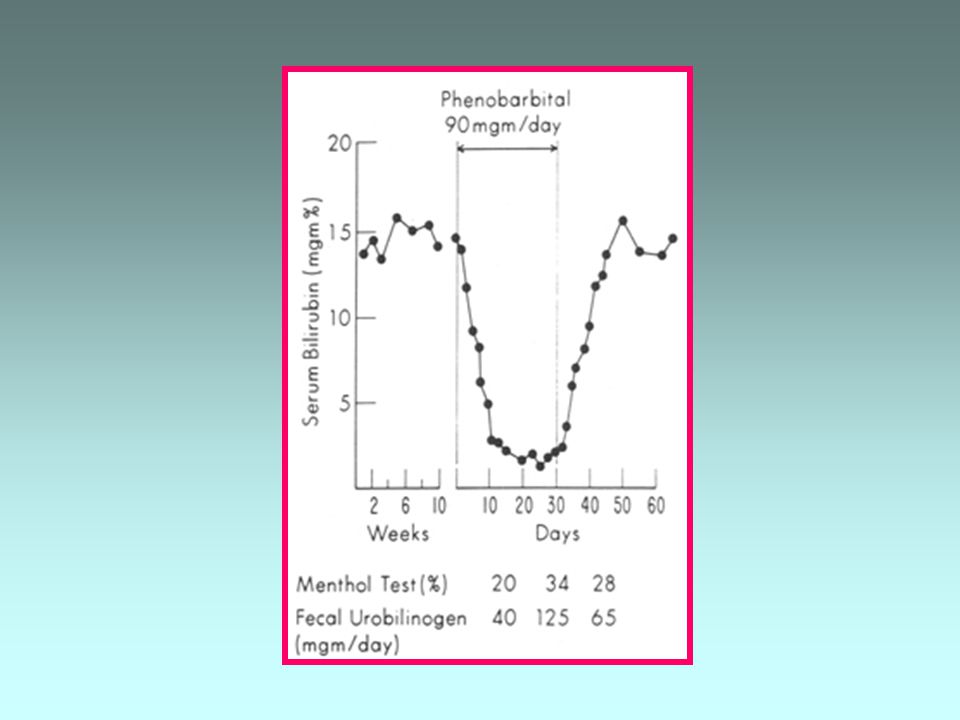
Diagnosi di Crigler-Najjar, tipo 2
Consulenza Paziente maschio,11 anni Anamnesi familiare: I.1: Colecistectomia all’età di 34 aa I.2: Iperbilirubinemia indiretta I.3: Anemia di ndd Anamnesi personale: Nato da gravidanza normocondotta, a termine, da parto cesareo Ittero neonatale (bilirubina 18 mg/dl) trattato con fenobarbital I1 I2 I3 II1 II2 Anamnesi infantile: A 5 anni ittero sclerale e cutaneo importante (bilirubina indiretta 8.8 mg/dL) Diagnosi di Crigler-Najjar, tipo 2
 trattato con fenobarbital. I1. I2. I3. II1. II2. Anamnesi infantile: A 5 anni ittero sclerale e cutaneo importante (bilirubina indiretta 8.8 mg/dL) Diagnosi di Crigler-Najjar, tipo 2.")
4
DNA Sindrome di Gilbert
Analisi delle regioni codificanti del gene UGT1A1: Assenza di mutazioni causative Analisi delle regioni non codificanti del gene UGT1A1 Paziente (TA)7/7 Ctrl (TA)6/7 Ctrl (TA)7/7 Ctrl (TA)6/6 Sindrome di Gilbert
7/7. Ctrl (TA)6/7. Ctrl (TA)7/7. Ctrl (TA)6/6. Sindrome di Gilbert.")
5
Oltre la S. di Gilbert… …anemia emolitica!
Bilirubina Totale:8.28 mg/dL Bilirubina diretta:0.93 mg/dL Bilirubina Indiretta:7.35 mg/dL Analita v.n. RBC 4-5.2 *106/uL 3.67 Hb 13-16 g/dL 11.3 Hct 36-49 % 34.4 MCV 80-98 fL 93.7 MCH 27-31 pg 30.8 MCHC 32-36 g/dL 32.9 RDW 11-14% 14.1 PLT *103/uL 300 Ret % 0.5-2 % 6.5 Ret abs *103/uL 238.5 WBC *103/uL 4.37 Albumina: 4.3 g/dL QPE: nella norma AST:24 UI/L ALT:17 UI/L Aptoglobina:<6.56mg/dL LDH: 440 UI/L Ecografia addominale Fegato: ecostruttura nella norma Dimensioni ai limiti sup. Milza: diametro bipolare 15 cm …anemia emolitica!

6
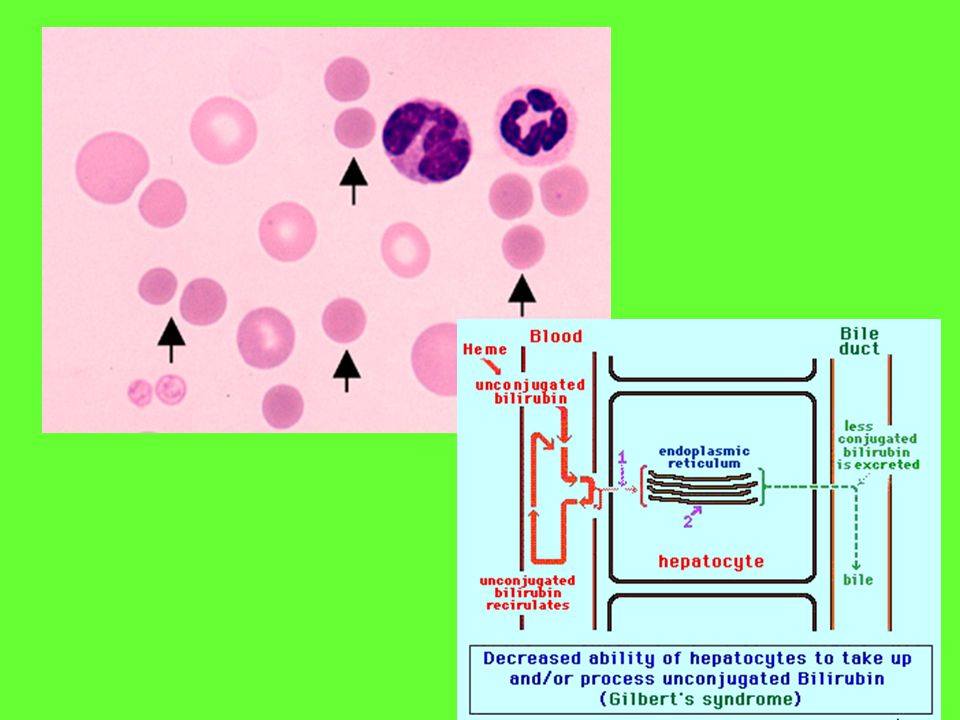
Sferocitosi Ereditaria
Anemia emolitica: Test di Coombs diretto e indiretto: NEGATIVO Pink Test: 55% (v.n. <30%) AGLT50: dimezzamento dopo 1’ (v.n. dimezzamento dopo 3’) Osservazione dello striscio periferico: presenza di sferociti Ektacitometria: Sferocitosi Ereditaria
 AGLT50: dimezzamento dopo 1’ (v.n. dimezzamento dopo 3’) Osservazione dello striscio periferico: presenza di sferociti. Ektacitometria: Sferocitosi Ereditaria.")
7
Erythrocyte Membrane Proteins
Horizontal Interaction Vertical Interaction HS HE HPP HSt

8
Source of Bilirubin Metabolism of heme mg/kg/day. (adults 3-4mg/kg/day) 75%: from hemoglobin of old RBCs released from RES. 1gr produces 34mg of bilirubin. 25%: from ineffective erythropoyesis, myoglobine, cytochromes, catalase, peroxidase. 2

9
Albumin- Bilirubin UCB Biliary ducts Endoplasm. Retic. UDPGA UCB
BMG and BDG UGT Biliary ducts Endoplasm. Retic.

10
UGT gene 5’ 3’ UGT 1 locus Enzyme UGT 285 aa 246 aa
1*7 1*6 1*4 1*1 2 3 UGT 1 locus mRNA Enzyme UGT NH2 COOH Substrate binding UDPGA binding 285 aa 246 aa

11
Radioactive PCR of UGT1A promoter
Exon 1 2 3 4 5 5’ 3’ C - 53 - 39 (TA)6 TAA D bp 100 bp 98 bp 1 2 3 4 (TA)6/(TA)7 (TA)6/(TA)6 (TA)6/(TA)6 (TA)7/(TA)7
6 TAA. D bp. 100 bp. 98 bp (TA)6/(TA)7. (TA)6/(TA)6. (TA)6/(TA)6. (TA)7/(TA)7.")
12
Transcriptional evaluation of the UGT promoter by luciferase assay
UGT1A1 activity TA TA TA8

13
UGT1A1 activity during perinatal period

15
Hereditary spherocytosis and Gilbert
UGT1 Promoter jaundiced Not jaundiced A(TA)7TAA/A(TA)7TAA 29(97%) 1(3%) A(TA)7TAA/A(TA)6TAA 83(56%) 65(44%) A(TA)6TAA/A(TA)6TAA Total 112(63%) 66(37%)
7TAA/A(TA)7TAA 29(97%) 1(3%) A(TA)7TAA/A(TA)6TAA 83(56%) 65(44%) A(TA)6TAA/A(TA)6TAA. Total 112(63%) 66(37%)")
16
Gallstones and UGT1A Genotype UGT1A Gallstones NO gallst. (TA)6/(TA)6
8(24%) 25(76%) (TA)7/(TA)7 7 (87,5%) 1 (12,5%) Total (37%) 26 (63%)
 25(76%) (TA)7/(TA)7 7 (87,5%) 1 (12,5%) Total 15 (37%) 26 (63%)")
17
Monogenic diseases ? Genotype Phenotype Environment Modifier genes

18
Consulenza genetica I1 I2 II1 Femmina, 7 aa Anamnesi familiare:
Negativa per anemia Negata consanguineità Anamnesi personale: All’età di 3 aa osservato pallore Anemia microcitica associata a riduzione dell’indice di saturazione della transferrina I1 I2 II1

19
Indagini di laboratorio
Analita v.n. RBC 4-5.2 *106/uL 2.9 Hb 13-16 g/dL 6.7 Hct 36-49 % 20 MCV 80-98 fL 65 Ferritina ng/mL 25 Sideremia ug/dL 14 Transferrina mg/dL 290 IS transferrina 15-45% 3.7 Elettroforesi dell’Hb: assenza di Hb patologiche HbF e HbA2: non elevate Sangue occulto nelle feci: negativo Calprotectina fecale: nella norma EGDS: nulla da segnalare

20
Ferro per os Risposta assente Prima del trattamento Hb 6.7 MCV 65
Solfato ferroso (220 mg/die) – 3 somministrazioni lontane dai pasti – durata 3 mesi Prima del trattamento Hb 6.7 MCV 65 Ferritina 25 Sideremia 14 Transferrina 290 IS transferrina 3.7 Dopo il trattamento 6.6 66 24 13 291 3.7 Risposta assente
 – 3 somministrazioni lontane dai pasti – durata 3 mesi. Prima del trattamento. Hb MCV. 65. Ferritina. 25. Sideremia. 14. Transferrina IS transferrina Dopo il trattamento Risposta assente.")
21
Ferro saccarato (770 mg) – durata 1 mese
Ferro per ev Ferro saccarato (770 mg) – durata 1 mese Prima del trattamento RBC 2.9 Hb 6.7 MCV 65 Ferritina 25 Sideremia 14 Transferrina 290 IS transferrina 3.7 Dopo il trattamento 4.7 9.5 63 46 16 250 6.4 Risposta Presente, Ma temporanea
 – durata 1 mese. Prima del trattamento. RBC Hb MCV. 65. Ferritina. 25. Sideremia. 14. Transferrina IS transferrina Dopo il trattamento Risposta Presente, Ma temporanea.")
22
DNA Analisi delle regioni codificanti del gene TMPRRS6 *c.749T>C p.I212T * c.926G>A p.R271Q * * IRIDA

23
Iron metabolism The total body iron content of an average male adult is about 4 g; Total iron: Red cell mass as haemoglobin – 65%-75% Muscles as myoglobin – 10% Storage as ferritin - 10% Bone marrow Reticulo-endothelial cells Liver (0.5-1 g) Other Haem proteins - 5% Cytochromes, others In Serum - 0.1% Iron balance is maintained by the meticulous regulation of iron absorption from the intestine because there is no regulated pathway for iron excretion (Andrews, NEJM, 1999)
 Other Haem proteins - 5% Cytochromes, others. In Serum - 0.1% Iron balance is maintained by the meticulous regulation of iron absorption from the intestine because there is no regulated pathway for iron excretion. (Andrews, NEJM, 1999)")
24
Iron content in the body in different age
Newborn (3,300 Kg) Children(35 Kg) Adult (75 Kg) Total iron mg 1,5 – 2 g 3 -4 g HB 132 – 137,5 mg (55%) 1 – 1,4 g (68%) 2,04 – 2,72 g (68%) Ferritin 101 – 105 mg (42%) 400 – 500 mg (27%) 0,81 -1,08 g (27%) Myoglobin 7 -7,5 mg (3%) 60 – 80 mg (4%) 120 – 160 mg (4%) Enzyme 9 – 12 mg (0,6%) 18 – 24 mg (0,6%) Transferrin 15 – 20 mg (0,1%) 3 – 4 mg (0,1%) 1kg body weight= 50 mg Fe Iolascon A et al.,2013
 Children(35 Kg) Adult (75 Kg) Total iron mg. 1,5 – 2 g g. HB. 132 – 137,5 mg (55%) 1 – 1,4 g (68%) 2,04 – 2,72 g (68%) Ferritin. 101 – 105 mg (42%) 400 – 500 mg (27%) 0,81 -1,08 g (27%) Myoglobin. 7 -7,5 mg (3%) 60 – 80 mg (4%) 120 – 160 mg (4%) Enzyme. 9 – 12 mg (0,6%) 18 – 24 mg (0,6%) Transferrin. 15 – 20 mg (0,1%) 3 – 4 mg (0,1%) 1kg body weight= 50 mg Fe. Iolascon A et al.,2013.")
25
Absorption and metabolism of iron
Ferritin Use Transport Erythroid precursors Storage Recycling Iolascon A, De Falco L Semin Hematol Oct;46(4):
:")
26
Sistemic regulation- Hepcidin, a key regulator of iron homeostasis
The liver peptide hepcidin is the main regulator of systemic iron homeostasis, since it influences the macrophages and in duodenal activity of the iron exporter ferroportin though its internalization and degradation. C. Beaumont Nemeth et al., Science 2004

27
Iron deficiency and iron deficiency anemia
Iolascon A et al.,2013

28
Characters of this story
RBC: Microcytosis hypochromia reduced size and reduced Hb content of red blood cells, as inferred by erythrocyte indexes Normal values for age MCH: <26 pg (n.v 27-30) MCHC: <30 g/dl (n.v.31-37) Age MCV (fl) At born 5-24 months 80-85 2-6 years 75-90 6-12 years 78-95 >12 years 80-100 Peripheral blood smear
 MCHC: <30 g/dl (n.v.31-37) Age. MCV (fl) At born months years years >12 years Peripheral blood smear.")
29
Characters of this story
RDW: red cell distribution width (measure of anysocytosis, e.g. dual populations) HRC: % hypochromic red cells CHr: reticulocyte Hb content Serum iron Transferrin Transferrin saturation Serum ferritin Soluble transferiin receptor Hepcidin assay
 HRC: % hypochromic red cells. CHr: reticulocyte Hb content. Serum iron. Transferrin. Transferrin saturation. Serum ferritin. Soluble transferiin receptor. Hepcidin assay.")
30
Microcytic anemias: Classification
Heme synthesis Porphyrias Erythropoietic porphyria Sideroblastic anaemias X-linked X-linked with ataxia Autosomal recessive (due to glutaredoxin 5 or to Gly transporter deficiency) Globin synthesis Thalassaemias Hemoglobinopathies Iron metabolism Hereditary hypotransferrinaemia Aceruloplasminaemia Divalent metal transporter 1 (DMT1) disease Ferroportin disease TMPRSS6 deficiency Iolascon A et al.,2013
 Globin synthesis. Thalassaemias. Hemoglobinopathies. Iron metabolism. Hereditary hypotransferrinaemia. Aceruloplasminaemia. Divalent metal transporter 1 (DMT1) disease. Ferroportin disease. TMPRSS6 deficiency. Iolascon A et al.,2013.")
31
Diseases of Hepcidin Dysregulation
Iron deficiency anemia Iron Normal homeostasis Hepcidin Dysregulation of hepcidin gives rise to a variety of iron disorders. In anemia of inflammation, iron-refractory iron deficiency anemia and hepcidin-secreting tumors, hepcidin production is inappropriately high, iron concentrations in plasma decrease and the supply of iron for is restricted, causing anemia. In hereditary hemochromatosis and iron-loading anemias hepcidin production is inappropriately low and iron absorption and cellular release are increased. Plasma iron concentrations are high causing tissue iron overload and iron toxicity. Hereditary haemochromatosis Iron-loading Anaemias Anaemia of Inflammation Iron-refractory iron-deficiency anaemia Hepcidin-secreting tumors Ganz T. J Am Soc Nephol. 2007;18: Ganz T, Nemeth E. Am J Physiol Gastrointest Liver Physiol. 2006;290:G199-G203. Courtesy of Tomas Ganz, PhD, MD.

32
Differential diagnosis of the most common forms of microcytosis
Nutritional deficiency Deficit of absorption Thalassemia heterozygotes ACD ACD+iron deficiency Hb - = / - -- MCV GR + RDW = = / + Reticulocytes = / + / - IS - / -- Ferritin FEP sTfR CHr Oral response YES NO Not to be expected Partial Iv response Inheritance Acquired Acquired / multifactorial AR Multifactorial Suggested therapy Oral iron Etiological therapy / iv injection if severe anemia Not required Etiological therap yif possible (EPO, iv iron) Etiological therap + oral iron Iolascon A et al.,2013
 Etiological therap + oral iron. Iolascon A et al.,2013.")
33
Differential diagnosis of the less common forms of microcytosis
IRIDA Erythropoietic protoporphyria Sideroblastic anemia X-linked Sideroblastic anemia X-linked with ataxia Microcytic anemia sideroblastic-like (GLRX5) Deficiency of DMT1 Hypotransferrinemia Aceruloplasminemia Deficiency of Steap3 Hb - /-- - --- (età dipendente) -- --- MCV GR RDW = Reticulocytes SI -- /--- + ++ 100% Ferritin = / - +++ FEP Oral response NO YES Iv response YES, not long-lasting Inheritance AR AD/AR X- linked AR/AD Suggested therapy not possible b-carotene Vit B6 Iron chelation EPO Plasma / apotransferrin EPO, iron chelation Iolascon A et al.,2013
 Deficiency of DMT1. Hypotransferrinemia. Aceruloplasminemia. Deficiency of Steap3. Hb. - / (età dipendente) MCV. GR. RDW. = Reticulocytes. SI. -- / % Ferritin. = / FEP. Oral response. NO. YES. Iv response. YES, not long-lasting. Inheritance. AR. AD/AR. X- linked. AR/AD. Suggested therapy. not possible. b-carotene. Vit B6. Iron chelation. EPO. Plasma / apotransferrin. EPO, iron chelation. Iolascon A et al.,2013.")
34
Treatment TO evaluate the response to treatment IRON WITH meals
ORAL TREATMENT ADVERS EFFECTS OF ORAL TREATMENT YES NO TO evaluate the response to treatment IRON WITH meals Adverse effects NO YES YES NO ORAL IRON Iv therapy -LOW COMPLIANCE -malabsorption -BLOOD loss continue treatment with oral iron YES NO Iv therapy reassessment diagnostic Iolascon A et al.,2013

35
Defects of iron Metabolism
Defective iron transport or utilization DMT1 deficiency, Hypo-transferrinemia Defects of iron absorption IRIDA (Iron-Refractory Iron Deficiency Anemia) Defects of mitochondrial iron utilization Inherited (and acquired) Sideroblastic Anemias Defects of iron recycling usually normocytic-normochromic anemias Aceruloplasmina, ACD (some cases)
 Defects of mitochondrial iron utilization. Inherited (and acquired) Sideroblastic Anemias. Defects of iron recycling. usually normocytic-normochromic anemias. Aceruloplasmina, ACD (some cases)")
36
The role of TMPRSS6 in the hepcidin regulatory pathway
BMP s-HJV m-HJV BMPRs P SMAD 1-5-8 complex SMAD 1-5-8 complex TMPRSS6 P SMAD 1-5-8 complex SMAD 4 mRNA HAMP P Adapted from Silvestri L, et al. Blood. 2009;113:

37
TMPRSS6 gene and protein
C TM SEA CUB CUB L L L SERINE PROTEASE ATG STOP ATG R271Q I212T S304L Y141C S570fs W247fs C510S L166fs Q229fs S561X N: .amino-terminus C1r/C1s, urchin embryonic growth factor and bone morphogenic protein 1 domain C: carboxy-terminus L: low density lipoprotein receptor clas A domain (LDLR) TM: transmembrane domain Serine Protease: serine protease domain SEA: sea urchin sperm protein, enteropeptidase agrin Black oval: cleavage activation site CUB: complement protein subcomponents Iolascon et al.2010
 TM: transmembrane domain. Serine Protease: serine protease domain. SEA: sea urchin sperm protein, enteropeptidase agrin. Black oval: cleavage activation site. CUB: complement protein subcomponents. Iolascon et al")
38
Laboratory findings of IRIDA-TMPRSS6 mutations
MCV 47-60 fL Serum Iron - Tf saturation sTfR ++ BM sideroblasts FEP + Liver Iron n Neonatal appearance +/- Effect oral /iv Fe Serum or urinary Hepcidin Inheritance AR Therapy Iolascon A et al.,2013

39
Aknowledgements: my coworkers at CEINGE , Naples

40
Prevalence of Iron Deficiency and Iron Deficiency Anemia
UK Asie du Sud-Est France USA 7% 2% 8% 2% 4% 2% 20% 10% ? 20.7% 5% 1983 28% 16% 59% 36% Côte-d'Ivoire Philippine Islands Iron nutrition and iron status changes in Italian ininfants in the last decade (ISS), 1995
,")
41
Breastfeeding and Iron
The initiation of solid food should not be delayed 4-6 months after birth (Boyce at al, 2011) Weaning food should be initiated 4 months after birth for infants without risk for atopic dermatitis (Schoetzau et al, 2002) Children need at least 1 month to adapt to solid food (Kang et al, 2006) When nutrition is provided only by breastfeeding for more than 6 months iron intake is insufficient (Hyung etal,2013) Weaning food (low risk) Weaning food (lhigh risk) ID if only breastfeeding Birth 4 months 6 months
 Weaning food should be initiated 4 months after birth for infants without. risk for atopic dermatitis (Schoetzau et al, 2002) Children need at least 1 month to adapt to solid food (Kang et al, 2006) When nutrition is provided only by breastfeeding for more than 6 months. iron intake is insufficient (Hyung etal,2013) Weaning food. (low risk) Weaning food. (lhigh risk) ID if only breastfeeding. Birth. 4 months. 6 months.")
42
Meat and Iron Red Meat: -beef, horse , heep,
meat products red meat poultry meat sausages Child Adolescent Adult Indagine INRAN-SCAI Red Meat: -beef, horse , heep, duck… White Meat: - rabbit, chicken, turkey, pig… Iron content Horse 3.2 mg/100g Turkey 2.5 mg/100g Beef 2.1 mg/100g Pig 1.5 mg/100g Chicken

Presentazioni simili