Scaricare la presentazione
La presentazione è in caricamento. Aspetta per favore

1
Lo screening di popolazione per il carcinoma della prostata
Nicola Nicolai Urologia Fondazione IRCCS Istituto Nazionale Tumori Milano

2
Criteri per l’applicazione dello screening
Applicazione per CaP Malattia frequente e con prognosi severa Sì. Primo tumore per incidenza, secondo per mortalità Tests semplici di facile impiego in grado di far porre diagnosi in fasi di malattia precoci e asintomatiche Sì. PSA (DRE?) Il trattamento della malattia in fasi più precoci comporta una riduzione della morbilità e mortalità Non (ancora) provato Favorevole rapporto costo/beneficio: costo dell’esame, dei trattamenti, delle complicazioni
 Il trattamento della malattia in fasi più precoci comporta una riduzione della morbilità e mortalità. Non (ancora) provato. Favorevole rapporto costo/beneficio: costo dell’esame, dei trattamenti, delle complicazioni.")
3
Aspetti clinici e metodologici che condizionano
un programma di screening Reclutamento coerente Periodo, età ed aree geografiche omogenee Non influenze sul gruppo di controllo: Evitare “contaminazione” (che soggetti control effettuino uno screening opportunistico) Randomizzazione e mascheramento Metodo diagnostico Frequenza, strumenti (DRE, PSA, n° bx) Distorsione derivata dalla tipologia della malattia rilevata con lo screening Lead bias e Length bias Elevato numero di malattie apparentemente o di fatto meno aggressive Entità del rilievo di malattie nei periodi di intervallo (interval cancers) Sovradiagnosi (diagnosi di malattia che non avrebbe condizionato la vita) Sovratrattamento (trattamento della malattia sovradiagnosticata: Effetti collaterali da trattamento non giustificati)
 Randomizzazione. e mascheramento. Metodo diagnostico. Frequenza, strumenti (DRE, PSA, n° bx) Distorsione derivata. dalla tipologia della malattia. rilevata con lo screening. Lead bias e Length bias. Elevato numero di malattie. apparentemente o di fatto. meno aggressive. Entità del rilievo di malattie. nei periodi di intervallo (interval cancers) Sovradiagnosi. (diagnosi di malattia che non. avrebbe condizionato la vita) Sovratrattamento. (trattamento della malattia sovradiagnosticata: Effetti collaterali da trattamento non giustificati)")
4
Lead time bias Lo screening anticipa la diagnosi di malattia fornendo l’apparenza di intervalli di sopravvivenza più lunghi

5
Length time bias Sotto screening è più facile fare diagnosi di malattie a storia clinica più lunga; le malattie più aggressive tendono a “scappare dalle maglie” dello screening

8
q 1 anno; DRE-PSA-(TRUS) Bx: sestanti ± mirate Norkopping
22 settembre 2012, h – 13.00 Studio Screening CaP Tipo, end point Tot Screen/C ontrol Commenti Quebec Labrie et Al. Prostate 2004;59(3):311-8 R DSS 46486 S C15353 Quebec city area (R 2:1) q 1 anno; DRE-PSA-(TRUS) Bx: sestanti ± mirate Norkopping Sandblom et Al. Eur Urol 2004;46:717-24 Non R non mascherato DSS 9026 S C7532 Norrköping (R 1:6) q 3 anni; DRE (MMG e Urol, poi solo MMG per 2 rounds) e PSA (dopo) Bx: sestanti PCLO Andriole et Al. N Engl J Med 2009;360: R mascherato 76693 S 38343 C 38350 10 centri USA (R 1:1) q 1 anno: PSA (per 6 a) + DRE (per 4 a) ERSPC Schröder et Al. N Engl J Med 2009;360: 162243 S 72890 C 89353 8 paesi europei (R 1:1) q 4 anni; PSA
: R DSS S C Quebec city area (R 2:1) q 1 anno; DRE-PSA-(TRUS) Bx: sestanti ± mirate. Norkopping. Sandblom et Al. Eur Urol 2004;46: Non R non mascherato. DSS S 1494 C7532. Norrköping (R 1:6) q 3 anni; DRE (MMG e Urol, poi solo MMG per 2 rounds) e PSA (dopo) Bx: sestanti. PCLO. Andriole et Al. N Engl J Med 2009;360: R. mascherato S C centri USA (R 1:1) q 1 anno: PSA (per 6 a) + DRE (per 4 a) ERSPC. Schröder et Al. N Engl J Med 2009;360: S C paesi europei (R 1:1) q 4 anni; PSA.")
9
Cfr tra screen Vs no screen effettivo nei 2 bracci
22 settembre 2012, h – 13.00 Cfr tra screen Vs no screen effettivo nei 2 bracci (24%) (93%) 62% di riduzione di rischio di morte
 (93%) 62% di riduzione di rischio. di morte.")
10
3.9% 5.7% Voci p Organ Confined .001 M1 .001 HG <.005
22 settembre 2012, h – 13.00 Voci p Organ Confined .001 M HG <.005 20 (51.3%) scr 97 (56.7%) no No difference in DSS 3.9% 5.7%
 scr. 97 (56.7%) no. No difference in DSS. 3.9% 5.7%")
11
22 settembre 2012, h – 13.00 Sistematic Screening

12
PLCO: 1993-2001, 76,693 men randomly assigned at 10 U.S. study centers
to receive either annual screening (PSA & DRE) or usual care (NEJM march 2009) incidence of death per 10,000 person-years: 2.0 (50 DOD) in the screening group Vs 1.7 (44 DOD) in the control group (RR, 1.13; 95% CI, 0.75 to 1.70). incidence per 10,000 person-years: 116 (2820 ca) in the screening group Vs 95 (2322 ca) in the control group (RR, 1.22; 95% CI, 1.16 to 1.29); Compliance: 85% for PSA; 86% for DRE. FU: 7 yrs.
 or usual care (NEJM march 2009) incidence of death per 10,000 person-years: 2.0 (50 DOD) in the screening group Vs 1.7 (44 DOD) in the control group (RR, 1.13; 95% CI, 0.75 to 1.70). incidence per 10,000 person-years: 116 (2820 ca) in the screening group Vs 95 (2322 ca) in the control group (RR, 1.22; 95% CI, 1.16 to 1.29); Compliance: 85% for PSA; 86% for DRE. FU: 7 yrs.")
13
PLCO 76,693 men annual PSA testing for 6 years and DRE for 4 years Vs control Compliance: 85% PSA and 86% DRE Median FU: 7 years incidence rate ratio: 1.22 for screened arm (95% CI, 1.16 to 1.29) rate ratio for death from PC in the screened group: 1.13; 95% (CI, to 1.70) The data at 10 years were 67% complete and consistent with these overall findings Death from PC was very low and did not differ significantly between the two study groups ERSPC 182,000 men PSA screening every 4 yearsVs control Compliance: 82% accepted median FU: 9years cumulative incidence of prostate cancer was 8.2% in the screening group and 4.8% in the control group rate ratio for death from PC in the screening group: 0.80 (95% CI, to 0.98) The absolute risk difference: death per 1000 men 1410 men would need to be screened and 48 additional cases of prostate cancer would need to be treated to prevent one death from prostate cancer PSA-based screening reduced the rate ofdeathfrom PC by 20% butassociatedwith a high riskofoverdiagnosis
 rate ratio for death from PC in the screened group: 1.13; 95% (CI, 0.75 to 1.70) The data at 10 years were 67% complete and consistent with these overall findings. Death from PC was very low and did not differ significantly between the two study groups. ERSPC. 182,000 men. PSA screening every 4 yearsVs control. Compliance: 82% accepted. median FU: 9years. cumulative incidence of prostate cancer was 8.2% in the screening group and 4.8% in the control group. rate ratio for death from PC in the screening group: 0.80 (95% CI, 0.65 to 0.98) The absolute risk difference: 0.71 death per 1000 men men would need to be screened and 48 additional cases of prostate cancer would need to be treated to prevent one death from prostate cancer. PSA-based screening reduced the rate ofdeathfrom PC by 20% butassociatedwith a high riskofoverdiagnosis.")
14
After 20 years of follow-up the rate of death from prostate cancer did not differ significantly between men in the screening group and those in the control group BMJ 2011;342:d1539

15
52% of contamination! J Natl Cancer Inst 2012;104:125–132
Screening PSA/yr for 6 + DRE/yr for 4 Vs Usual Care 52% of contamination! 92% followed to 10 years 57% followed to 13 years cumulative PCa mortality intervention arm: 3.7 x person/years control arm: 3.4 x person/years non-statistically significant difference s (RR = 1.09, 95% CI = 0.87 to 1.36) No statistically significant interactions for age (Pinteraction = .81) pretrial PSA testing (Pinteraction = .52) comorbidity (Pinteraction = .68). J Natl Cancer Inst 2012;104:125–132
 No statistically significant interactions for age (Pinteraction = .81) pretrial PSA testing (Pinteraction = .52) comorbidity (Pinteraction = .68). J Natl Cancer Inst 2012;104:125–132.")
16
7408 in the intervention group (SA) 6107 in the control group (CA)
rate ratio of PCa mortality 0·85 (0·70–1·03) at 9 years 0·78 (0·66–0·91) at 11 years, 0·79 (0·69–0·91) at 13 years absolute risk reduction at 13 yrs: 0·11 per 1000 person-years or 1·28 per 1000 men randomised one PCa death averted per 781 men invited for screening one per 27 additional prostate cancer detected The rate ratio (SA/CA) 1·91 (95% CI 1·83–1·99) at 9 years, 1·66 (1·60–1·73) at 11 years, 1·57 (1·51–1·62) after 13 years. Rate ratio of PCa mortality in men screened was 0·73 (95% CI 0·61–0·88), after adjustment for non-participation Published online August 7,
 at 9 years. 0·78 (0·66–0·91) at 11 years, 0·79 (0·69–0·91) at 13 years. absolute risk reduction at 13 yrs: 0·11 per 1000 person-years. or 1·28 per 1000 men randomised. one PCa death averted per 781 men invited for screening. one per 27 additional prostate cancer detected. The rate ratio (SA/CA) 1·91 (95% CI 1·83–1·99) at 9 years, 1·66 (1·60–1·73) at 11 years, 1·57 (1·51–1·62) after 13 years. Rate ratio of PCa mortality in men screened was 0·73 (95% CI 0·61–0·88), after adjustment for non-participation. Published online August 7,")
17
The main weakness of screening is a high rate of overdiagnosis and overtreatment.
We conclude that the time for population-based screening has not arrived. In the present situation, early diagnosis cannot be refused to men who are well informed and request to be tested. Published online August 7,

18
ERSPC: NEJM march 2009

19
Lo screening opportunistico
Lo screening effettuato individualmente È oramai talmente diffuso che surroga la condizione dello screening di massa

20
2011 2012 abitanti PSA PSA/1000 abitanti totale 28.730.886 6.340.326
2011 2012 abitanti PSA PSA/1000 abitanti totale 221 215 età 45-75 583 562 Courtesy Dott. Massimo Gion

21
Incidenza* del tumore della prostata in Italia e per area geografica nel tempo
* Tassi standardizzati per persone/anno (popolazione standard europea), età 0-99 anni
, età 0-99 anni.")
22
Incidenza del tumore della prostata in Europa e nel mondo nel tempo - tassi standardizzati (popolazione mondiale) CI5.iarc.fr Australia: New Zealand: USA: seer.cancer.gov NORDCAN ( ECO (eco.iarc.fr) England: * Dati regionali
 England: * Dati regionali.")
23
Carcinoma prostatico Una delle maggiori differenze per sopravvivenza tra nazioni Incidenza aumentata Sopravvivenza a 5 anni (standardizzata per area ed età) migliorata dal 65% (EUROCARE-3, ) al 76%
 migliorata dal 65% (EUROCARE-3, ) al 76%")
24
Carcinoma della prostata in Italia NUMERO DI CASI
22 settembre 2012, h – 13.00 Carcinoma della prostata in Italia NUMERO DI CASI anno morti casi incidenti casi prevalenti 1990 5660 12600 36500 1999 6960 25900 93500 2005 9200 43000 174000 Fonte: stime MIAMOD, ISS, Roma

25
Ca di Polmone e di Prostata in Italia (proiezioni al 2005)
22 settembre 2012, h – 13.00 NUMERO DI CASI Ca di Polmone e di Prostata in Italia (proiezioni al 2005) tumore morti casi incidenti casi prevalenti prostata 9200 44000 174000 polmone 22000 26000 55000 Fonte: stime MIAMOD, ISS, Roma
 tumore. morti. casi incidenti. casi prevalenti. prostata polmone Fonte: stime MIAMOD, ISS, Roma.")
26
Stime di incidenza e mortalità per tumore della prostata in Italia
Courtesy Dott. Annalisa Trama

27
Il progetto “Prostate cancer survival patients in Italy”
Obiettivi: descrivere le pratiche diagnostico-terapeutiche per il tumore della prostata nella popolazione italiana e nel tempo ( vs ) analizzare ed interpretare la diversa sopravvivenza per tumore della prostata in alcune popolazioni residenti in diverse regioni italiane Courtesy Dott. Annalisa Trama
 analizzare ed interpretare la diversa sopravvivenza per tumore della prostata in alcune popolazioni residenti in diverse regioni italiane. Courtesy Dott. Annalisa Trama.")
28
Incidenza* del tumore della prostata in Italia e per area geografica nel tempo
Courtesy Dott. Annalisa Trama * Tassi standardizzati per persone/anno (popolazione standard europea), età 0-99 anni
, età 0-99 anni.")
29
Analisi e Registri coinvolti
Courtesy Dott. Annalisa Trama

30
22 settembre 2012, h – 13.00 May 22nd 2012 “Prostate cancer is a serious health problem that affects thousands of men and their families. But before getting a PSA test, all men deserve to know what the science tells us about PSA screening: there is a very small potential benefit and significant potential harms. We encourage clinicians to consider this evidence and not screen their patients with a PSA test unless the individual being screened understands what is known about PSA screening and makes the personal decision that even a small possibility of benefit outweighs the known risk of harms.” Based on this work, the Task Force concludes that many men are harmed as a result of prostate cancer screening and few, if any, benefit.A better test and better treatment options are needed. Until these are available, the USPSTF has recommended against screening for prostate cancer.

31
No < 40 anni Not recommended but high risk Individualized 55-69 Every 2 yrs Not recommended > 70 but excellent health

32
There is currently no evidence for introducing widespread population-based screening programmes for early PCa detection in all men [8] (LE: 2).
![There is currently no evidence for introducing widespread population-based screening programmes for early PCa detection in all men [8] (LE: 2).](http://slideplayer.it/slide/2782962/10/images/32/There+is+currently+no+evidence+for+introducing+widespread+population-based+screening+programmes+for+early+PCa+detection+in+all+men+%5B8%5D+%28LE%3A+2%29..jpg "There is currently no evidence for introducing widespread population-based screening programmes for early PCa detection in all men [8] (LE: 2).")
33
22 settembre 2012, h – 13.00 Screening e PSA Che fare di fronte ad una richiesta individuale di un soggetto asintomatico? Fattori di rischio MMG e specialista Individuo Familiarità ed età Risk Calculators Informazione Motivazione Screening

34
Come comportarsi? Medico Paziente Considerare il paziente
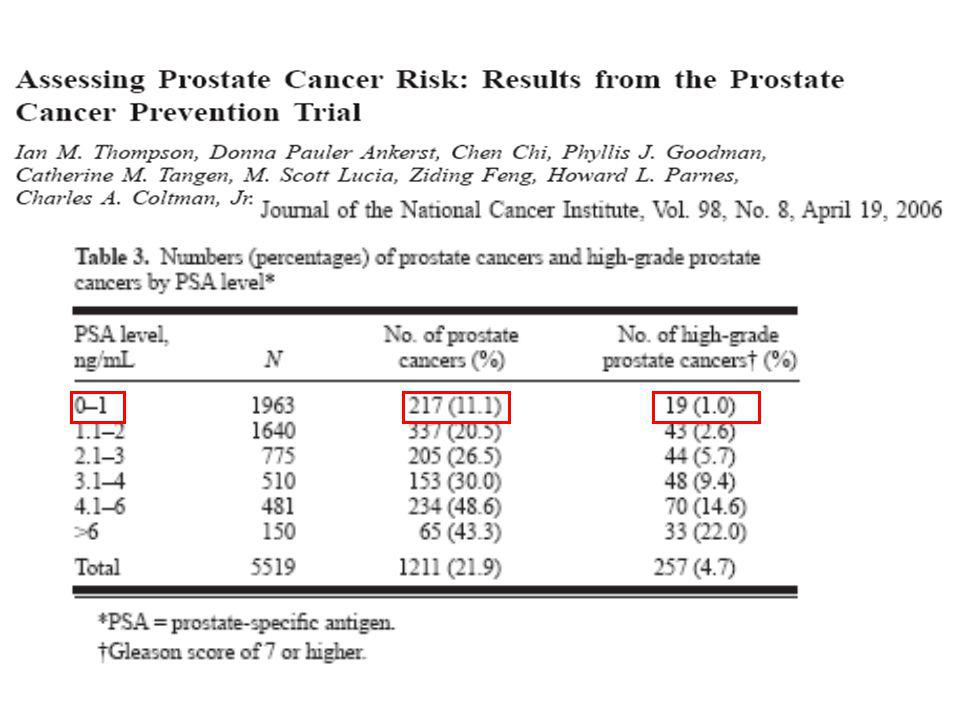
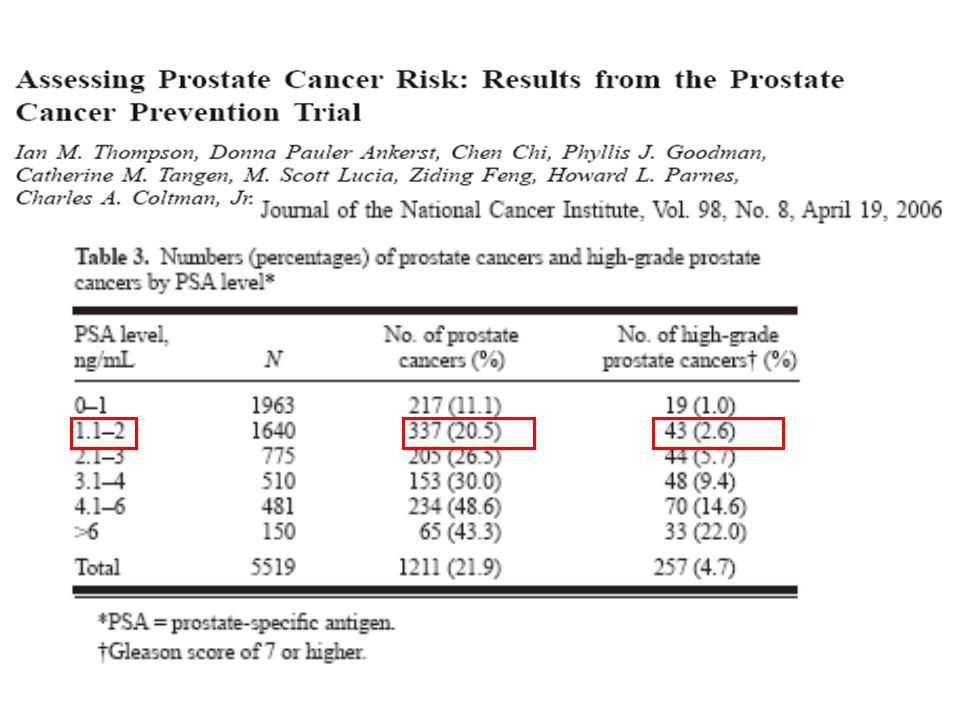
22 settembre 2012, h – 13.00 Come comportarsi? Medico Paziente Considerare il paziente Morbilità e attesa di vita Considerare rischio di malattia ad alto grado Se il rischio è < 5%, valutare i rischi della procedura (es: rischio infezione severa (US) è tra 2 e 4% Considerare il rapporto tra rischio di malattia a basso grado e di malattia ad alto grado Se il rapporto è nettamente sfavorevole (es: 10 volte maggiore la p di basso rischio), valutare l’impatto negativo sulla vita del paziente di tale diagnosi (costi, rischi di overtreatment, spese assicurative) Approccio deliberativo e multidiscipli nare Enpowerme nt del pz Decisione che rispetta la persona e la sua volontà
 è tra 2 e 4% Considerare il rapporto tra rischio di malattia a basso grado e di malattia ad alto grado. Se il rapporto è nettamente sfavorevole (es: 10 volte maggiore la p di basso rischio), valutare l’impatto negativo sulla vita del paziente di tale diagnosi (costi, rischi di overtreatment, spese assicurative) Approccio deliberativo e multidiscipli nare. Enpowerme nt del pz. Decisione che rispetta la persona e la sua volontà.")
Presentazioni simili
 Università degli Studi, Pavia (founder) IRCCS Fondazione.>")


>")

>")


