Scaricare la presentazione
La presentazione è in caricamento. Aspetta per favore

1
Mario Tiribelli Clinica Ematologica di Udine
LMC Ph+: introduzione alla patologia, diagnosi, sintesi delle linee guida, stato dell’arte e network internazionali Mario Tiribelli Clinica Ematologica di Udine

2
LMC in fase cronica: presentazione clinica
Asintomatica nel 50% dei casi Sintomatologia clinica Astenia Febbricola Perdita di peso/anoressia Senso di distensione addominale Laboratorio Leucocitosi Piastrinosi Obiettività clinica Splenomegalia Faderl S et al, Ann Intern Med 1999; 131: Goldman JM, Curr Opin Hematol 1997; 4:

3
LMC: le 3 fasi del decorso clinico
Fase cronica Fase avanzata Accelerata Fase blastica Durata media 4-6 anni Durata media sino a 1 anno Sopravvivenza media 3-6 mesi

4
Leucemia mieloide cronica – Sospetto diagnostico
leucocitosi con neutrofilia (soprattutto se GB > /cc) presenza di cellule immature circolanti (mieloblasti, metamielociti) aumento di basofili e talora eosinofili piastrinosi (30%) splenomegalia
 presenza di cellule immature circolanti (mieloblasti, metamielociti) aumento di basofili e talora eosinofili. piastrinosi (30%) splenomegalia.")
5
t(9;22)(q34;q11) t = translocation q = long arm of chromosom
Il Cromosoma Philadelphia: la causa della malattia Traslocazione reciproca t(9;22)(q34;q11) t = translocation q = long arm of chromosom Proteina di fusione BCR/ABL con attività tirosin-chinasica che rappresenta la causa della LMC
(q34;q11) t = translocation q = long arm of chromosom. Proteina di fusione BCR/ABL con attività tirosin-chinasica che rappresenta la causa della LMC.")
6
Tutto parte da qui..

7
E arriva qui.. Quest teoria sifonda su un dogma…. La chiave di tutto è BCRABL che crea instabilità e condizioni di progressione BCR- ABL

8
PATHWAYS ACTIVATED BY BCR-ABL EXPRESSION
RAS BCR/ABL Increased mitogenic signal NUCLEUS F-actin Paxillin ABL Cell Cycle Changes in adhesion to stromal layer Inhibition of apoptosis Decreased normal ABL function at nuclear level: genomic instability

9
Leucemia mieloide cronica… l’inevitabile destino senza terapia..
Fase cronica Fase accelerata Crisi blastica

10
leucemia mieloide cronica
Fase cronica Fase accelerata Crisi blastica terapia

11
LEUCEMIA : tappe della evoluzione della terapia
(1850) chemioterapia (1950) tempo tanto… „il nulla“ Ph1 (1960) Trapianto IFN BCR/ABL PCR Imatinib (studio IRIS) Nuovi inibitori TK
 chemioterapia. (1950) tempo. tanto… „il nulla Ph1 (1960) Trapianto IFN. BCR/ABL PCR. Imatinib (studio IRIS) Nuovi inibitori TK.")
12
ALLOGENEIC TRANSPLANT (THE SEATTLE EXPERIENCE)
Doney K et al.: Treatment of chronic granulocytic leukemia by chemotherapy, total body irradiation and allogeneic bone marrow transplantation. Exp Hematol 6, 1978, ALLOGENEIC TRANSPLANT IN CML (THE SEATTLE EXPERIENCE) Clift and Storb, BMT 1996
 Clift and Storb, BMT")
13
SOPRAVVIVENZA IFN vs CHT

14
STI 571 - Imatinib (Glivec) Classe: 2-fenilaminopirimidin-derivato
Peso Molecolare: 590 Da

15
Il meccanismo d’azione di questa molecola è quello di infilarsi nella tasca dell’ATP della proteina BCR/ABL, impedendo all’ATP stesso di legarsi. La mancanza di ATP priva la tirosi-kinasi BCR/ABL della fonte di gruppi fosforici necessari ad esercitare la sua funzione sui substrati. In tal modo vengono bloccate tutte quelle vie metaboliche attivate in modo anomalo da BCR/ABL e responsabili della trasformazione leucemica.

16
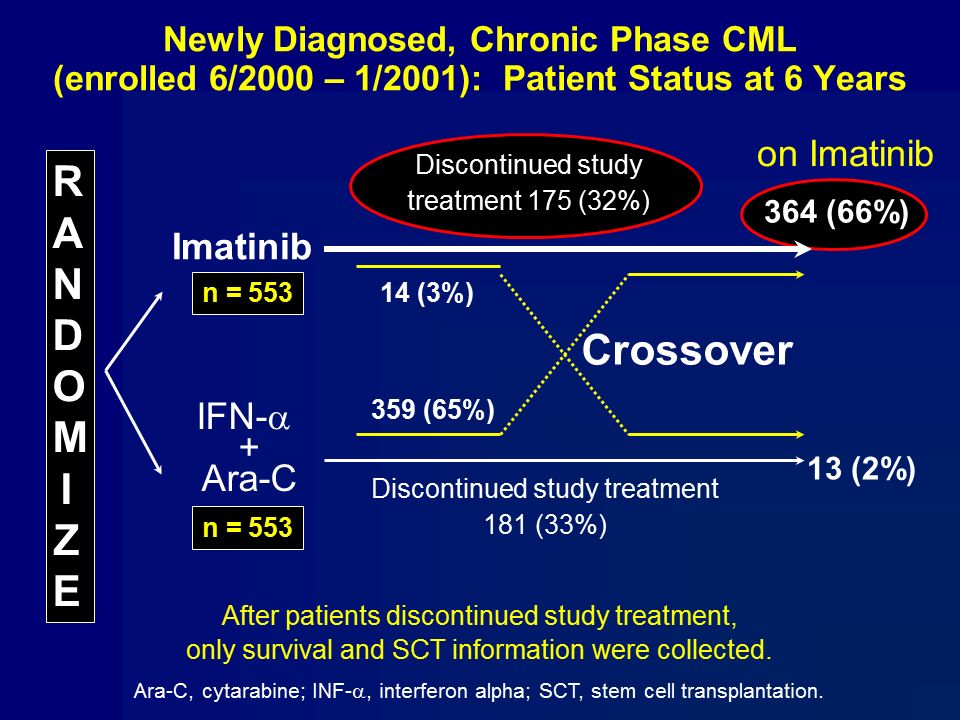
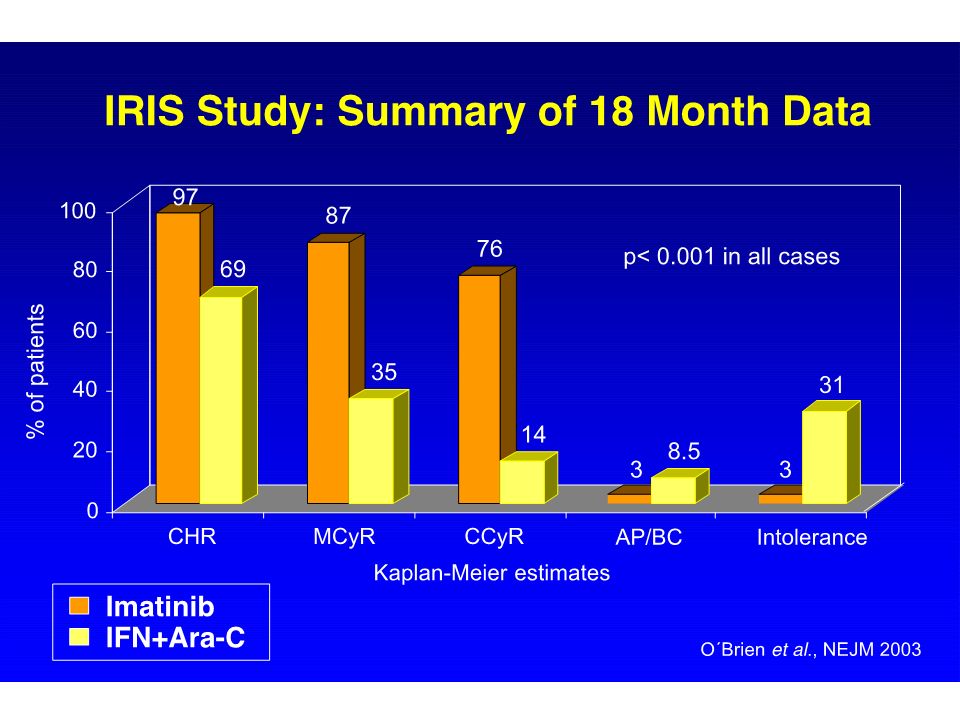
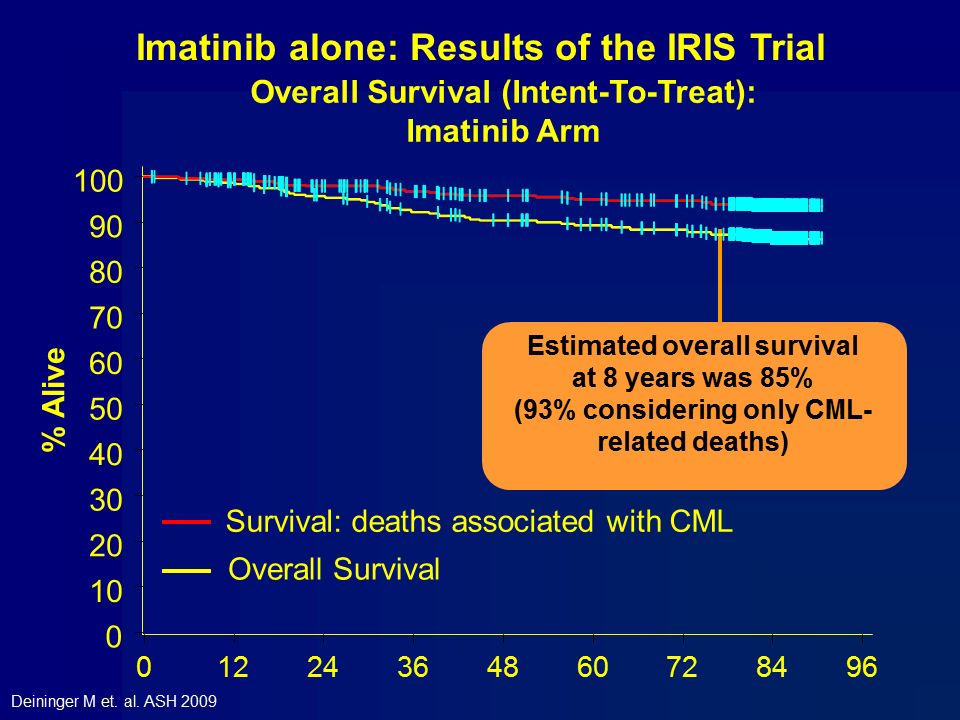
Imatinib: la prima terapia mirata

20
Druker et al. N Engl J Med (2006) 355: 2408-17
ICSG. N Engl J Med (1994) 330:
 330:")
21
Kantarjian et al. Cancer 2008
Incidence of CCyR, MMR and CMR (undetectable bcr-abl at 4.5 log) with Imatinib – the MDACC experience Kantarjian et al. Cancer 2008
 with Imatinib – the MDACC experience. Kantarjian et al. Cancer")
22
12-Month Landmark Analysis - Hammersmith
. 96% 74% n = 121 n = 72 de Lavallade H et al. JCO 2008;26:

23
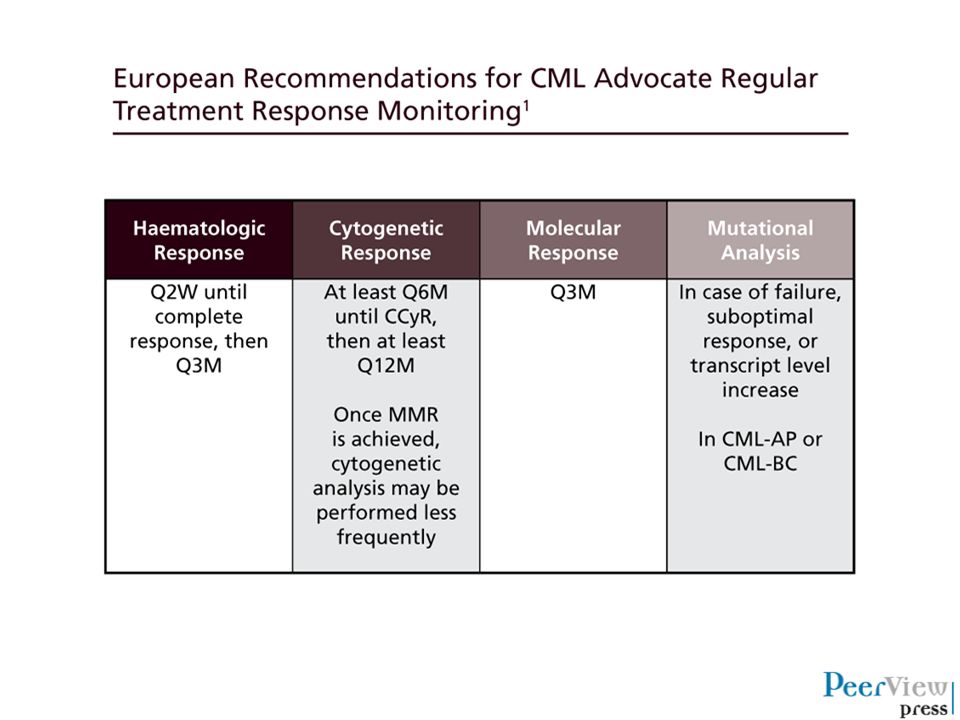
Routine Methods for Monitoring CML Disease Burden
There are 3 routine methods for measuring CML disease burden: Hematologic response (HR) Measure of blood counts and differentials Cytogenetic Response (CyR) Chromosome-banding analysis of marrow cell metaphases Molecular response (MR) Measurement of BCR-ABL transcript levels relative to a control gene 1 2 3
 Measure of blood counts and differentials. Cytogenetic Response (CyR) Chromosome-banding analysis of marrow cell metaphases. Molecular response (MR) Measurement of BCR-ABL transcript levels relative to a control gene")
24
Number of Leukemic Cells BCR-ABL Transcripts (log10)
Correlation Between Response and Disease Burden Among Detection Methods Number of Leukemic Cells 1012 Hematologic Cytogenetic 1011 CHR (< 1-log) 1010 CCyR (2-log) RQ-PCR 109 MMR (3-log) BCR-ABL Transcripts (log10) 108 107 ≈ 5-log reduction 106 Dx Time BCR-ABL levels measured via RQ-PCR correlate with standard HR and CyR criteria1-3 RQ-PCR provides ≥ 3-log greater assay sensitivity than cytogenetics1 CHR, complete HR; Dx, diagnosis; MMR, major MR; RQ-PCR, real-time quantitative polymerase chain reaction. 1. Radich JP. Blood. 2009;114: ; 2. Baccarani M, et al. Blood. 2006;108: ; 3. Cross NC, et al. Blood. 1993;82:
 CCyR (2-log) RQ-PCR MMR (3-log) BCR-ABL Transcripts (log10) ≈ 5-log reduction Dx. Time. BCR-ABL levels measured via RQ-PCR correlate with standard HR and CyR criteria1-3. RQ-PCR provides ≥ 3-log greater assay sensitivity than cytogenetics1. CHR, complete HR; Dx, diagnosis; MMR, major MR; RQ-PCR, real-time quantitative polymerase chain reaction. 1. Radich JP. Blood. 2009;114: ; 2. Baccarani M, et al. Blood. 2006;108: ; 3. Cross NC, et al. Blood. 1993;82:")
25
Glivec… va bene per tutti? Risultato non soddisfacente
Obiettivo raggiunto Risultato non soddisfacente Intolleranza Resistenza Perdita risposta 8% 17% 15%

26
Resistance to treatment
Primary resistance – patient fails to achieve a desired response to initial treatment Secondary resistance – patient with an initial response to a TKI ultimately relapses

27
Optimal Response & Time Limit to Achieve it
Hematological 1 month CHR Cytogenetic 3 - 6 months CCyR Molecular 12 (??) months MMR Time from start of therapy
 months MMR. Time from start of therapy.")
28
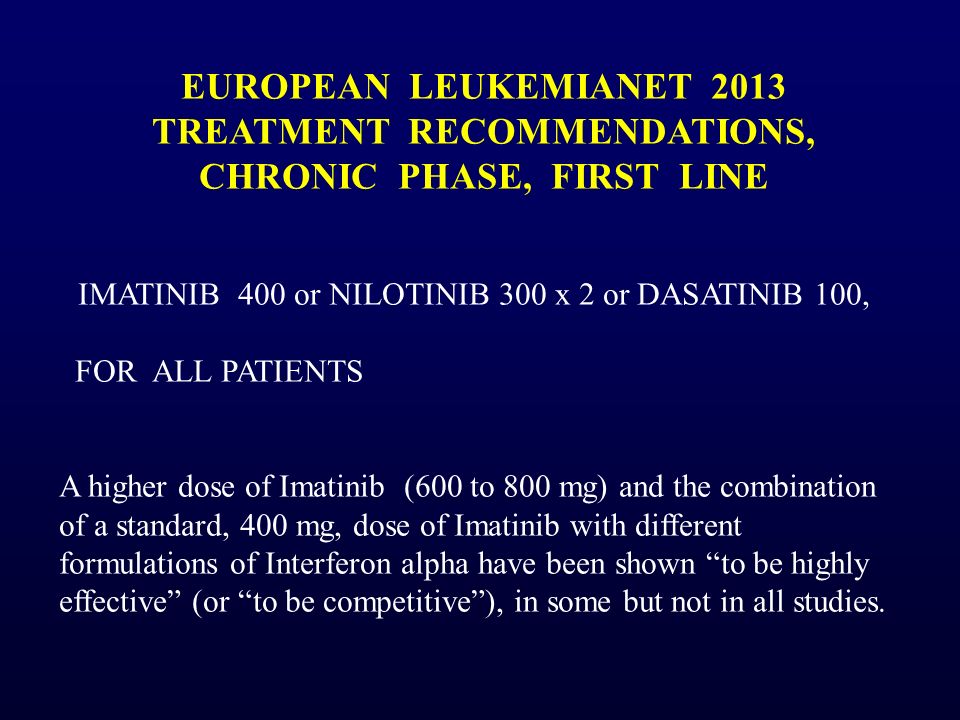
European LeukemiaNet 2013 recommendations
OPTIMAL WARNING FAILURE Baseline NA - High risk (Sokal, Euro, Eutos) - CCA/Ph+ (major route) 3 months - BCR-ABL ≤ 10% and/or - Ph+ ≤ 35% - BCR-ABL > 10% - Ph % - No CHR - Ph+ > 95% 6 months - BCR-ABL < 1% - Ph+ 0% - BCR-ABL 1-10% - Ph+ 1-35% - Ph+ > 35% 12 months - BCR-ABL ≤ 0.1% - BCR-ABL >0.1-1% - BCR-ABL > 1% - Ph+ > 0% CCA, clonal cytogenetic abnormalities; CHR, complete hematologic response. Baccarani et al. Blood 2013;122: 28
 - CCA/Ph+ (major route) 3 months. - BCR-ABL ≤ 10% and/or. - Ph+ ≤ 35% - BCR-ABL > 10% - Ph % - No CHR. - Ph+ > 95% 6 months. - BCR-ABL < 1% - Ph+ 0% - BCR-ABL 1-10% - Ph+ 1-35% - Ph+ > 35% 12 months. - BCR-ABL ≤ 0.1% - BCR-ABL >0.1-1% - BCR-ABL > 1% - Ph+ > 0% CCA, clonal cytogenetic abnormalities; CHR, complete hematologic response. Baccarani et al. Blood 2013;122:")
29
BCR-ABLIS<9.8% in 211/279 pts (76%)
")
30
BCR-ABLIS<10% in 501/692 pts (72%)
")
32
I farmaci di nuova generazione per la LMC

33
Inibitori tirosin chinasi di seconda generazione
Piu potenti di imatinib Efficaci nelle mutazioni resistenti a imatinib Profili di tossicità differenti da imatinib

34
Resistenza o intolleranza
Diagnosi o Gli inibitori di seconda generazione sono in grado di produrre una risposta efficace in circa il 50% dei pazienti resistenti o intolleranti a imatinib

35
Resistenza o intolleranza
diagnosi o

50
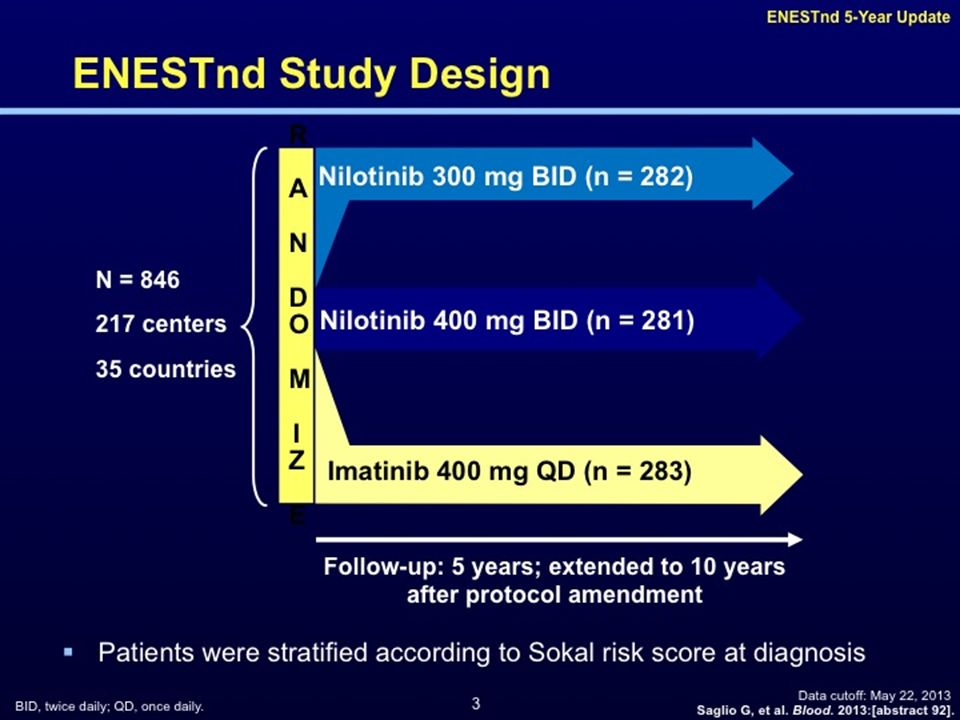
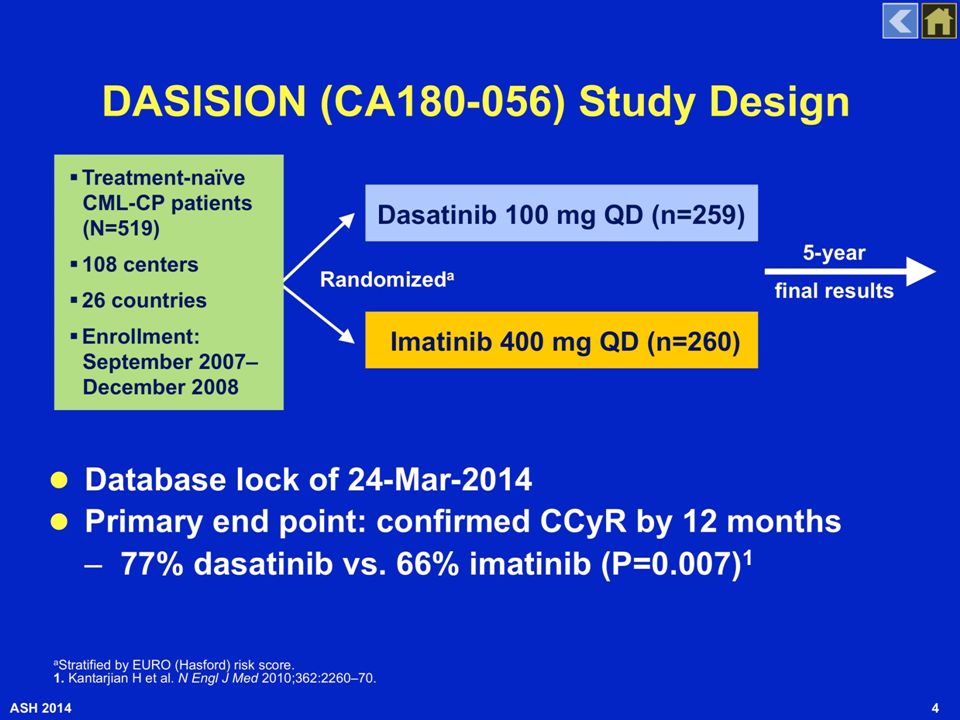
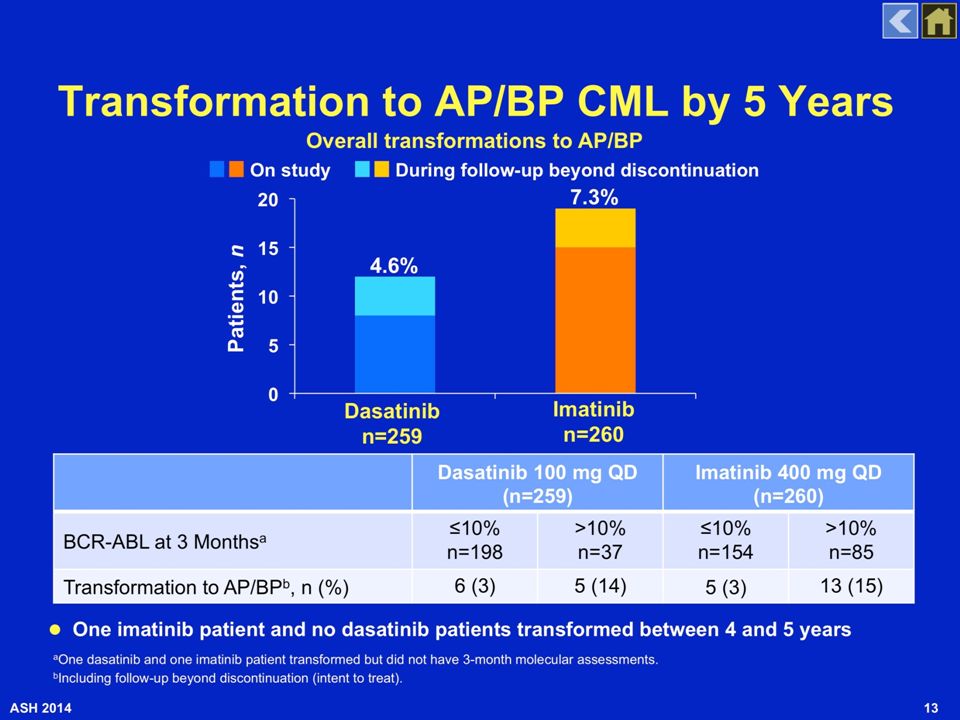
Dasatinib and Nilotinib in de-novo CML
DASISION 1,2 ENESTnd 3,4 Dasatinib 100 mg QD Imatinib 400 mg QD Nilotinib 300 mg BID BCR-ABL ≤ 10%IS at 3 mo. 84% 63% 90.7% 66.7% CCyR by 1 year 83% 72% 80% 65% MMR by 2 years 64% 46% 71% 44% MR4.5 by 4 years 40% 23% 34% 21% 4-yrs rate of progression to accelerated / blastic phase 3.1% 5.4% 0.7% 4.2% 4-yrs survival 92.9% 92.1% 93.6% 91.6% Data from different studies. No direct comparison between dasatinib or nilotinib is possible or suggested. 1 Kantarjian et al. N Engl J Med 2010;362: Cortes et al. ASH Saglio et al. N Engl J Med 2010;362: Saglio et al. ASH 2013.

51
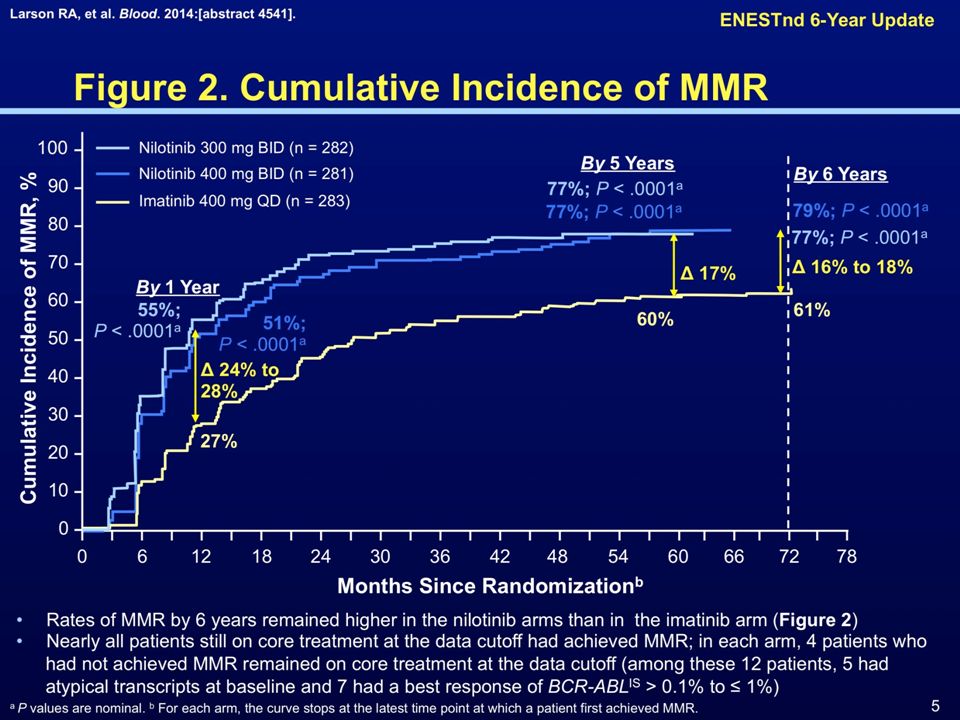
Cumulative incidence of MMR and MR4.5
with frontline Nilotinib and Dasatinib Giles F et al., EJCI 2012

52
MR4.5 può essere un preditore di sopravvivenza
La MR4.5 a 4 anni è stata associata ad una significativamente maggiore probabilità di OS rispetto alla CCR (8 anni OS, 92% contro 83%). Hehlman et al, JCO 2013
. Hehlman et al, JCO")
53
The evolution of treatment goals in CML
Nilotinib Dasatinib Earlier and Deeper molecular responses 53

57
Come valutare il paziente alla diagnosi
Come valutare il paziente alla diagnosi? Su quali elementi basare la scelta della terapia di prima linea?

61
The evolution of treatment goals in CML
Nilotinib Dasatinib Earlier and Deeper molecular responses SURVIVAL CURE? 61

62
Patients With Molecular and/or Cytogenetic Relapse, %
Achieving Deeper Molecular Responses May Be the First Step to Treatment-Free Remission Response at Time of TKI Discontinuation Patients With Molecular and/or Cytogenetic Relapse, % CCyR2 100% MMR5 MMR, CCyR, MCyR6 DMR for ≥ 2 years on imatinib1,3,7,8 ~30%-65% 1. Mahon FX, et al. Lancet Oncol. 2010;11: 2. Goh H-G, et al. Leuk Lymphoma. 2009;50: Goh H-G, et al. Blood. 2011;118:1189 [abstract 2763]. 4. Rea D, et al. Blood. 2011;118:277 [abstract 604]. 5. Koskenvesa P, et al. Blood. 2008;112:738 [abstract 2121]. 6. Kuwabara A, et al. Blood. 2010;116: 7. Rousselot P, et al. Blood. 2011;118:1615 [abstract 3781]. 8. Matsuki E, et al. Blood. 2011;118: [abstract 3765].

63
STIM1: Patients With Sustained CMR on Imatinib Can Maintain TFR
Results for principal objective: Estimated rate of TFR at 6 months was 45% (95% CI, 34-55)1 After a median follow-up of 55 mo, molecular relapse had occurred in 61 patients2 58 relapses occurred during the first 7 mo 3 late relapses occurred at mo 19, 20 and 22 Survival Without CML Treatment Months Since Discontinuation of Imatinib 100 90 80 70 60 50 40 30 20 10 6 12 18 24 36 42 48 54 66 72 78 Estimated TFR at 60 months: 40% (95% CI, 30%-49%) STIM1 provided the first demonstration of the feasibility of TFR following TKI therapy in a large cohort of patients with sustained deep molecular response Mahon FX, et al. Lancet Oncol. 2010;11: Mahon FX, et al. Blood. 2013;122(21):[abstract 255].
1. After a median follow-up of 55 mo, molecular relapse had occurred in 61 patients2. 58 relapses occurred during the first 7 mo. 3 late relapses occurred at mo 19, 20 and 22. Survival Without CML Treatment. Months Since Discontinuation of Imatinib Estimated TFR at 60 months: 40% (95% CI, 30%-49%) STIM1 provided the first demonstration of the feasibility of TFR following TKI therapy in a large cohort of patients with sustained deep molecular response. Mahon FX, et al. Lancet Oncol. 2010;11: Mahon FX, et al. Blood. 2013;122(21):[abstract 255].")
64
È possibile aumentare i pazienti eleggibili per il TFR?
100 Nilotinib 300 mg BID (n = 282) Nilotinib 400 mg BID (n = 281) 90 Imatinib 400 mg QD (n = 283) 80 By 5 Yearsa 70 By 4 Yearsa 60 54%, P < .0001 By 1 Yeara Patients With MR4.5, % 50 40%, P < .0001 52%, P < .0001 40 37%, P = .0002 Δ 21% to 23% 30 11%, P < .0001 31% Δ 14% to 17% 20 23% Δ 6% to 10% 7%, P < .0001 10 1% 1 2 3 4 5 6 Time Since Randomization, Calendar Years No patient who achieved MR4.5 on any arm progressed to AP/BC MR4.5, molecular response ≥ 4.5-logs (BCR-ABLIS ≤ %). a Cumulative response rates reported consider each year to consist of twelve 28-day cycles. Saglio G, et al. Blood. 2013:[abstract 92].
 Nilotinib 400 mg BID (n = 281) 90. Imatinib 400 mg QD (n = 283) 80. By 5 Yearsa. 70. By 4 Yearsa %, P < By 1 Yeara. Patients With MR4.5, % %, P < %, P < %, P = Δ 21% to 23% %, P < % Δ 14% to 17% % Δ 6% to 10% 7%, P < % Time Since Randomization, Calendar Years. No patient who achieved MR4.5 on any arm progressed to AP/BC. MR4.5, molecular response ≥ 4.5-logs (BCR-ABLIS ≤ %). a Cumulative response rates reported consider each year to consist of twelve 28-day cycles. Saglio G, et al. Blood. 2013:[abstract 92].")
66
CML and the PATH TO CURE

68
Coming back to the new ELN recommendations…
OPTIMAL WARNING FAILURE 3 months - BCR-ABL ≤ 10% and/or - Ph+ ≤ 35% - BCR-ABL > 10% - Ph % - No CHR - Ph+ > 95% 6 months - BCR-ABL < 1% - Ph+ 0% - BCR-ABL 1-10% - Ph+ 1-35% - Ph+ > 35% IF several studies have reported that a BCR-ABL >10% at 3 months is associated with an inferior survival, WHY was that BCR-ABL level not taken as an indication of failure mandating a change of therapy? 68

69
Not only the level but also the dynamics!
BCR-ABL %IS CCyR MMR Baseline 3° month 6° month 9° month 12° month 69

70
*These results are expressed as BCR-ABL/GUS ratio
Overall survival according to the RELATIVE* BCR-ABL reduction within 3 months The median BCR-ABL/GUS ratio was 15% at diagnosis ( ) and 0.70% at 3 months (0-84) reflecting a decline to the 0.05 fold (1.3 log decline). With regard to the above described parameters the following findings were observed: 1) At diagnosis no prognostic cut-off level could be identified. 2) A reduction to the 0.35-fold of the initial BCR-ABL transcript level at diagno- sis (0.46 log reduction) was identified as single best cut-off according to a max- imal hazard ratio (HR) of 6.4 for OS and separated a high-risk group of 64 pts (18% of pts, 8-year PFS 77%, 8-year OS 80%) from a good-risk group of 286 pts (82% of pts, 8-year PFS 93%, 8-year OS 94%, P<0.001, respectively). 3) At 3 months, four BCR-ABL/GUS cut-offs with comparably high hazard ratios were identified: 6%, HR 5.6; 10%, HR 6.0; 14%, HR 6.5 and 21%, HR 7.0. The 6% cut-off was used for further analysis due to its superior sensitivity including the largest proportion of high-risk patients. This optimized cut-off separated a high-risk group of 86 pts (25% of pts, 8-year PFS 79%, 8-year OS 83%) from a good-risk group of 264 pts (75% of pts, 8-year PFS 93%, 8-year OS 94%, P<0.001, respectively). 4) When the established 10% BCR-ABLIS landmark at 3 months was investigated, 88 pts were high-risk (25% of pts, 8-year PFS 83%, 8-year OS 86%) and 262 good-risk (75% of pts, 8-year PFS 92%, 8-year OS 93%, P=0.007 for PFS, P=0.008 and HR=3.4 for OS). *These results are expressed as BCR-ABL/GUS ratio Hanfstein et al. EHA 2013 70
 and 0.70% at 3 months (0-84) reflecting a decline to the 0.05 fold (1.3 log decline). With regard to the above described parameters the following findings were observed: 1) At diagnosis no prognostic cut-off level could be identified. 2) A reduction to the 0.35-fold of the initial BCR-ABL transcript level at diagno- sis (0.46 log reduction) was identified as single best cut-off according to a max- imal hazard ratio (HR) of 6.4 for OS and separated a high-risk group of 64 pts (18% of pts, 8-year PFS 77%, 8-year OS 80%) from a good-risk group of 286 pts (82% of pts, 8-year PFS 93%, 8-year OS 94%, P<0.001, respectively). 3) At 3 months, four BCR-ABL/GUS cut-offs with comparably high hazard ratios were identified: 6%, HR 5.6; 10%, HR 6.0; 14%, HR 6.5 and 21%, HR 7.0. The 6% cut-off was used for further analysis due to its superior sensitivity including the largest proportion of high-risk patients. This optimized cut-off separated a high-risk group of 86 pts (25% of pts, 8-year PFS 79%, 8-year OS 83%) from a good-risk group of 264 pts (75% of pts, 8-year PFS 93%, 8-year OS 94%, P<0.001, respectively). 4) When the established 10% BCR-ABLIS landmark at 3 months was investigated, 88 pts were high-risk (25% of pts, 8-year PFS 83%, 8-year OS 86%) and 262 good-risk (75% of pts, 8-year PFS 92%, 8-year OS 93%, P=0.007 for PFS, P=0.008 and HR=3.4 for OS). *These results are expressed as BCR-ABL/GUS ratio. Hanfstein et al. EHA")
Presentazioni simili


 devices receive FDA approval annually 3500 medium-risk (class II) products are approved for marketing.>")


>")


>")


